| Param | Original file | Final file |
|---|---|---|
| Filename | modeM0/AS1A13_004T13_9000005988_44313cztM0_level2.fits | modeM0/AS1A13_004T13_9000005988_44313cztM0_level2_quad_clean.evt |
| Size (bytes) | 459,760,320 | 113,676,480 |
| Size | 438.5 MB | 108.4 MB |
| Events in quadrant A | 5,411,145 | 763,488 |
| Events in quadrant B | 3,591,533 | 789,861 |
| Events in quadrant C | 3,092,396 | 754,962 |
| Events in quadrant D | 4,415,018 | 676,892 |
| Mode M0 | |||
|---|---|---|---|
| Quadrant | BADHDUFLAG | Total packets | Discarded packets |
| A | 0 | 21472 | 2 |
| B | 0 | 15016 | 2 |
| C | 0 | 13699 | 2 |
| D | 0 | 17409 | 2 |
| Mode SS | |||
|---|---|---|---|
| Quadrant | BADHDUFLAG | Total packets | Discarded packets |
| A | 0 | 136 | 0 |
| B | 0 | 136 | 0 |
| C | 0 | 136 | 0 |
| D | 0 | 136 | 0 |
| Mode M9 | |||
|---|---|---|---|
| Quadrant | BADHDUFLAG | Total packets | Discarded packets |
| A | 0 | 22 | 0 |
| B | 0 | 22 | 0 |
| C | 0 | 22 | 0 |
| D | 0 | 22 | 0 |
| Quadrant | Total seconds | Saturated seconds | Saturation percentage |
|---|---|---|---|
| A | 6548 | 305 | 4.657911% |
| B | 6549 | 200 | 3.053901% |
| C | 6549 | 91 | 1.389525% |
| D | 6549 | 375 | 5.726065% |
Noise dominated data is calculated using 1-second bins in cleaned event files. If a bin has >2000 counts, and if more than 50% of those come from <1% of pixels, then it is considered to be noise-dominated and hence unusable.
| Quadrant | # 1 sec bins | Bins with >0 counts | Bins with >2000 counts | High rate bins dominated by noise | Noise dominated (total time) | Noise dominated (detector-on time) | Marked lightcurve |
|---|---|---|---|---|---|---|---|
| A | 8733 | 6549 | 70 | 70 | 0.80% | 1.07% | 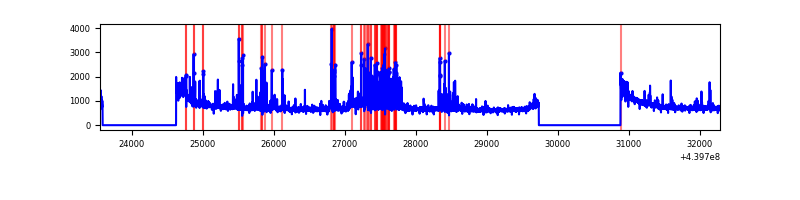 |
| B | 8734 | 6550 | 46 | 46 | 0.53% | 0.70% | 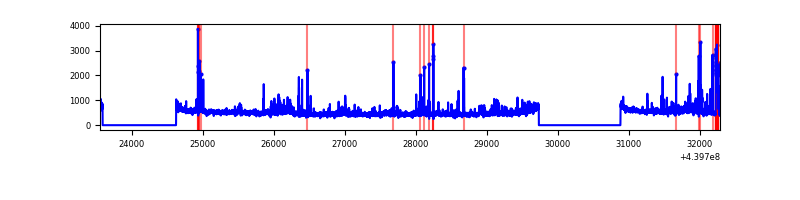 |
| C | 8734 | 6550 | 7 | 7 | 0.08% | 0.11% | 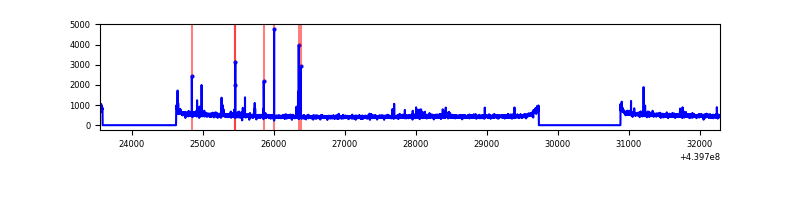 |
| D | 8734 | 6549 | 240 | 240 | 2.75% | 3.66% | 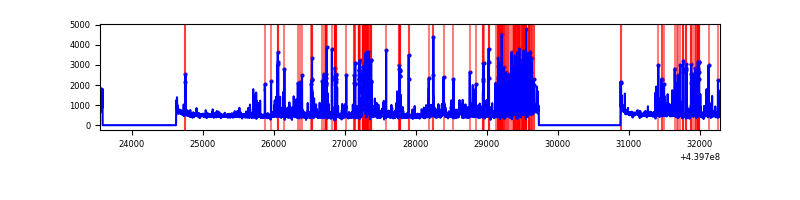 |
Top three noisy pixels from each quadrant. If the there are fewer than three noisy pixels in the level2.evt file, extra rows are filled as -1
| Pixel properties | Quadrant properties | ||||||
|---|---|---|---|---|---|---|---|
| Quadrant | DetID | PixID | Counts | Sigma | Mean | Median | Sigma |
| A | 10 | 83 | 1646068 | 10070.75 | 787 | 771 | 163.4 |
| A | 15 | 223 | 650949 | 3979.69 | 787 | 771 | 163.4 |
| A | 7 | 3 | 38516 | 231.03 | 787 | 771 | 163.4 |
| B | 5 | 172 | 149833 | 969.05 | 780 | 755 | 153.8 |
| B | 0 | 190 | 147155 | 951.64 | 780 | 755 | 153.8 |
| B | 5 | 255 | 55830 | 358.0 | 780 | 755 | 153.8 |
| C | 14 | 254 | 87906 | 484.15 | 766 | 768 | 180.0 |
| C | 1 | 3 | 10784 | 55.65 | 766 | 768 | 180.0 |
| C | 9 | 54 | 5772 | 27.8 | 766 | 768 | 180.0 |
| D | 13 | 249 | 612484 | 3255.64 | 760 | 738 | 187.9 |
| D | 5 | 235 | 166802 | 883.77 | 760 | 738 | 187.9 |
| D | 2 | 153 | 114038 | 602.97 | 760 | 738 | 187.9 |
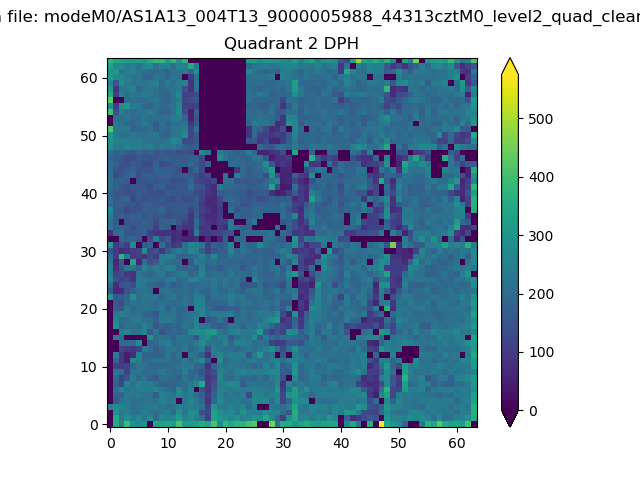
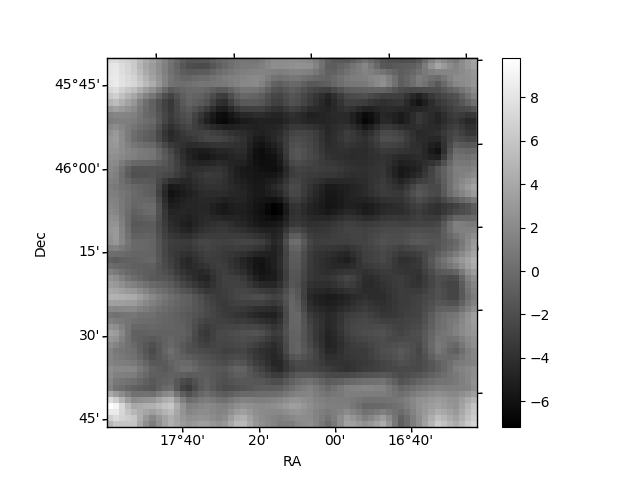
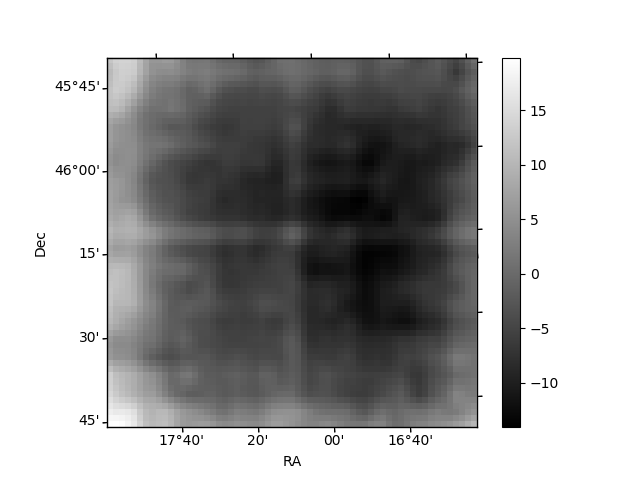
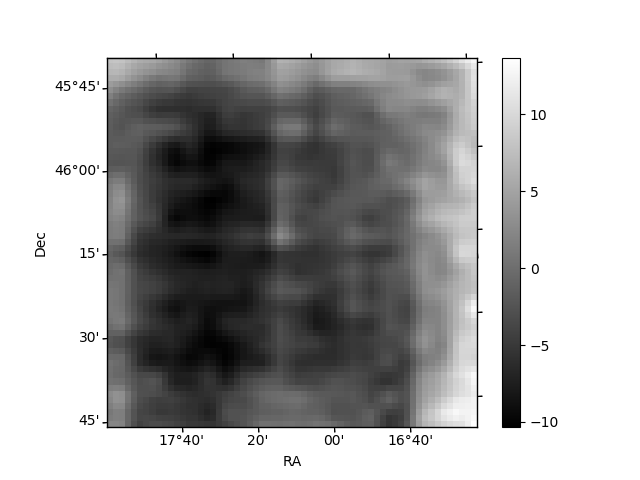
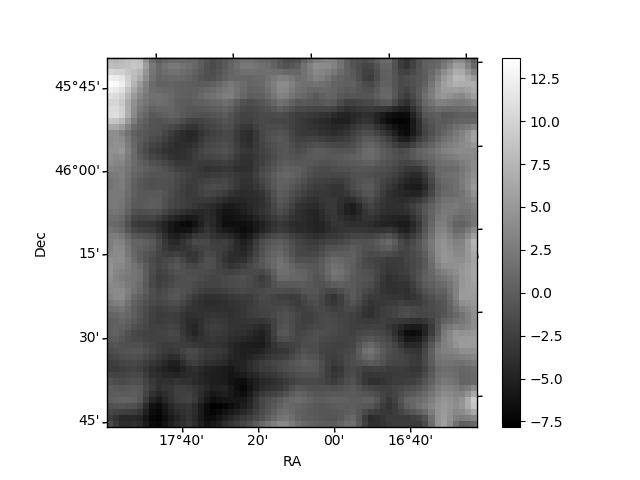
Histogram calculated using DETX and DETY for each event in the final _common_clean file
| Quadrant A | 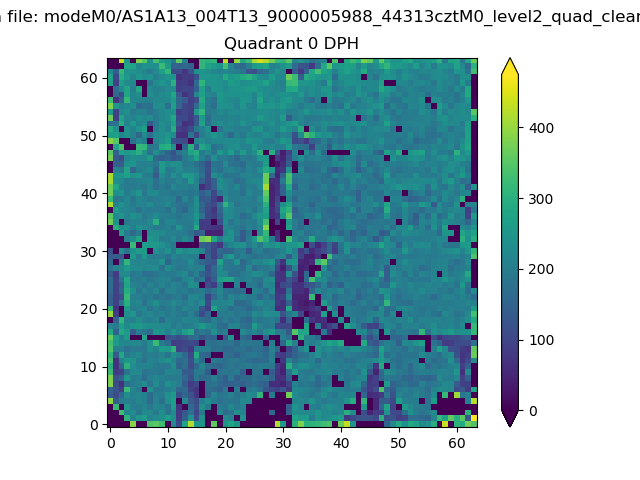 |
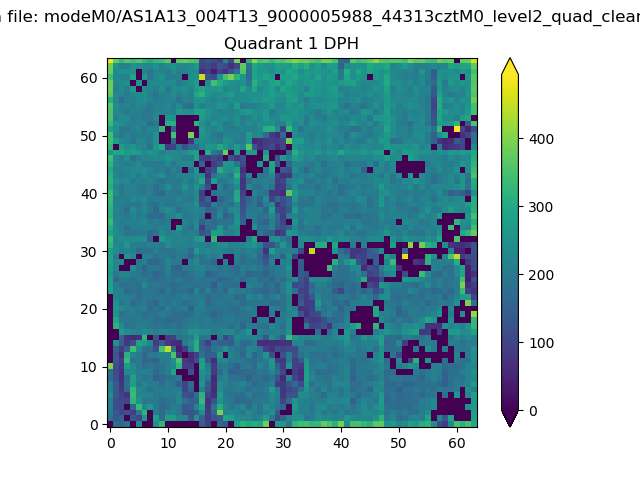 |
Quadrant B |
|---|---|---|---|
| Quadrant D | 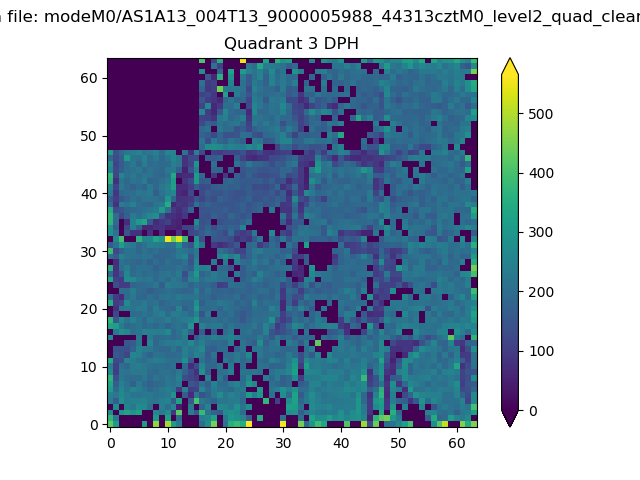 |
 |
Quadrant C |
| Plot type | Count rate plots | Images |
|---|---|---|
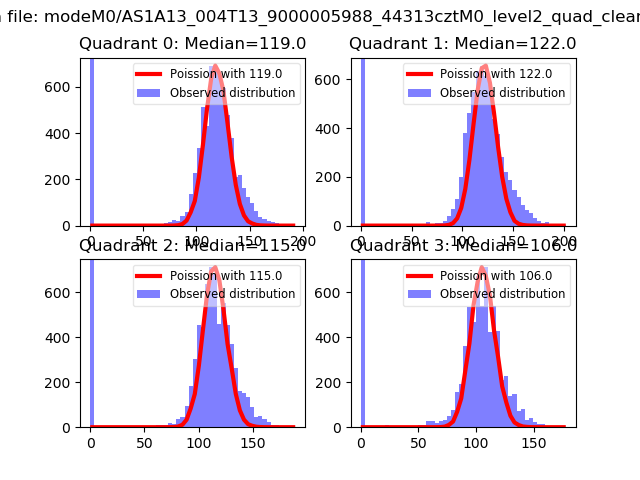
| Comparison with Poisson distribution Blue bars denote a histogram of data divided into 1 sec bins. Red curve is a Poisson curve with rate = median count rate of data. |
 |
 |
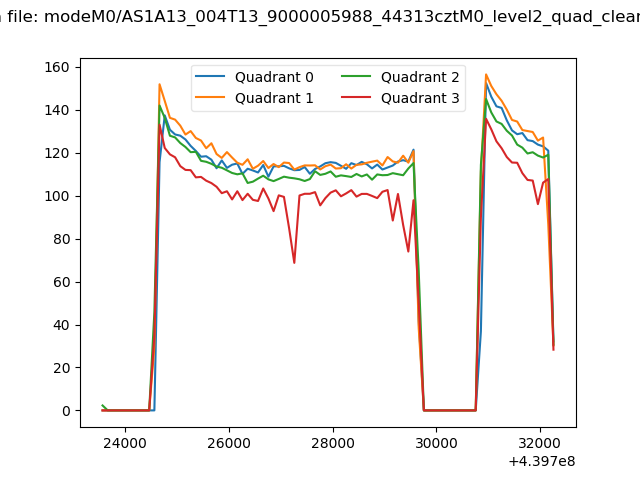
| Quadrant-wise count rates Data is divided into 100 sec bins |
 |
|
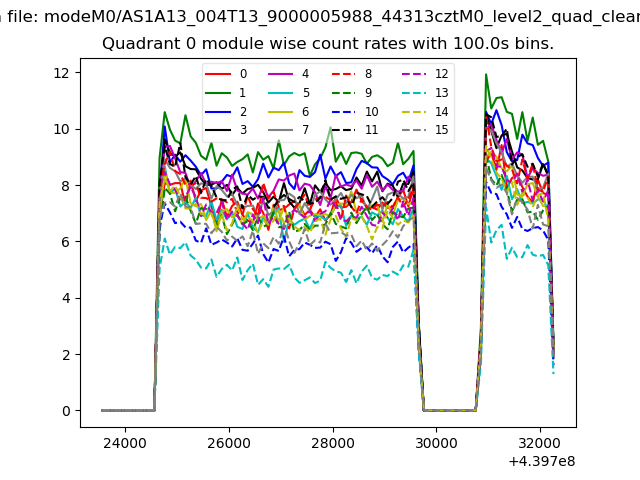
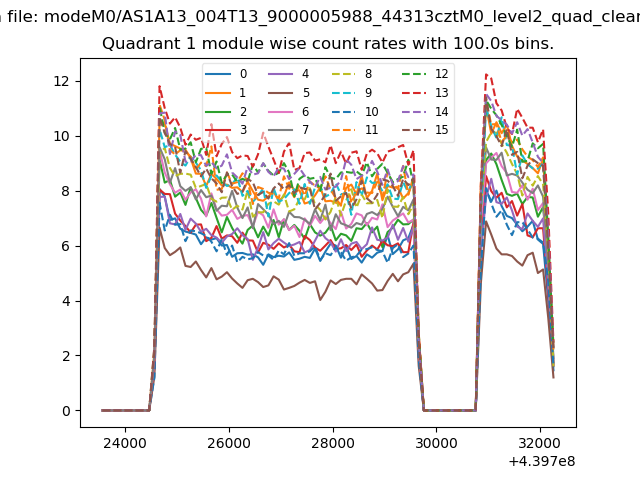
| Module-wise count rates for Quadrant A Data is divided into 100 sec bins |
 |
 |
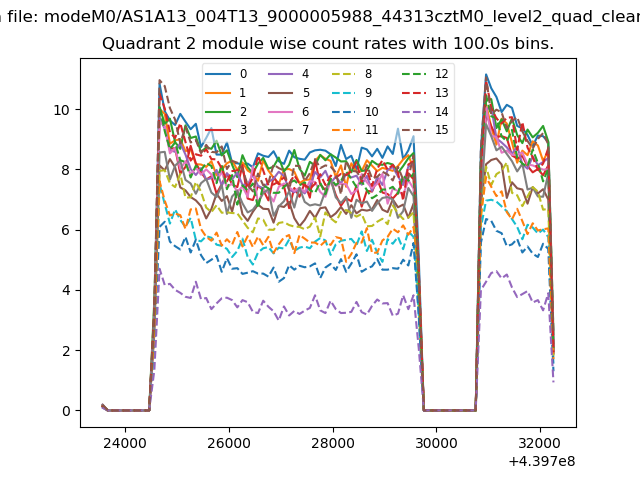
| Module-wise count rates for Quadrant B Data is divided into 100 sec bins |
 |
 |
| Module-wise count rates for Quadrant C Data is divided into 100 sec bins |
 |
 |
| Module-wise count rates for Quadrant D Data is divided into 100 sec bins |
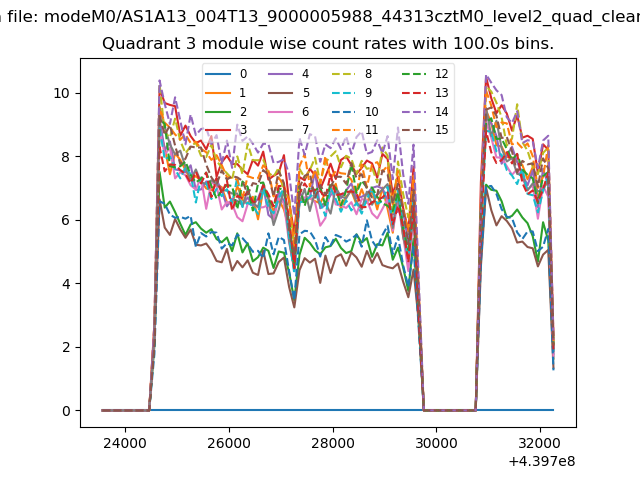 |
 |
| Parameter | Plot |
|---|---|
| CZT HV Monitor | 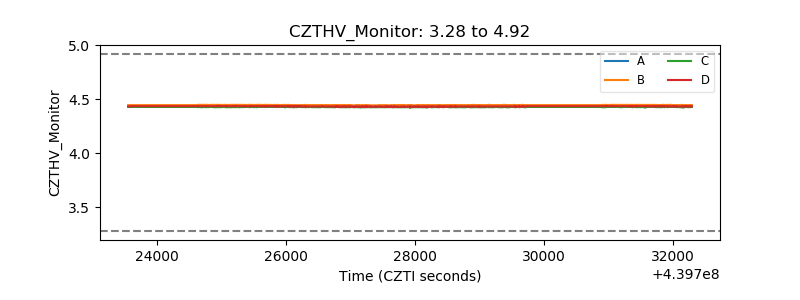 |
| D_VDD | 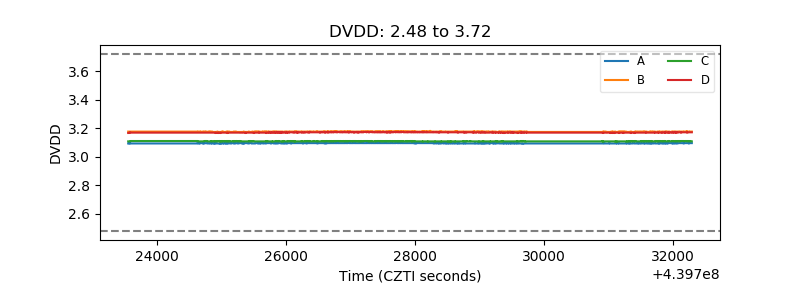 |
| Temperature 1 | 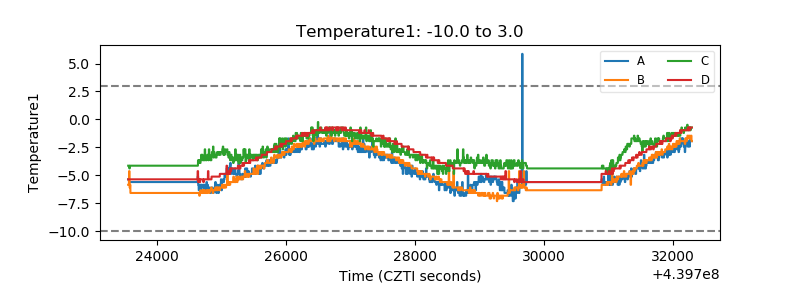 |
| Veto HV Monitor |  |
| Veto LLD | 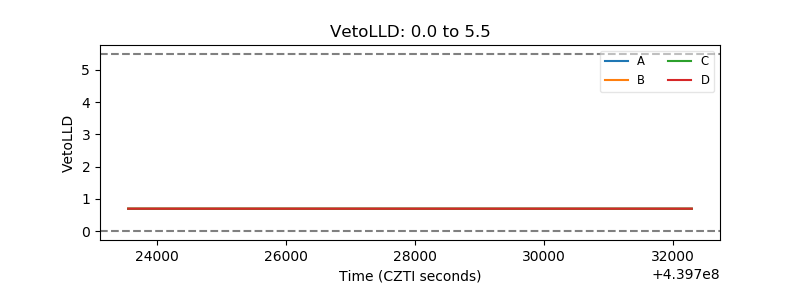 |
| Alpha Counter | 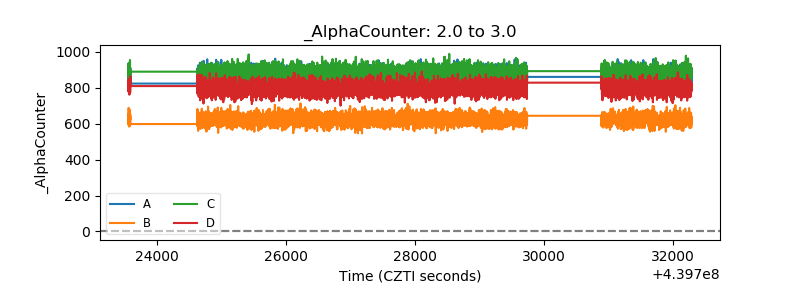 |
| _CPM_Rate | 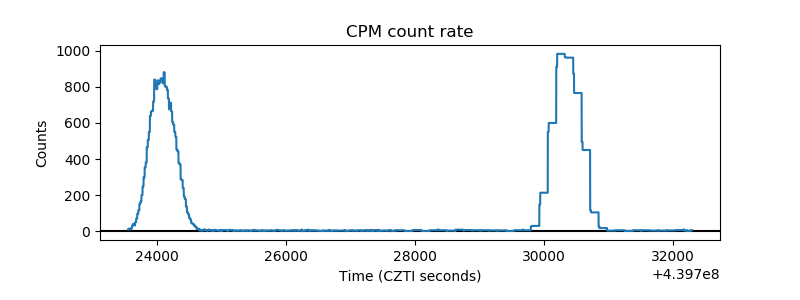 |
| CZT Counter | 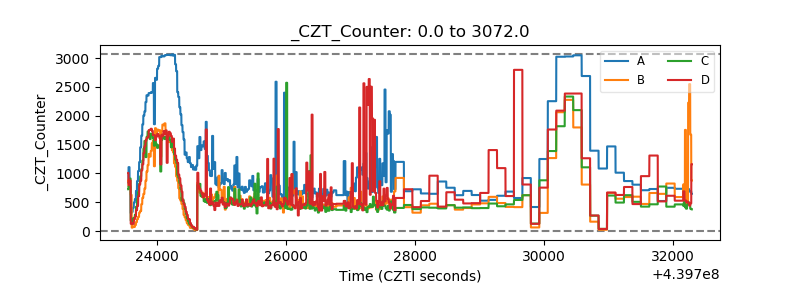 |
| +2.5 Volts monitor | 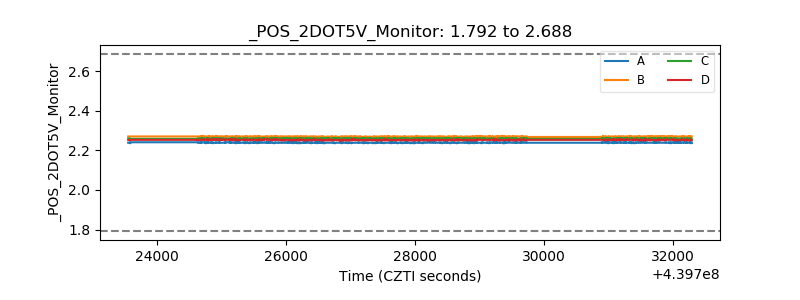 |
| +5 Volts monitor | 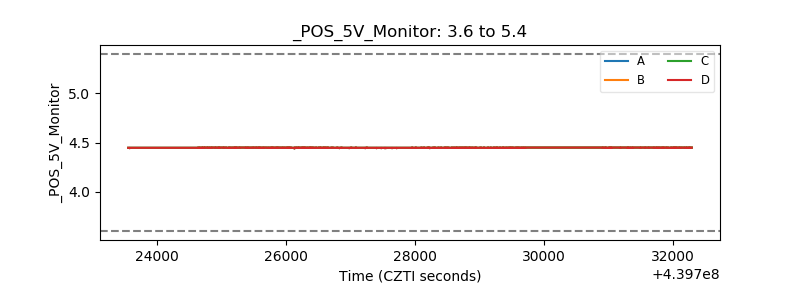 |
| _ROLL_ROT | 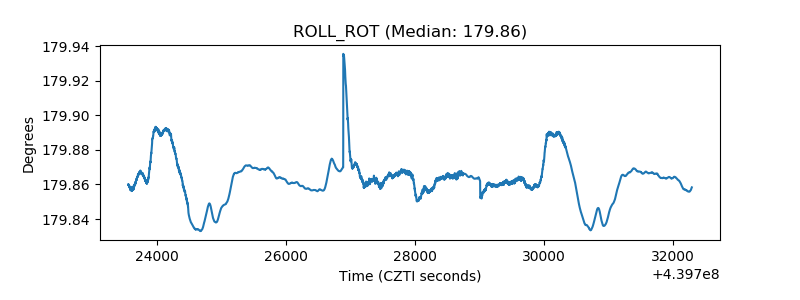 |
| _Roll_DEC | 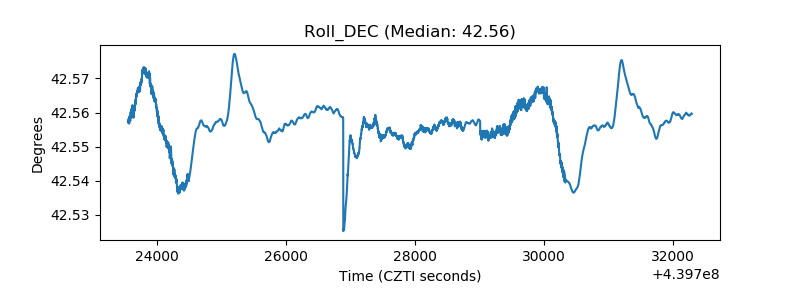 |
| _Roll_RA | 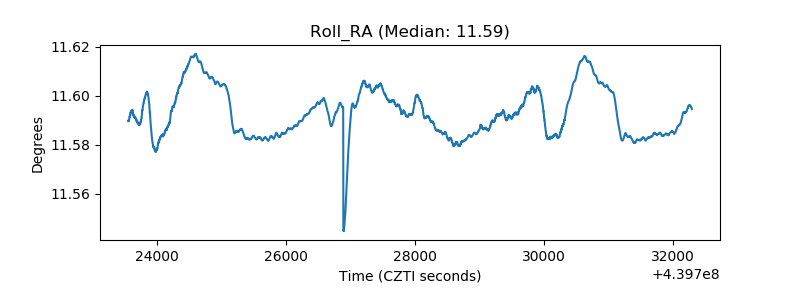 |
| Veto Counter | 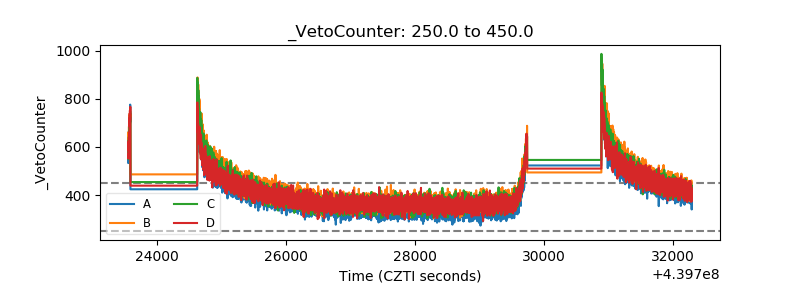 |