| Param | Original file | Final file |
|---|---|---|
| Filename | modeM0/AS1A13_004T13_9000005988_44314cztM0_level2.fits | modeM0/AS1A13_004T13_9000005988_44314cztM0_level2_quad_clean.evt |
| Size (bytes) | 512,686,080 | 113,685,120 |
| Size | 488.9 MB | 108.4 MB |
| Events in quadrant A | 5,075,746 | 784,682 |
| Events in quadrant B | 3,864,902 | 798,373 |
| Events in quadrant C | 3,165,128 | 769,670 |
| Events in quadrant D | 6,364,435 | 633,818 |
| Mode M0 | |||
|---|---|---|---|
| Quadrant | BADHDUFLAG | Total packets | Discarded packets |
| A | 0 | 20585 | 2 |
| B | 0 | 15768 | 2 |
| C | 0 | 13830 | 2 |
| D | 0 | 23237 | 2 |
| Mode SS | |||
|---|---|---|---|
| Quadrant | BADHDUFLAG | Total packets | Discarded packets |
| A | 0 | 132 | 0 |
| B | 0 | 132 | 0 |
| C | 0 | 132 | 0 |
| D | 0 | 132 | 0 |
| Mode M9 | |||
|---|---|---|---|
| Quadrant | BADHDUFLAG | Total packets | Discarded packets |
| A | 0 | 17 | 0 |
| B | 0 | 18 | 0 |
| C | 0 | 18 | 0 |
| D | 0 | 18 | 0 |
| Quadrant | Total seconds | Saturated seconds | Saturation percentage |
|---|---|---|---|
| A | 6538 | 289 | 4.420312% |
| B | 6538 | 319 | 4.879168% |
| C | 6538 | 123 | 1.881309% |
| D | 6538 | 1000 | 15.295197% |
Noise dominated data is calculated using 1-second bins in cleaned event files. If a bin has >2000 counts, and if more than 50% of those come from <1% of pixels, then it is considered to be noise-dominated and hence unusable.
| Quadrant | # 1 sec bins | Bins with >0 counts | Bins with >2000 counts | High rate bins dominated by noise | Noise dominated (total time) | Noise dominated (detector-on time) | Marked lightcurve |
|---|---|---|---|---|---|---|---|
| A | 7653 | 6538 | 10 | 10 | 0.13% | 0.15% | 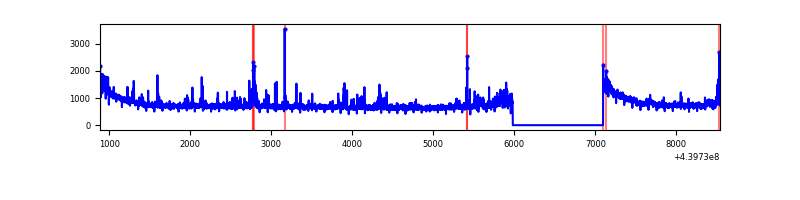 |
| B | 7653 | 6538 | 110 | 110 | 1.44% | 1.68% | 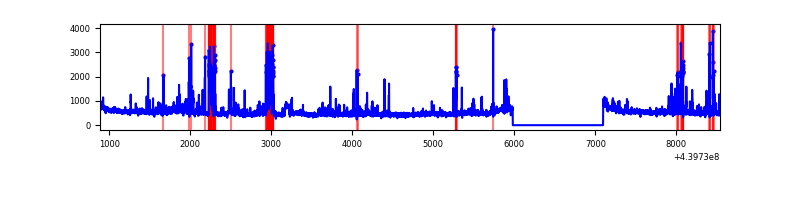 |
| C | 7653 | 6538 | 5 | 5 | 0.07% | 0.08% | 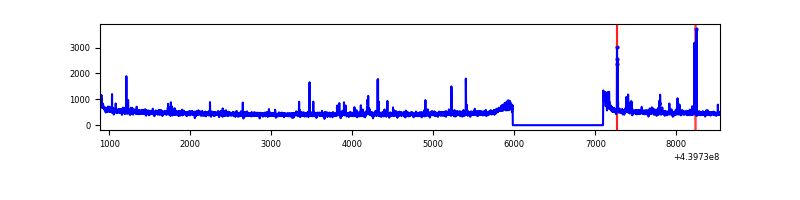 |
| D | 7653 | 6538 | 823 | 823 | 10.75% | 12.59% | 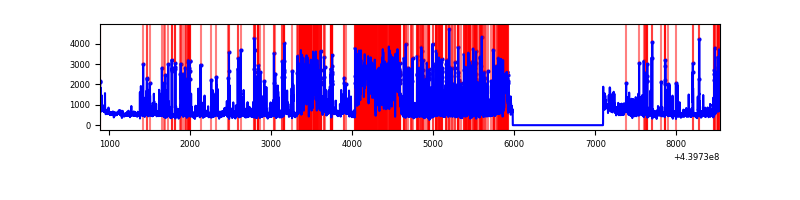 |
Top three noisy pixels from each quadrant. If the there are fewer than three noisy pixels in the level2.evt file, extra rows are filled as -1
| Pixel properties | Quadrant properties | ||||||
|---|---|---|---|---|---|---|---|
| Quadrant | DetID | PixID | Counts | Sigma | Mean | Median | Sigma |
| A | 10 | 83 | 1672195 | 10157.91 | 802 | 787 | 164.5 |
| A | 15 | 223 | 208109 | 1259.99 | 802 | 787 | 164.5 |
| A | 0 | 243 | 38503 | 229.22 | 802 | 787 | 164.5 |
| B | 5 | 172 | 318956 | 2068.43 | 786 | 761 | 153.8 |
| B | 4 | 158 | 114209 | 737.47 | 786 | 761 | 153.8 |
| B | 5 | 255 | 76579 | 492.85 | 786 | 761 | 153.8 |
| C | 14 | 254 | 100286 | 546.82 | 778 | 780 | 182.0 |
| C | 3 | 233 | 18699 | 98.47 | 778 | 780 | 182.0 |
| C | 1 | 3 | 8167 | 40.59 | 778 | 780 | 182.0 |
| D | 13 | 249 | 1876575 | 10182.64 | 741 | 717 | 184.2 |
| D | 5 | 222 | 923001 | 5006.39 | 741 | 717 | 184.2 |
| D | 2 | 153 | 140774 | 760.27 | 741 | 717 | 184.2 |
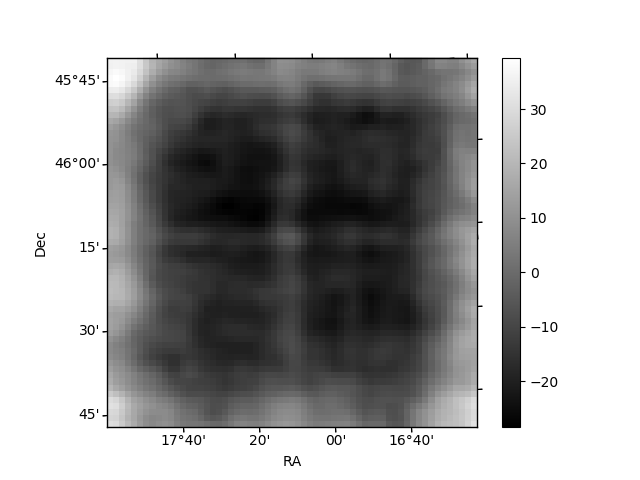
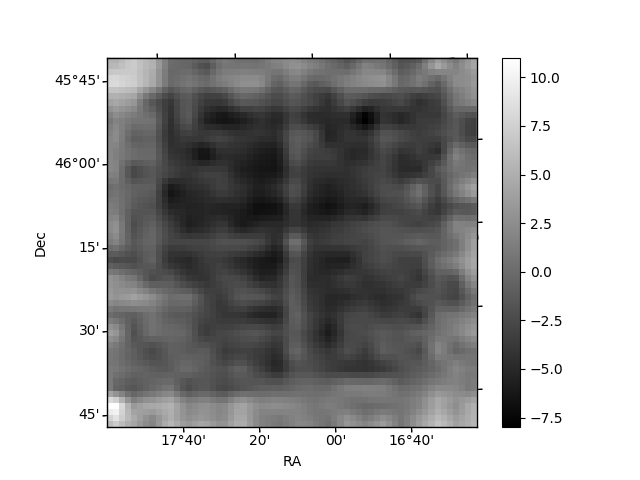
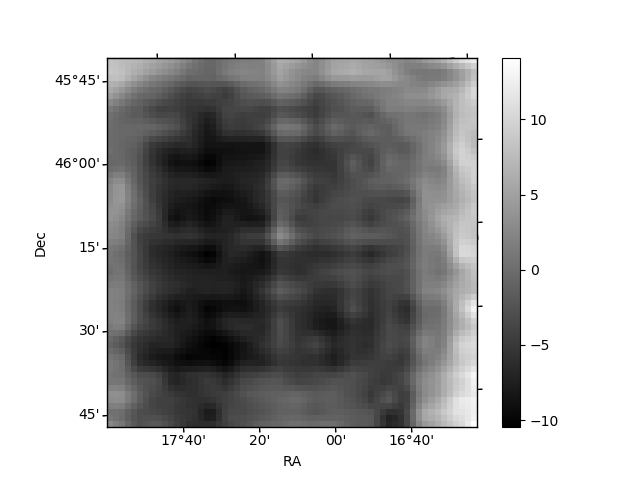
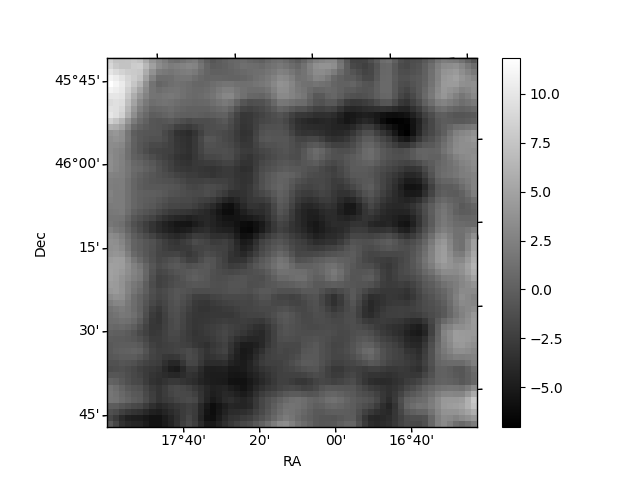
Histogram calculated using DETX and DETY for each event in the final _common_clean file
| Quadrant A | 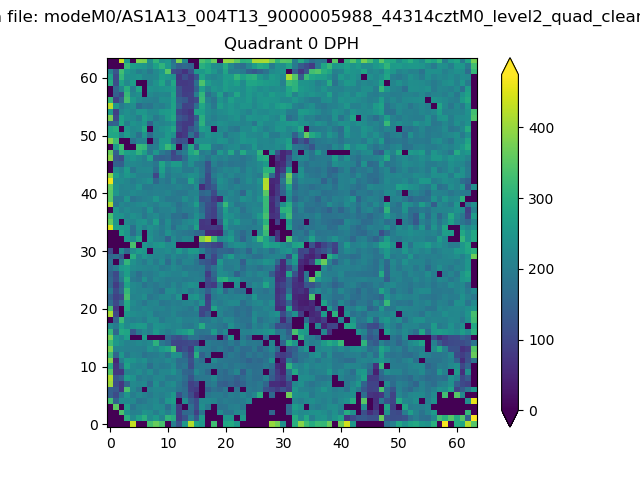 |
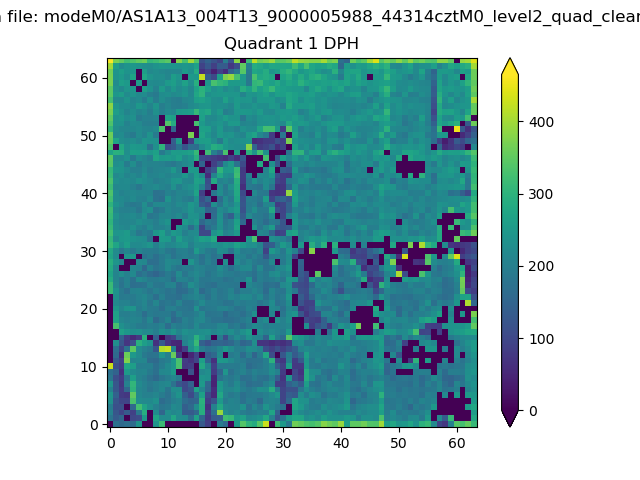 |
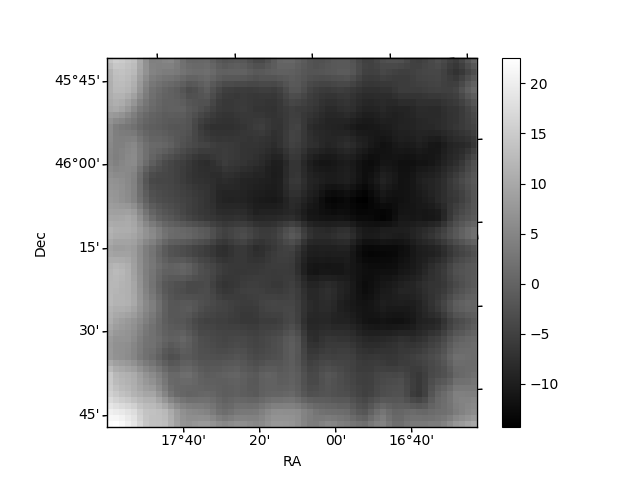
Quadrant B |
|---|---|---|---|
| Quadrant D | 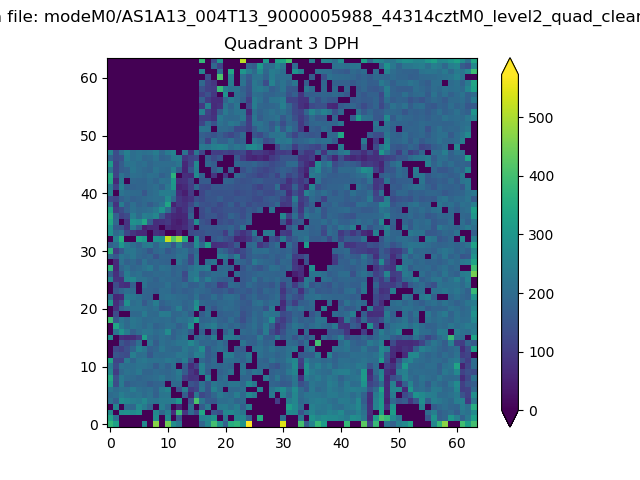 |
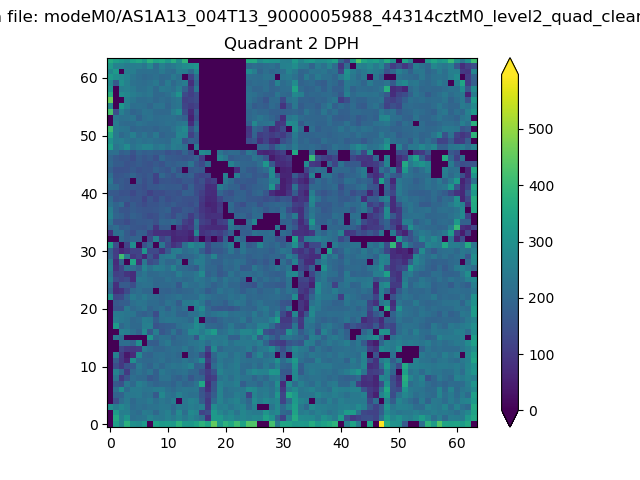 |
Quadrant C |
| Plot type | Count rate plots | Images |
|---|---|---|
| Comparison with Poisson distribution Blue bars denote a histogram of data divided into 1 sec bins. Red curve is a Poisson curve with rate = median count rate of data. |
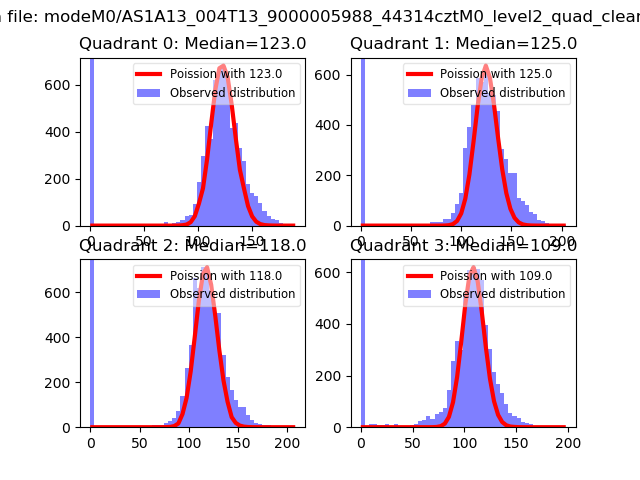 |
 |
| Quadrant-wise count rates Data is divided into 100 sec bins |
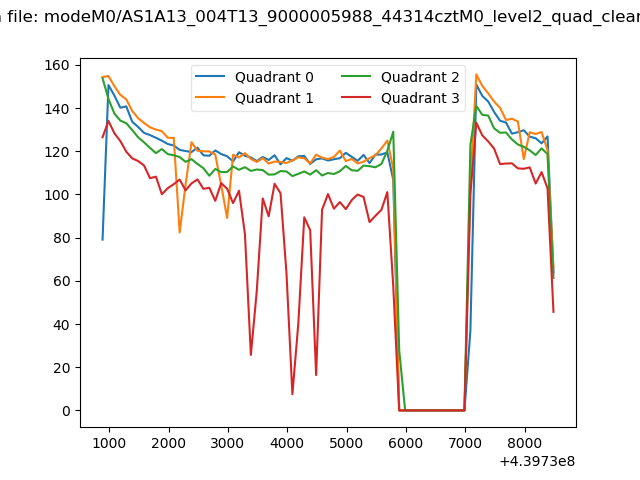 |
|
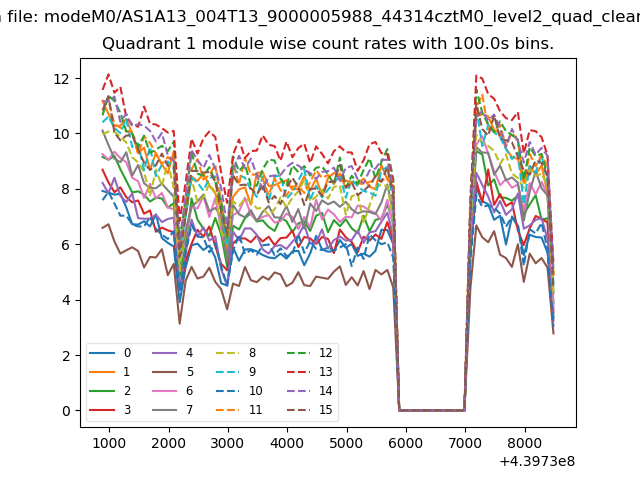
| Module-wise count rates for Quadrant A Data is divided into 100 sec bins |
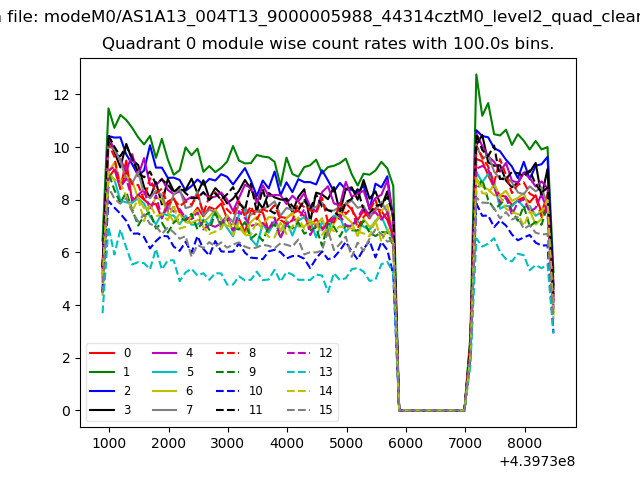 |
 |
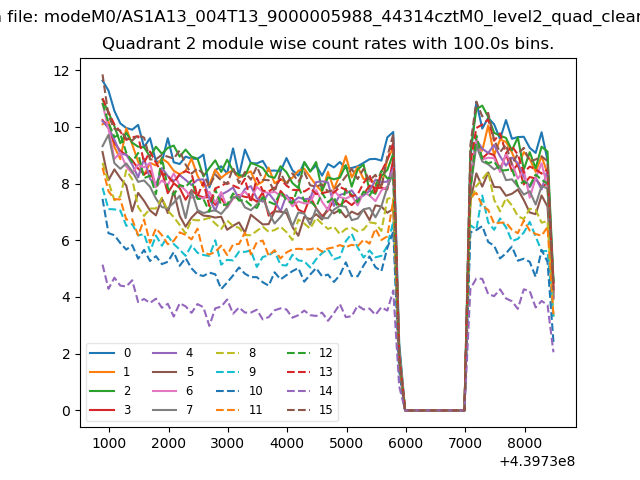
| Module-wise count rates for Quadrant B Data is divided into 100 sec bins |
 |
 |
| Module-wise count rates for Quadrant C Data is divided into 100 sec bins |
 |
 |
| Module-wise count rates for Quadrant D Data is divided into 100 sec bins |
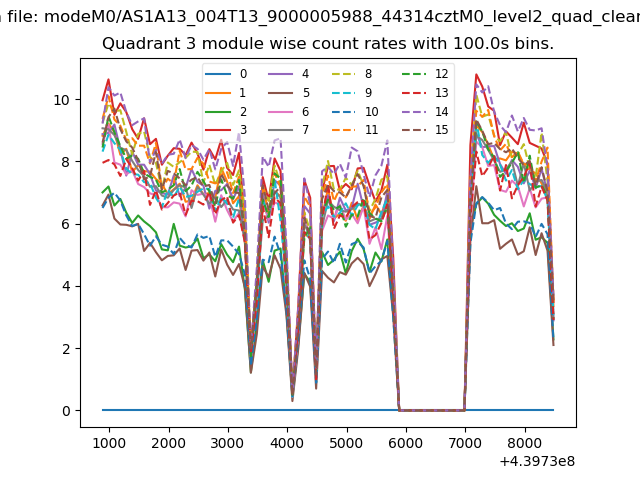 |
 |
| Parameter | Plot |
|---|---|
| CZT HV Monitor | 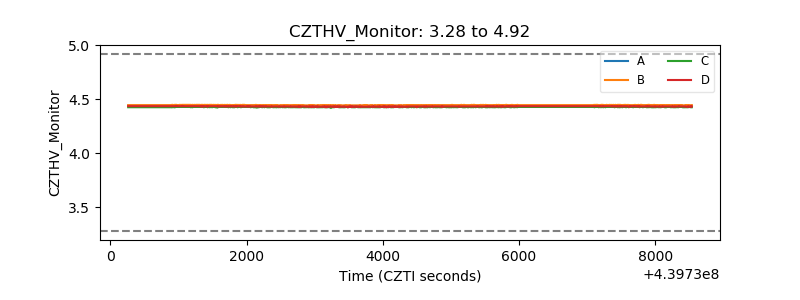 |
| D_VDD | 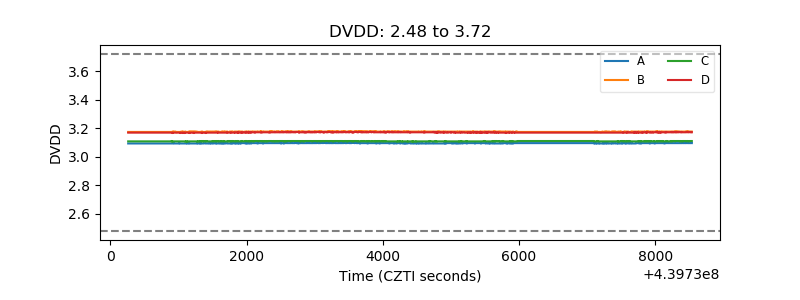 |
| Temperature 1 | 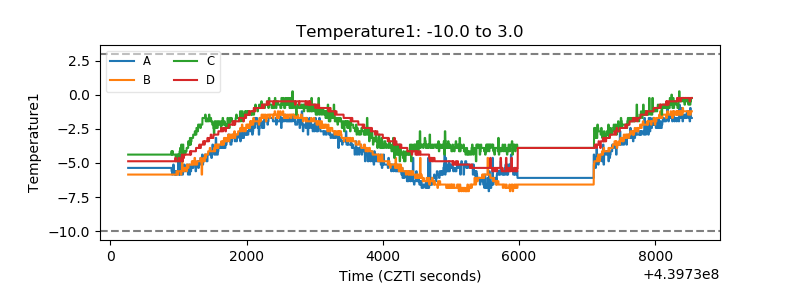 |
| Veto HV Monitor | 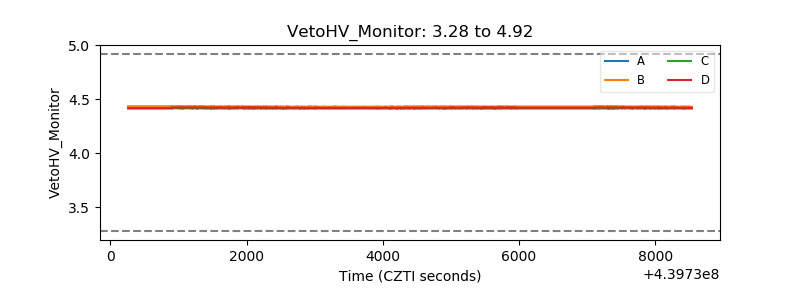 |
| Veto LLD | 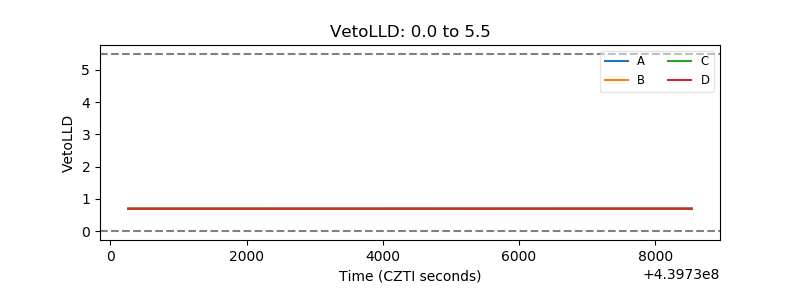 |
| Alpha Counter | 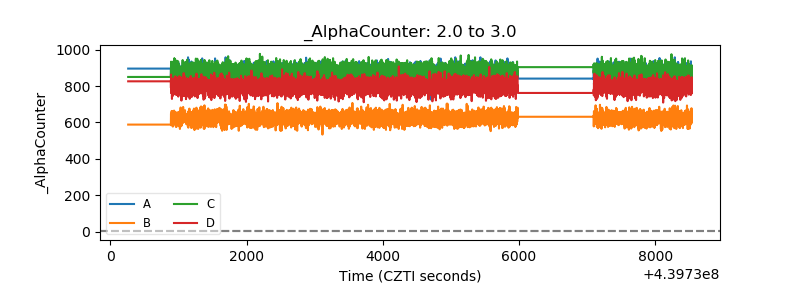 |
| _CPM_Rate | 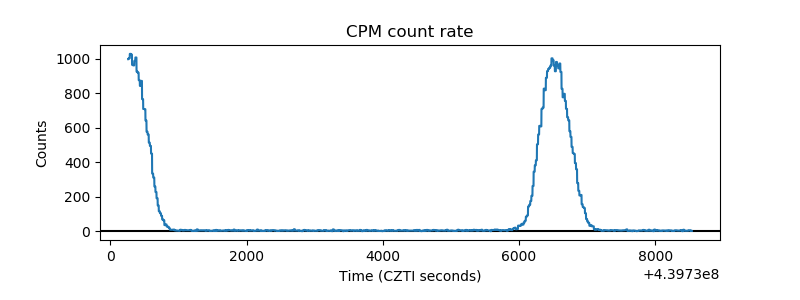 |
| CZT Counter | 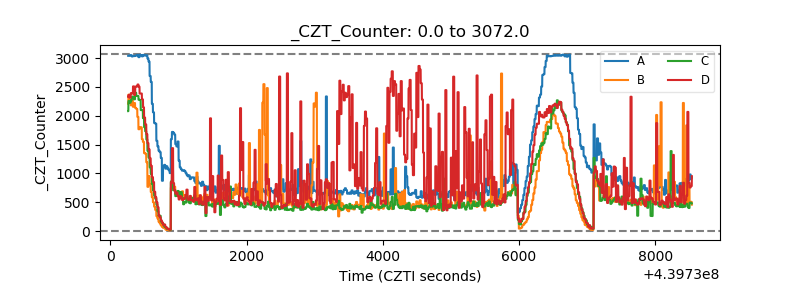 |
| +2.5 Volts monitor | 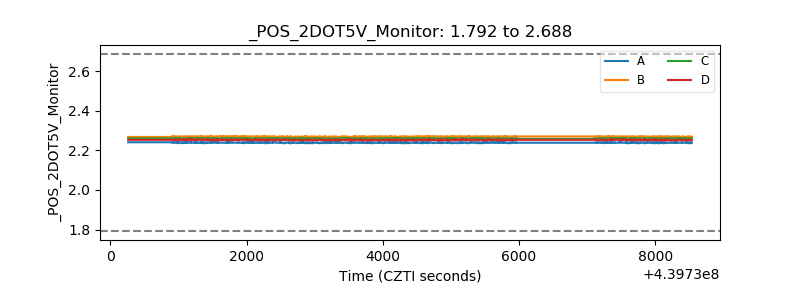 |
| +5 Volts monitor | 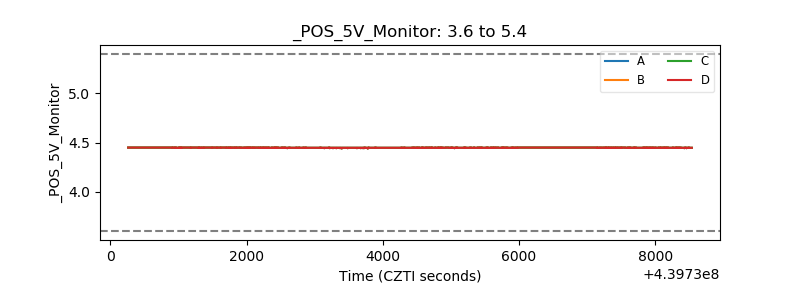 |
| _ROLL_ROT | 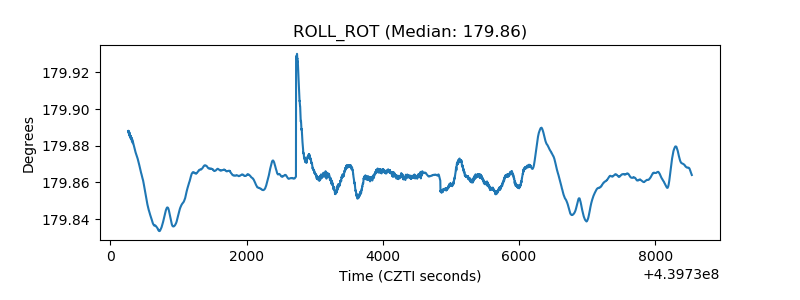 |
| _Roll_DEC | 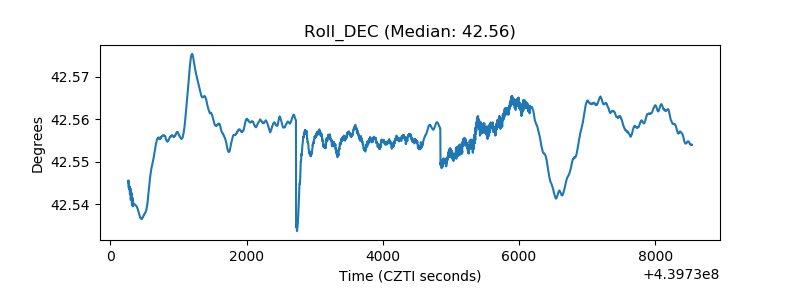 |
| _Roll_RA | 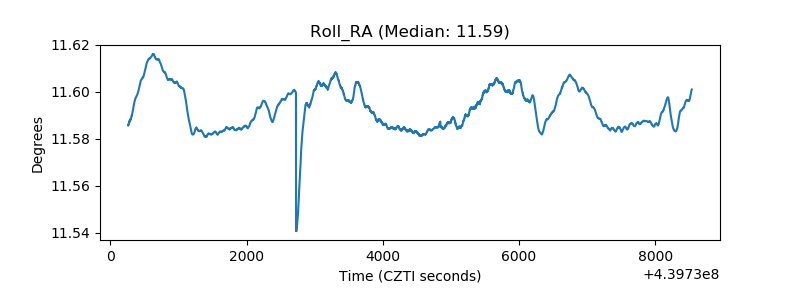 |
| Veto Counter | 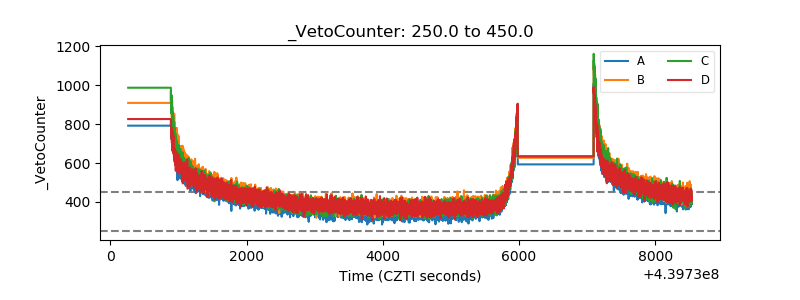 |