| Param | Original file | Final file |
|---|---|---|
| Filename | modeM0/AS1A13_004T13_9000005988_44315cztM0_level2.fits | modeM0/AS1A13_004T13_9000005988_44315cztM0_level2_quad_clean.evt |
| Size (bytes) | 200,491,200 | 48,764,160 |
| Size | 191.2 MB | 46.5 MB |
| Events in quadrant A | 2,376,803 | 330,624 |
| Events in quadrant B | 1,609,927 | 337,554 |
| Events in quadrant C | 1,316,714 | 321,875 |
| Events in quadrant D | 1,908,904 | 295,474 |
| Mode M0 | |||
|---|---|---|---|
| Quadrant | BADHDUFLAG | Total packets | Discarded packets |
| A | 0 | 9046 | 1 |
| B | 0 | 6494 | 1 |
| C | 0 | 5704 | 1 |
| D | 0 | 7440 | 1 |
| Mode SS | |||
|---|---|---|---|
| Quadrant | BADHDUFLAG | Total packets | Discarded packets |
| A | 0 | 54 | 0 |
| B | 0 | 54 | 0 |
| C | 0 | 54 | 0 |
| D | 0 | 54 | 0 |
| Quadrant | Total seconds | Saturated seconds | Saturation percentage |
|---|---|---|---|
| A | 2668 | 97 | 3.635682% |
| B | 2668 | 87 | 3.260870% |
| C | 2669 | 33 | 1.236418% |
| D | 2669 | 104 | 3.896590% |
Noise dominated data is calculated using 1-second bins in cleaned event files. If a bin has >2000 counts, and if more than 50% of those come from <1% of pixels, then it is considered to be noise-dominated and hence unusable.
| Quadrant | # 1 sec bins | Bins with >0 counts | Bins with >2000 counts | High rate bins dominated by noise | Noise dominated (total time) | Noise dominated (detector-on time) | Marked lightcurve |
|---|---|---|---|---|---|---|---|
| A | 2668 | 2668 | 10 | 10 | 0.37% | 0.37% | 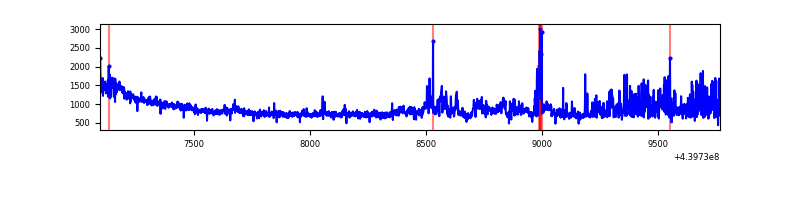 |
| B | 2668 | 2668 | 34 | 34 | 1.27% | 1.27% | 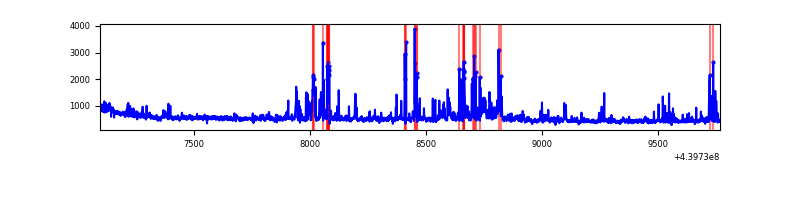 |
| C | 2669 | 2669 | 9 | 9 | 0.34% | 0.34% | 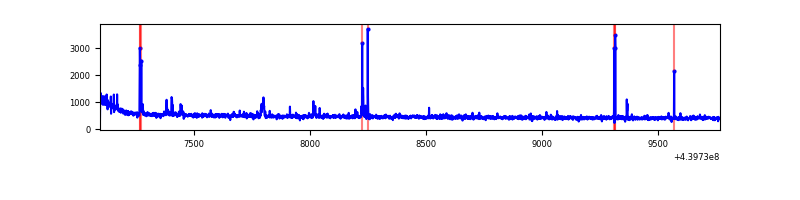 |
| D | 2669 | 2669 | 68 | 68 | 2.55% | 2.55% | 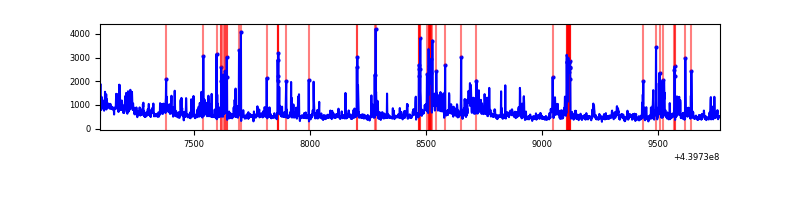 |
Top three noisy pixels from each quadrant. If the there are fewer than three noisy pixels in the level2.evt file, extra rows are filled as -1
| Pixel properties | Quadrant properties | ||||||
|---|---|---|---|---|---|---|---|
| Quadrant | DetID | PixID | Counts | Sigma | Mean | Median | Sigma |
| A | 10 | 83 | 755284 | 10873.99 | 329 | 322 | 69.4 |
| A | 15 | 223 | 322799 | 4644.75 | 329 | 322 | 69.4 |
| A | 0 | 243 | 19466 | 275.74 | 329 | 322 | 69.4 |
| B | 5 | 172 | 175590 | 2707.88 | 323 | 314 | 64.7 |
| B | 4 | 158 | 52119 | 800.35 | 323 | 314 | 64.7 |
| B | 5 | 255 | 21420 | 326.07 | 323 | 314 | 64.7 |
| C | 14 | 254 | 65760 | 867.88 | 316 | 317 | 75.4 |
| C | 3 | 233 | 8413 | 107.37 | 316 | 317 | 75.4 |
| C | 1 | 3 | 3254 | 38.95 | 316 | 317 | 75.4 |
| D | 5 | 171 | 183103 | 2255.43 | 322 | 313 | 81.0 |
| D | 13 | 249 | 170186 | 2096.04 | 322 | 313 | 81.0 |
| D | 5 | 222 | 117067 | 1440.62 | 322 | 313 | 81.0 |
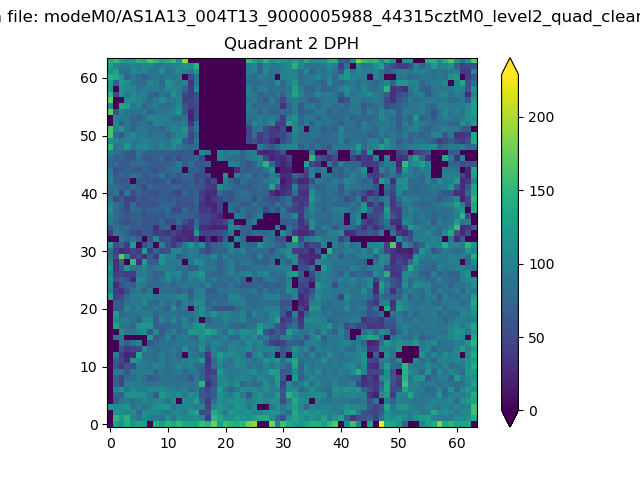
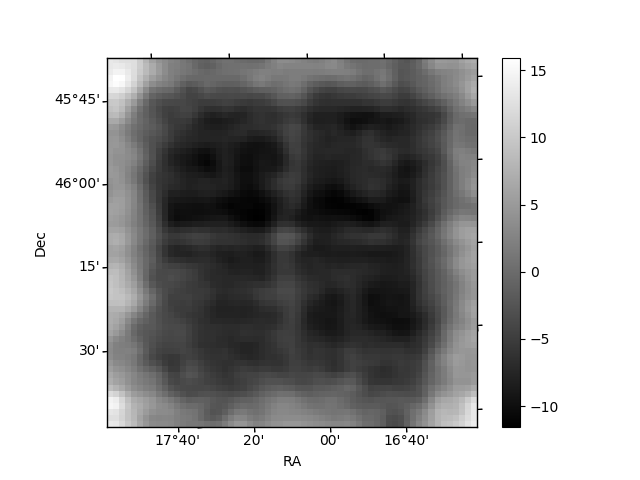
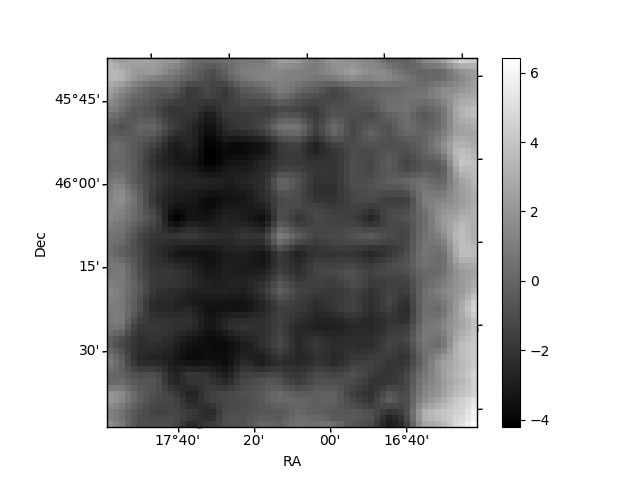
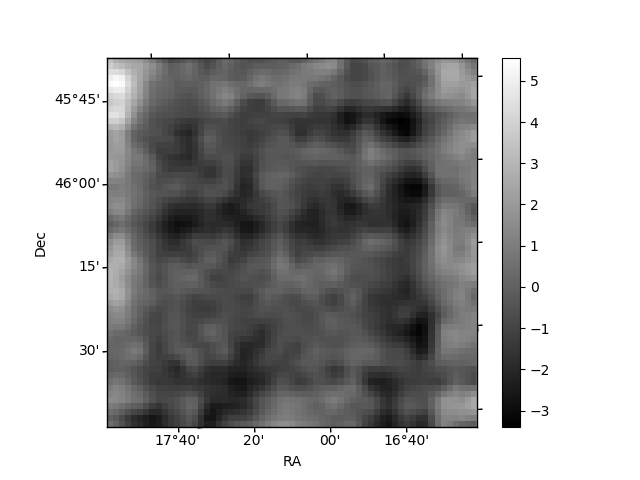
Histogram calculated using DETX and DETY for each event in the final _common_clean file
| Quadrant A | 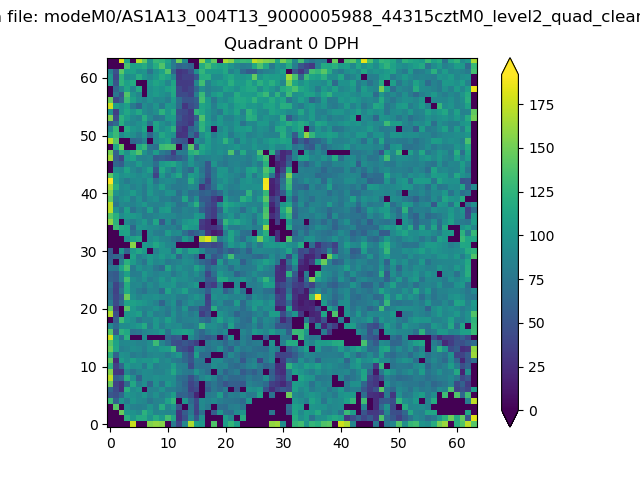 |
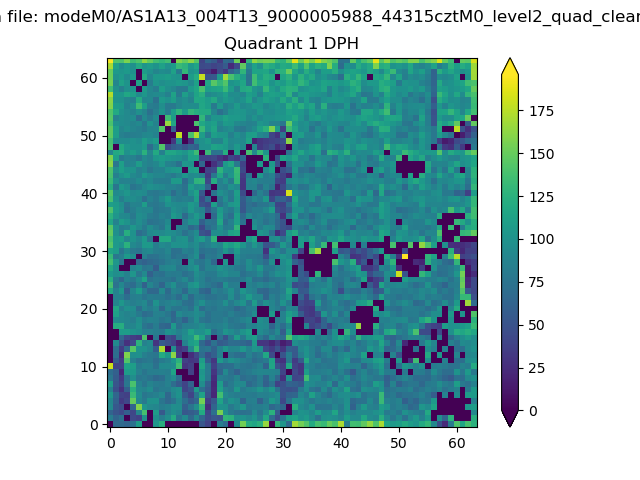 |
Quadrant B |
|---|---|---|---|
| Quadrant D | 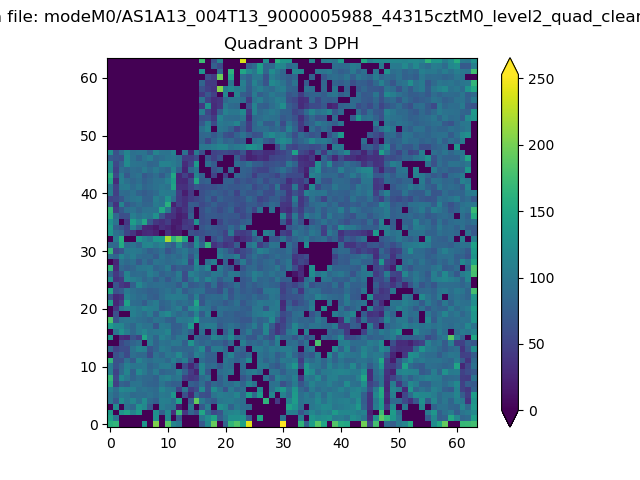 |
 |
Quadrant C |
| Plot type | Count rate plots | Images |
|---|---|---|
| Comparison with Poisson distribution Blue bars denote a histogram of data divided into 1 sec bins. Red curve is a Poisson curve with rate = median count rate of data. |
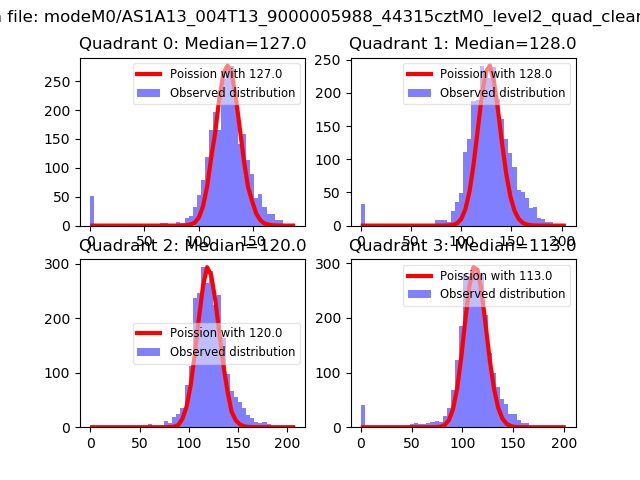 |
 |
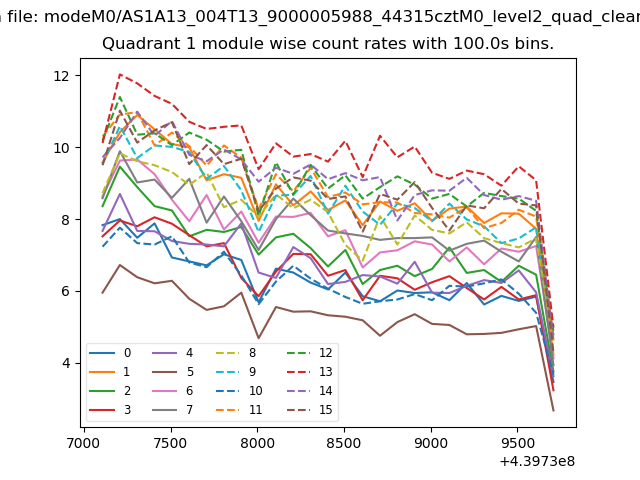
| Quadrant-wise count rates Data is divided into 100 sec bins |
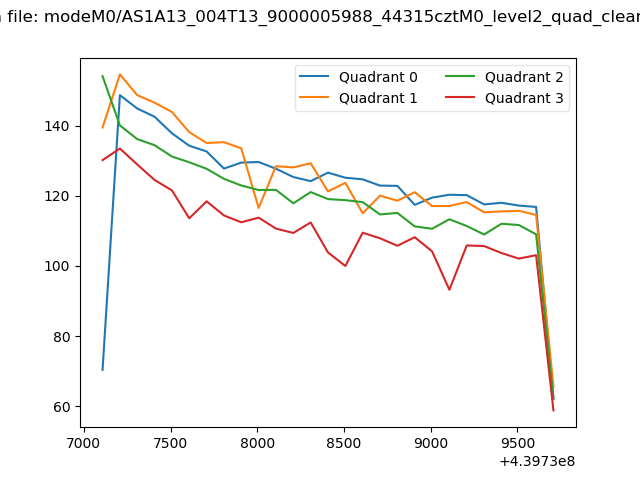 |
|
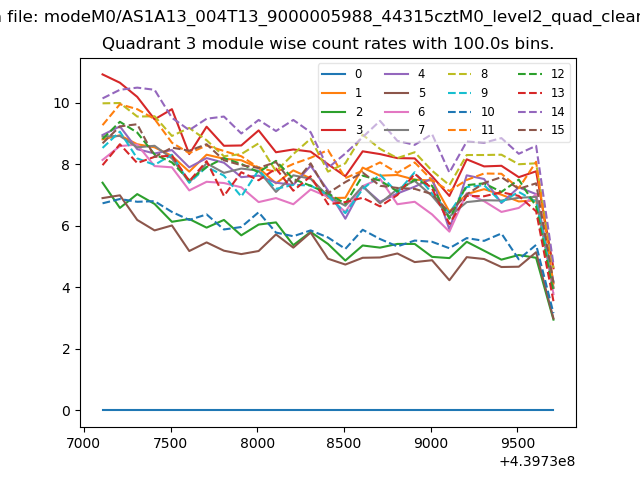
| Module-wise count rates for Quadrant A Data is divided into 100 sec bins |
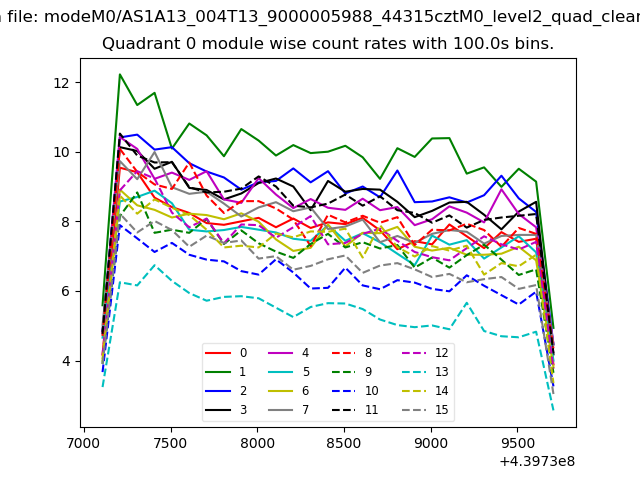 |
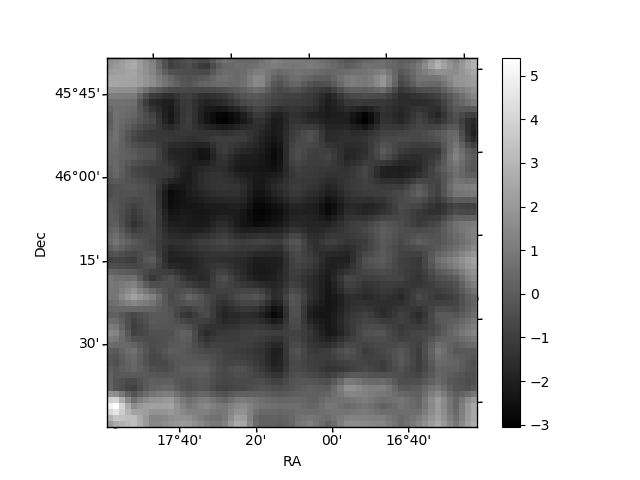 |
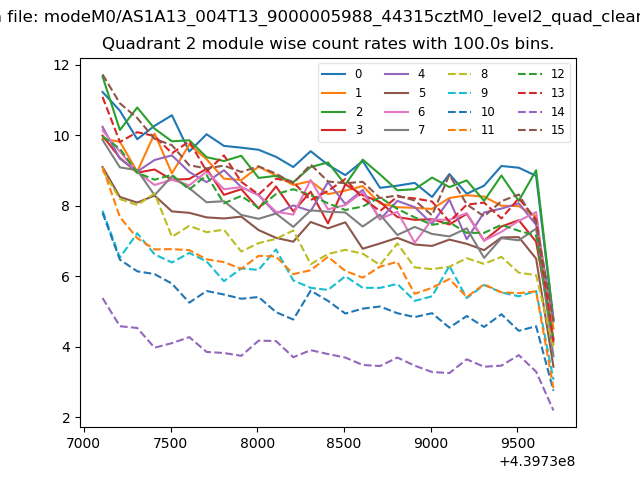
| Module-wise count rates for Quadrant B Data is divided into 100 sec bins |
 |
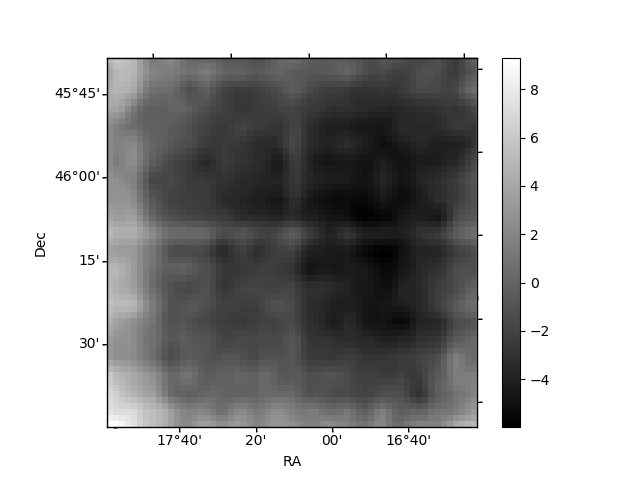 |
| Module-wise count rates for Quadrant C Data is divided into 100 sec bins |
 |
 |
| Module-wise count rates for Quadrant D Data is divided into 100 sec bins |
 |
 |
| Parameter | Plot |
|---|---|
| CZT HV Monitor | 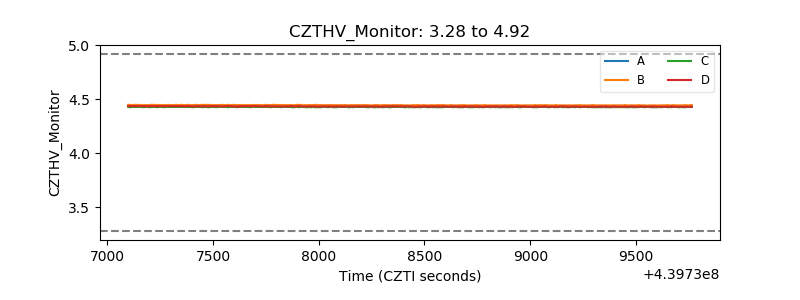 |
| D_VDD | 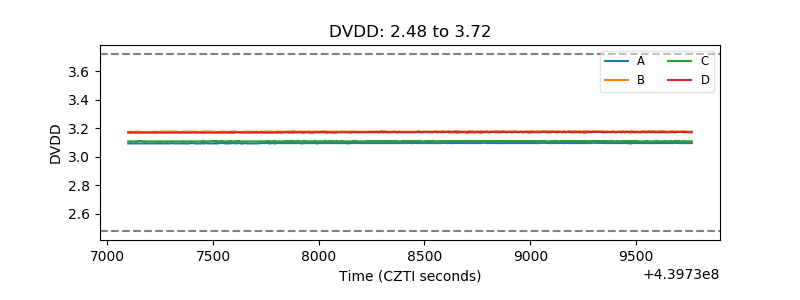 |
| Temperature 1 | 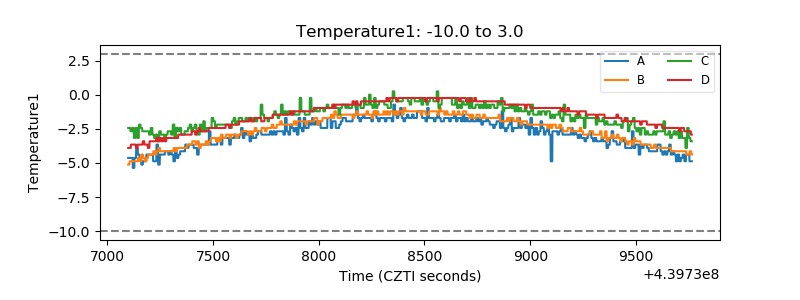 |
| Veto HV Monitor | 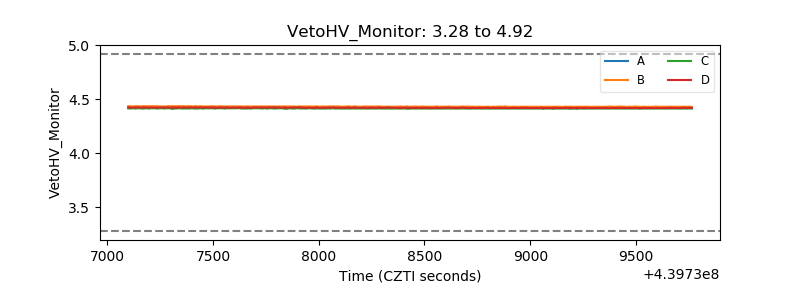 |
| Veto LLD | 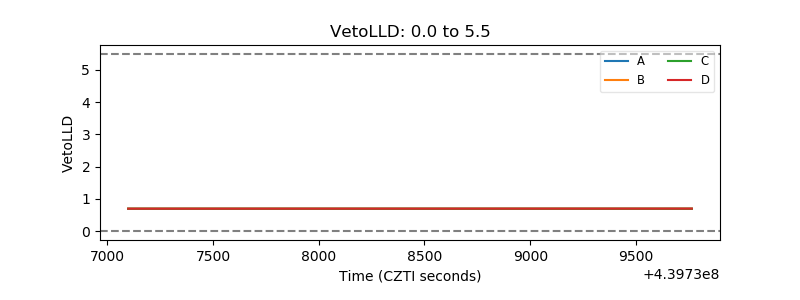 |
| Alpha Counter | 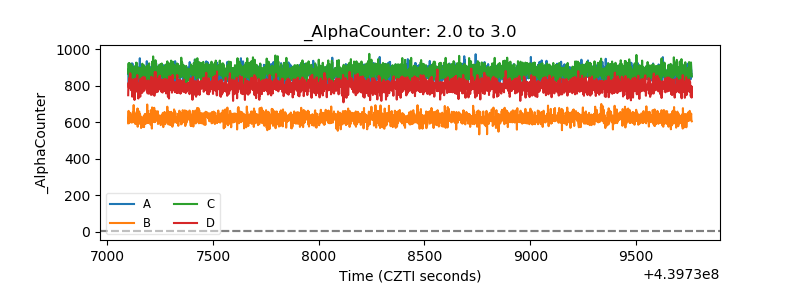 |
| _CPM_Rate | 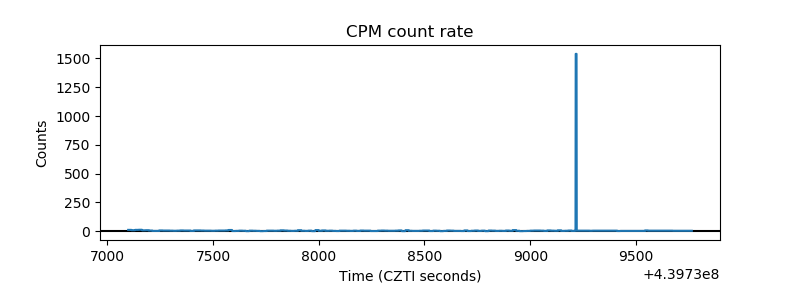 |
| CZT Counter | 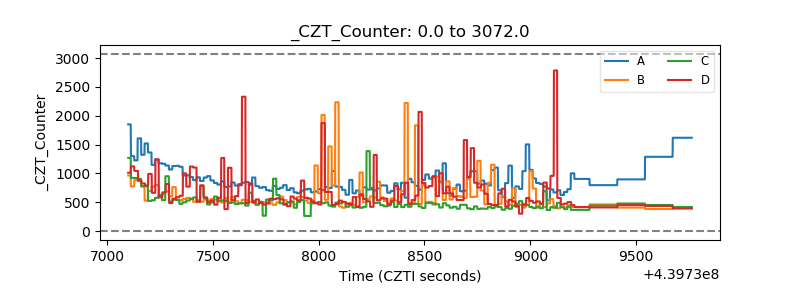 |
| +2.5 Volts monitor | 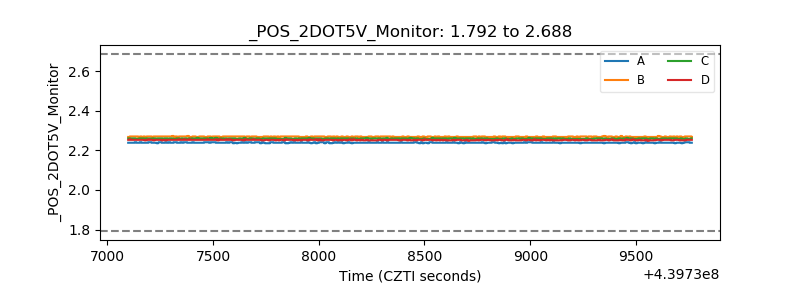 |
| +5 Volts monitor | 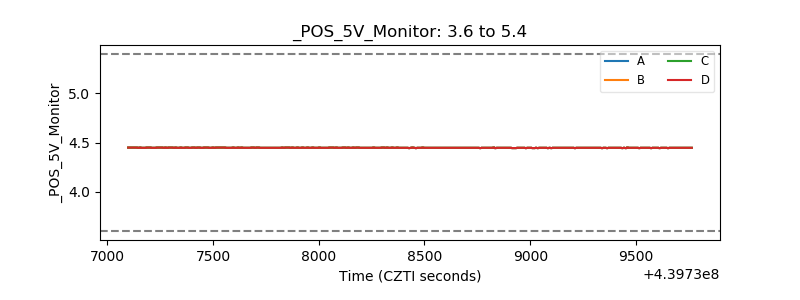 |
| _ROLL_ROT | 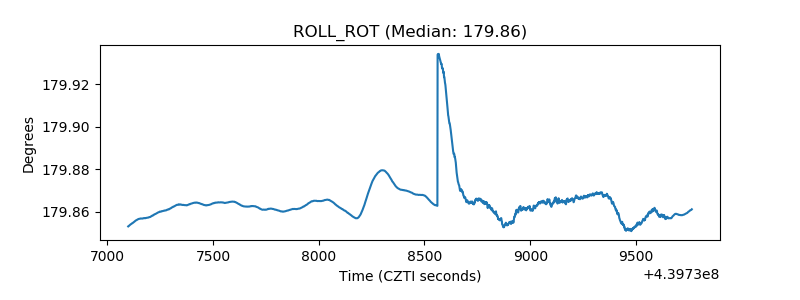 |
| _Roll_DEC | 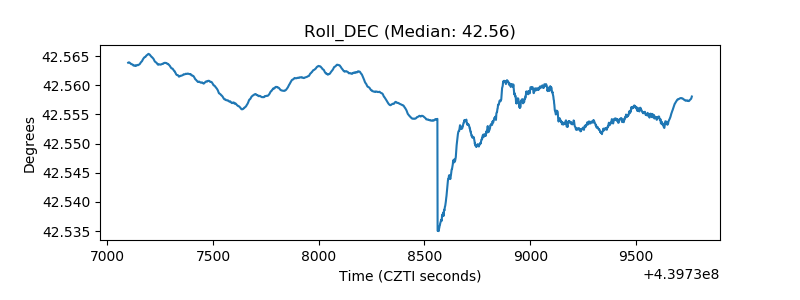 |
| _Roll_RA | 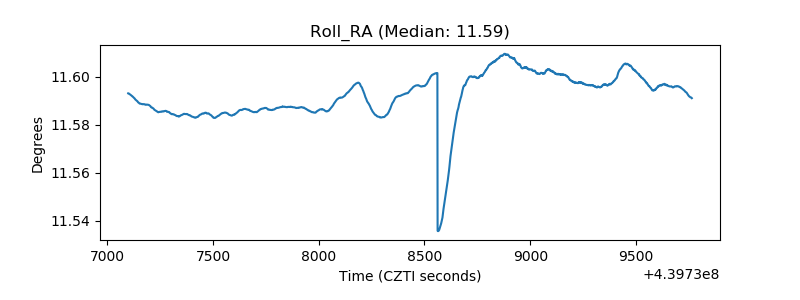 |
| Veto Counter | 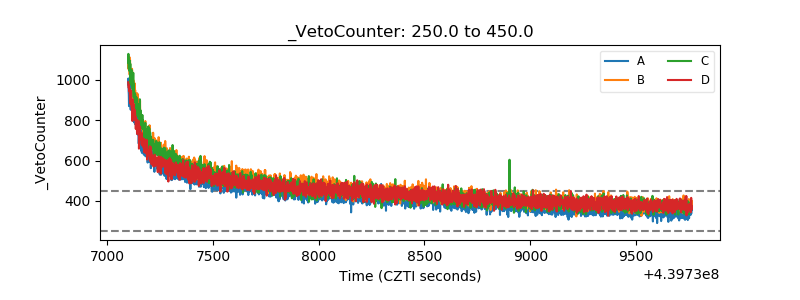 |