| Param | Original file | Final file |
|---|---|---|
| Filename | modeM0/AS1A13_059T01_9000005990_44316cztM0_level2.fits | modeM0/AS1A13_059T01_9000005990_44316cztM0_level2_quad_clean.evt |
| Size (bytes) | 526,138,560 | 111,916,800 |
| Size | 501.8 MB | 106.7 MB |
| Events in quadrant A | 4,985,193 | 773,328 |
| Events in quadrant B | 4,259,846 | 765,517 |
| Events in quadrant C | 3,223,709 | 765,955 |
| Events in quadrant D | 6,483,709 | 614,191 |
| Mode M0 | |||
|---|---|---|---|
| Quadrant | BADHDUFLAG | Total packets | Discarded packets |
| A | 0 | 20274 | 2 |
| B | 0 | 17187 | 2 |
| C | 0 | 14318 | 2 |
| D | 0 | 23771 | 2 |
| Mode SS | |||
|---|---|---|---|
| Quadrant | BADHDUFLAG | Total packets | Discarded packets |
| A | 0 | 136 | 0 |
| B | 0 | 136 | 0 |
| C | 0 | 136 | 0 |
| D | 0 | 136 | 0 |
| Mode M9 | |||
|---|---|---|---|
| Quadrant | BADHDUFLAG | Total packets | Discarded packets |
| A | 0 | 10 | 0 |
| B | 0 | 11 | 0 |
| C | 0 | 11 | 0 |
| D | 0 | 11 | 0 |
| Quadrant | Total seconds | Saturated seconds | Saturation percentage |
|---|---|---|---|
| A | 6741 | 263 | 3.901498% |
| B | 6741 | 453 | 6.720071% |
| C | 6741 | 103 | 1.527963% |
| D | 6741 | 1093 | 16.214212% |
Noise dominated data is calculated using 1-second bins in cleaned event files. If a bin has >2000 counts, and if more than 50% of those come from <1% of pixels, then it is considered to be noise-dominated and hence unusable.
| Quadrant | # 1 sec bins | Bins with >0 counts | Bins with >2000 counts | High rate bins dominated by noise | Noise dominated (total time) | Noise dominated (detector-on time) | Marked lightcurve |
|---|---|---|---|---|---|---|---|
| A | 7756 | 6741 | 3 | 3 | 0.04% | 0.04% | 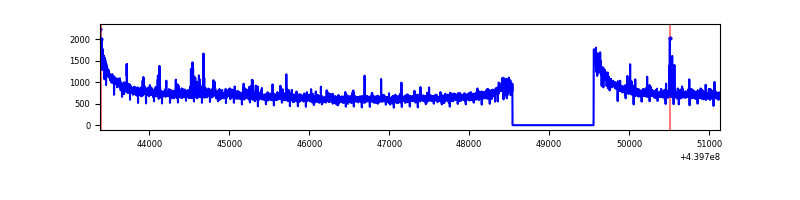 |
| B | 7756 | 6741 | 239 | 239 | 3.08% | 3.55% | 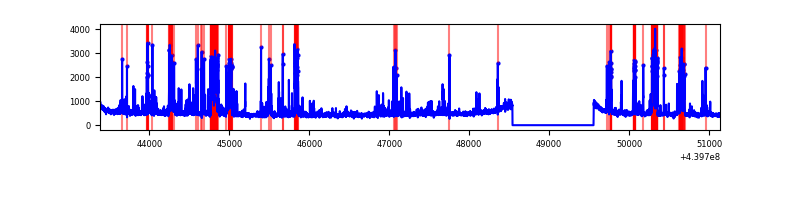 |
| C | 7756 | 6741 | 10 | 10 | 0.13% | 0.15% | 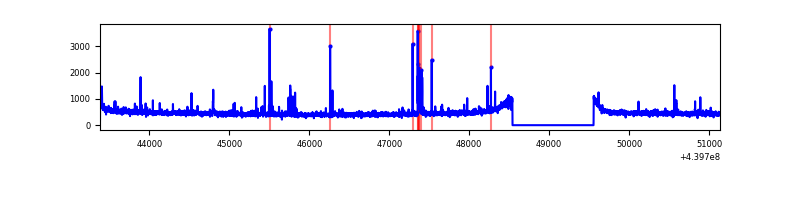 |
| D | 7756 | 6741 | 928 | 928 | 11.96% | 13.77% | 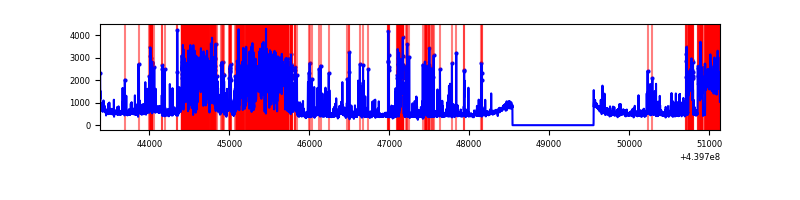 |
Top three noisy pixels from each quadrant. If the there are fewer than three noisy pixels in the level2.evt file, extra rows are filled as -1
| Pixel properties | Quadrant properties | ||||||
|---|---|---|---|---|---|---|---|
| Quadrant | DetID | PixID | Counts | Sigma | Mean | Median | Sigma |
| A | 10 | 83 | 1800151 | 10850.83 | 799 | 782 | 165.8 |
| A | 15 | 223 | 49122 | 291.51 | 799 | 782 | 165.8 |
| A | 0 | 243 | 33740 | 198.75 | 799 | 782 | 165.8 |
| B | 5 | 172 | 746708 | 4845.52 | 779 | 756 | 153.9 |
| B | 4 | 158 | 215852 | 1397.21 | 779 | 756 | 153.9 |
| B | 5 | 255 | 129006 | 833.08 | 779 | 756 | 153.9 |
| C | 14 | 254 | 132713 | 711.47 | 786 | 790 | 185.4 |
| C | 1 | 3 | 18456 | 95.27 | 786 | 790 | 185.4 |
| C | 3 | 233 | 7121 | 34.14 | 786 | 790 | 185.4 |
| D | 13 | 249 | 1713407 | 9188.92 | 748 | 726 | 186.4 |
| D | 13 | 153 | 616911 | 3305.97 | 748 | 726 | 186.4 |
| D | 1 | 20 | 432952 | 2318.99 | 748 | 726 | 186.4 |
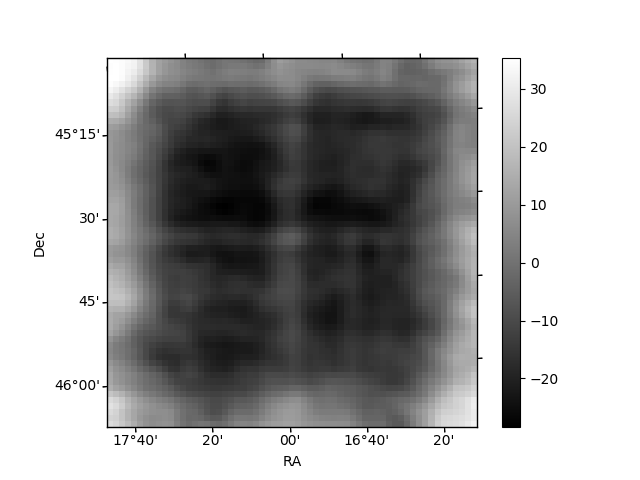
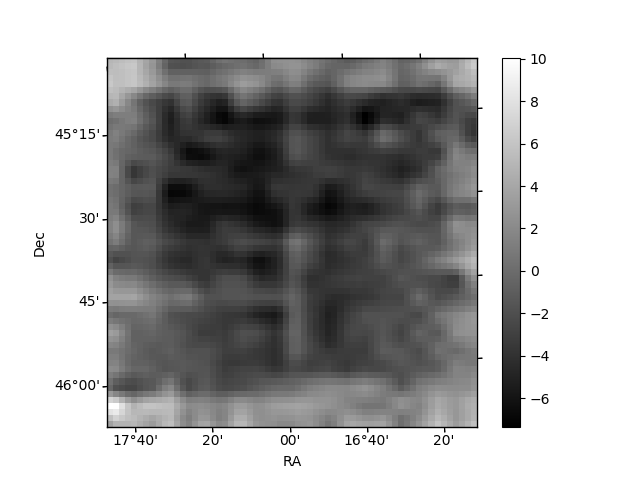
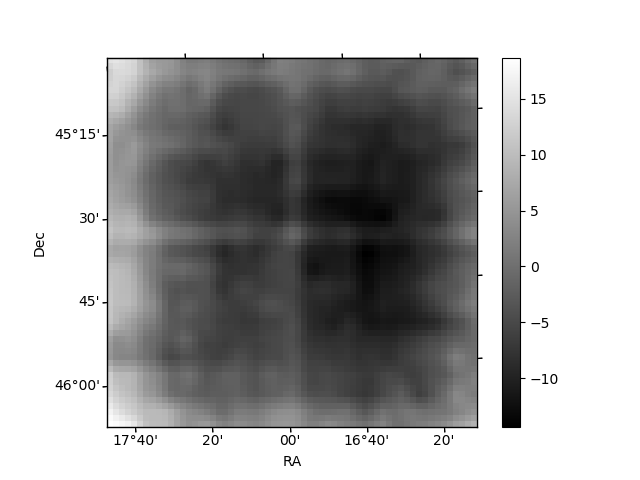
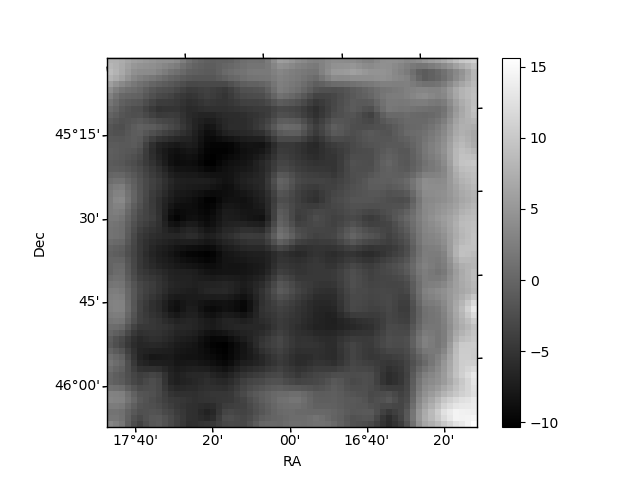
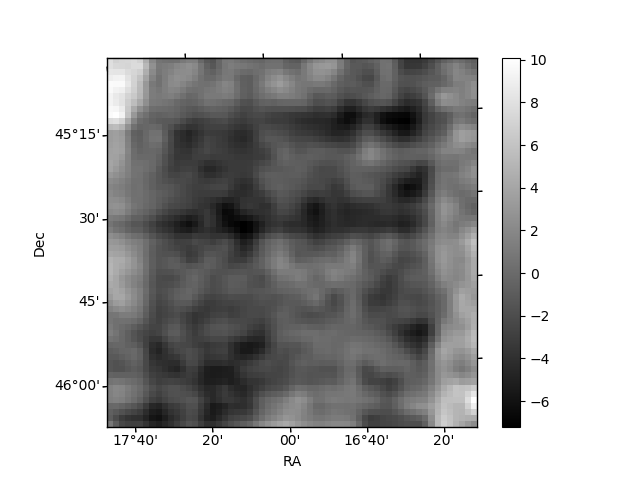
Histogram calculated using DETX and DETY for each event in the final _common_clean file
| Quadrant A | 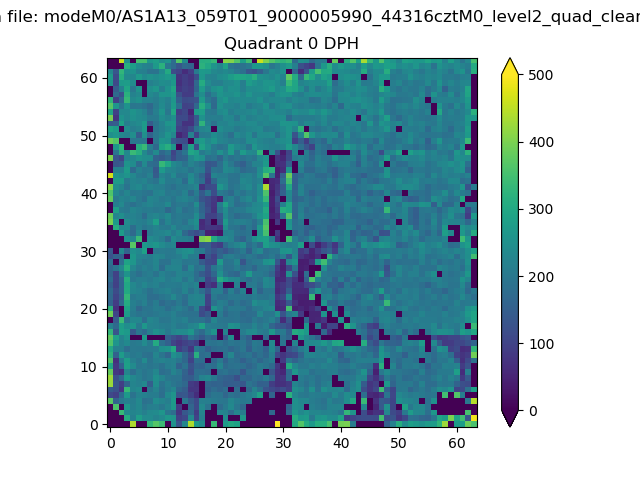 |
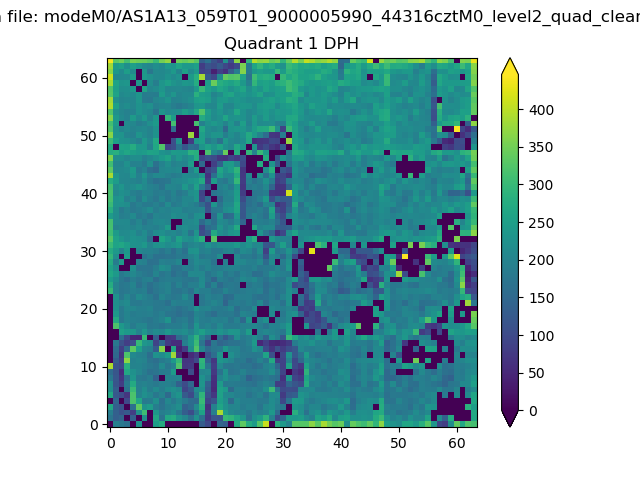 |
Quadrant B |
|---|---|---|---|
| Quadrant D | 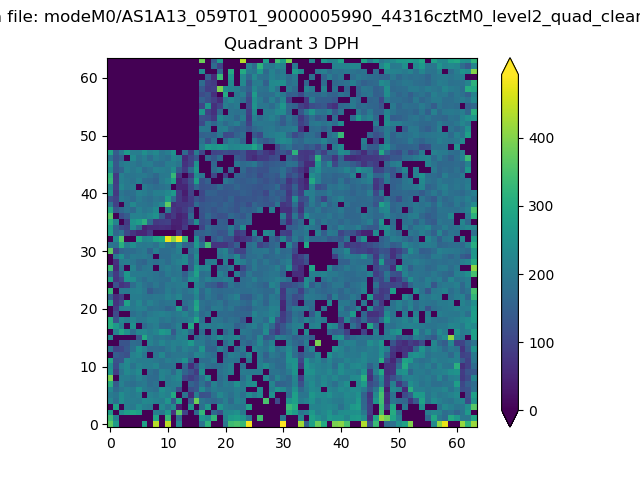 |
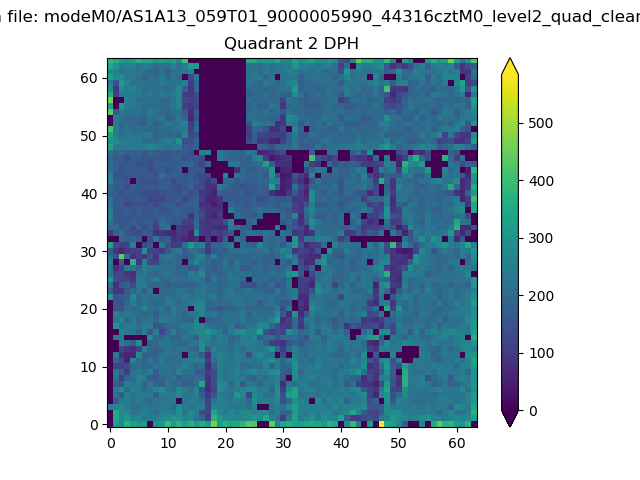 |
Quadrant C |
| Plot type | Count rate plots | Images |
|---|---|---|
| Comparison with Poisson distribution Blue bars denote a histogram of data divided into 1 sec bins. Red curve is a Poisson curve with rate = median count rate of data. |
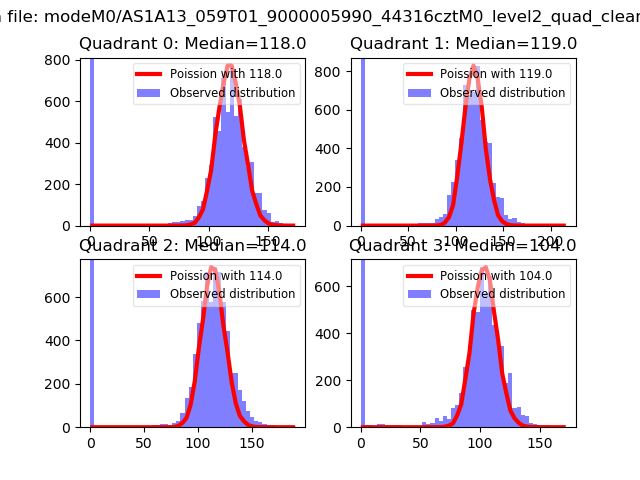 |
 |
| Quadrant-wise count rates Data is divided into 100 sec bins |
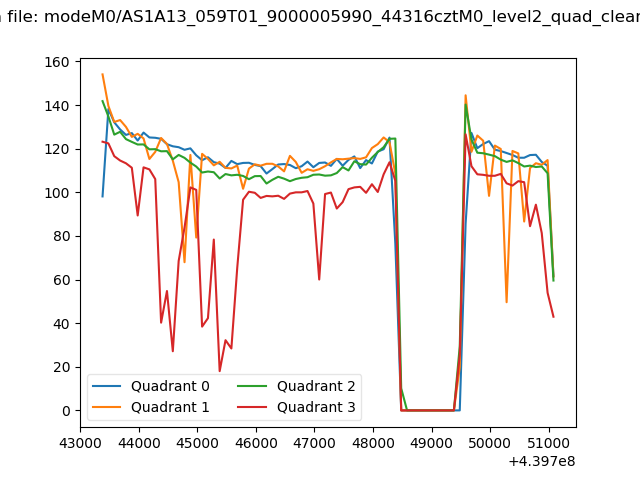 |
|
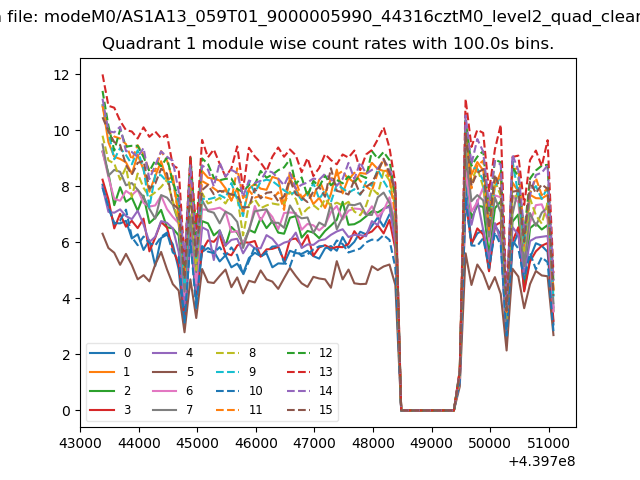
| Module-wise count rates for Quadrant A Data is divided into 100 sec bins |
 |
 |
| Module-wise count rates for Quadrant B Data is divided into 100 sec bins |
 |
 |
| Module-wise count rates for Quadrant C Data is divided into 100 sec bins |
 |
 |
| Module-wise count rates for Quadrant D Data is divided into 100 sec bins |
 |
 |
| Parameter | Plot |
|---|---|
| CZT HV Monitor | 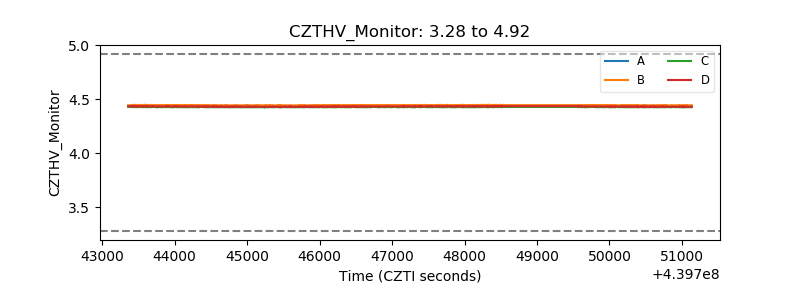 |
| D_VDD | 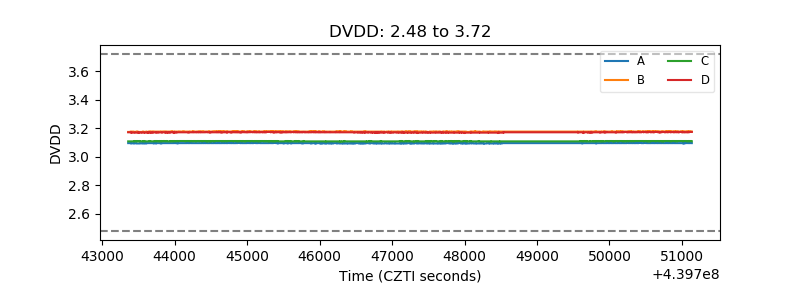 |
| Temperature 1 | 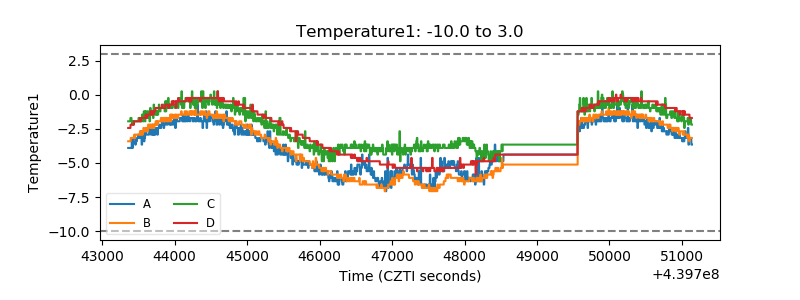 |
| Veto HV Monitor | 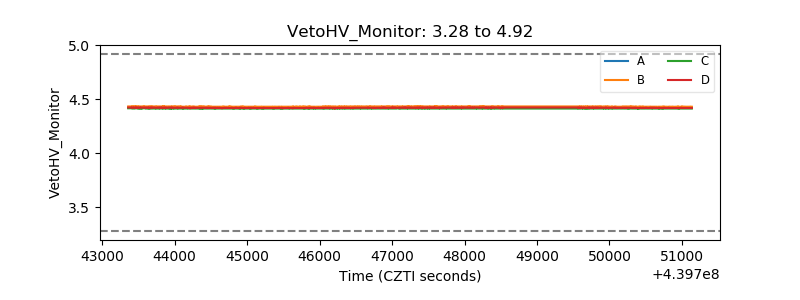 |
| Veto LLD | 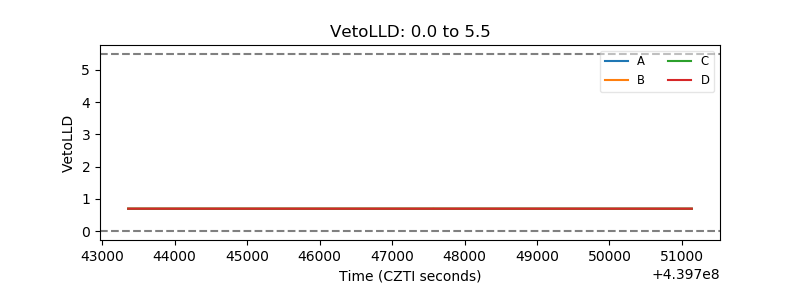 |
| Alpha Counter | 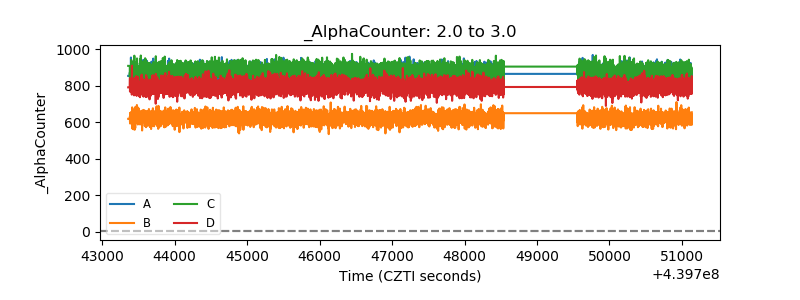 |
| _CPM_Rate | 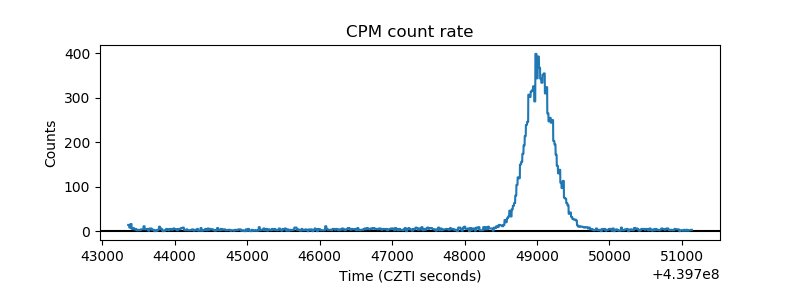 |
| CZT Counter | 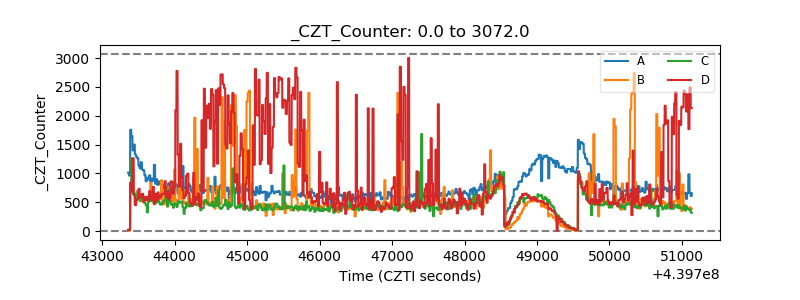 |
| +2.5 Volts monitor | 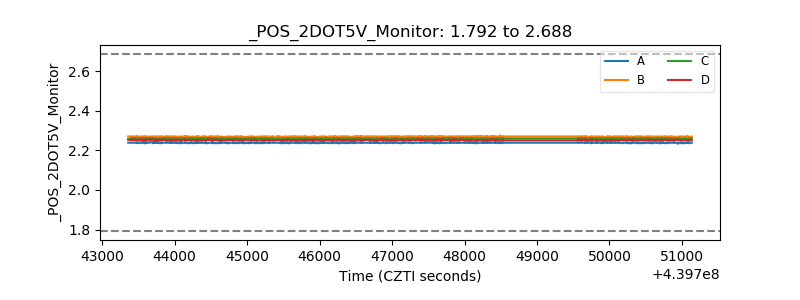 |
| +5 Volts monitor | 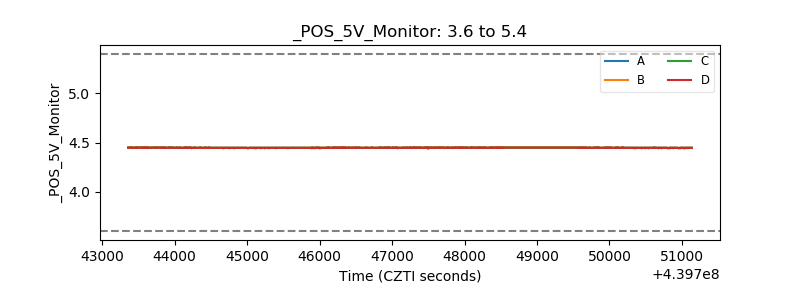 |
| _ROLL_ROT | 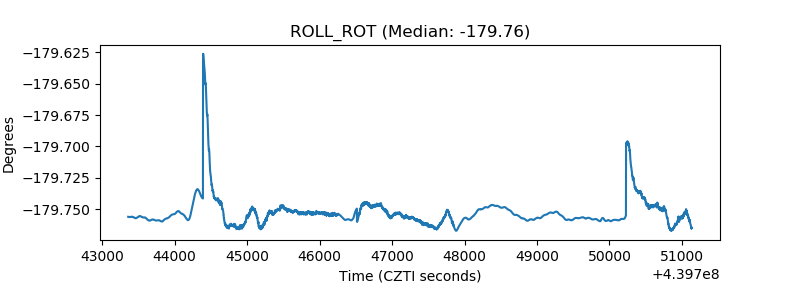 |
| _Roll_DEC | 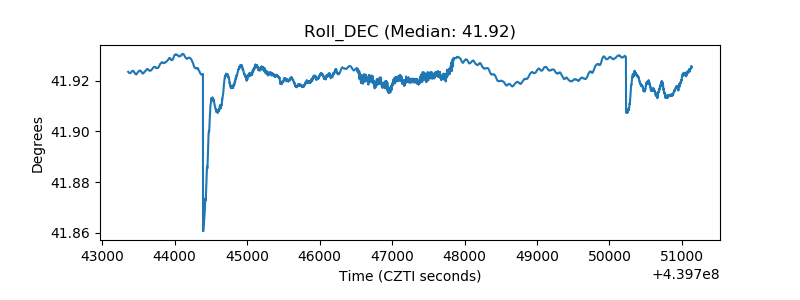 |
| _Roll_RA | 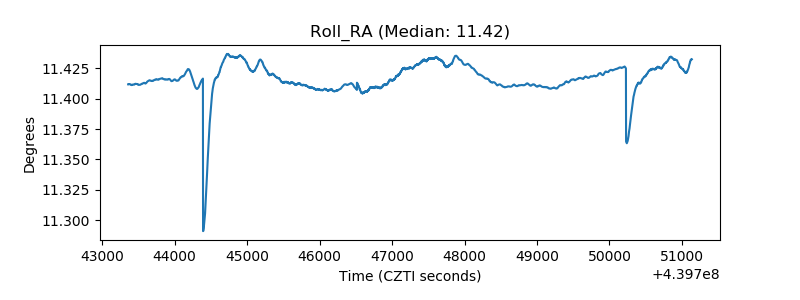 |
| Veto Counter | 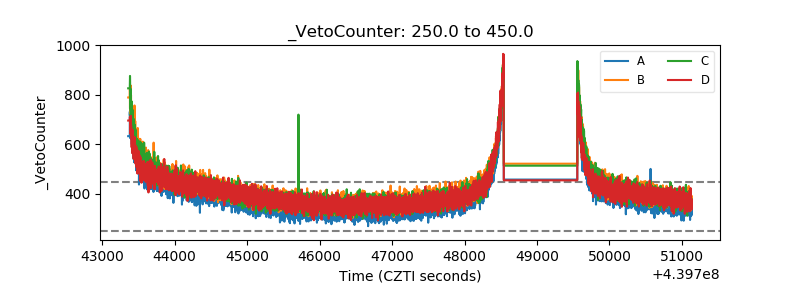 |