| Param | Original file | Final file |
|---|---|---|
| Filename | modeM0/AS1A13_059T01_9000005990_44317cztM0_level2.fits | modeM0/AS1A13_059T01_9000005990_44317cztM0_level2_quad_clean.evt |
| Size (bytes) | 525,162,240 | 113,088,960 |
| Size | 500.8 MB | 107.9 MB |
| Events in quadrant A | 5,060,411 | 770,685 |
| Events in quadrant B | 4,194,966 | 757,814 |
| Events in quadrant C | 3,269,415 | 763,606 |
| Events in quadrant D | 6,376,060 | 648,231 |
| Mode M0 | |||
|---|---|---|---|
| Quadrant | BADHDUFLAG | Total packets | Discarded packets |
| A | 0 | 20657 | 2 |
| B | 0 | 17263 | 2 |
| C | 0 | 14701 | 2 |
| D | 0 | 23708 | 2 |
| Mode SS | |||
|---|---|---|---|
| Quadrant | BADHDUFLAG | Total packets | Discarded packets |
| A | 0 | 142 | 0 |
| B | 0 | 142 | 0 |
| C | 0 | 142 | 0 |
| D | 0 | 142 | 0 |
| Mode M9 | |||
|---|---|---|---|
| Quadrant | BADHDUFLAG | Total packets | Discarded packets |
| A | 0 | 9 | 0 |
| B | 0 | 10 | 0 |
| C | 0 | 10 | 0 |
| D | 0 | 10 | 0 |
| Quadrant | Total seconds | Saturated seconds | Saturation percentage |
|---|---|---|---|
| A | 6943 | 203 | 2.923808% |
| B | 6943 | 434 | 6.250900% |
| C | 6943 | 47 | 0.676941% |
| D | 6943 | 738 | 10.629411% |
Noise dominated data is calculated using 1-second bins in cleaned event files. If a bin has >2000 counts, and if more than 50% of those come from <1% of pixels, then it is considered to be noise-dominated and hence unusable.
| Quadrant | # 1 sec bins | Bins with >0 counts | Bins with >2000 counts | High rate bins dominated by noise | Noise dominated (total time) | Noise dominated (detector-on time) | Marked lightcurve |
|---|---|---|---|---|---|---|---|
| A | 7828 | 6944 | 8 | 8 | 0.10% | 0.12% | 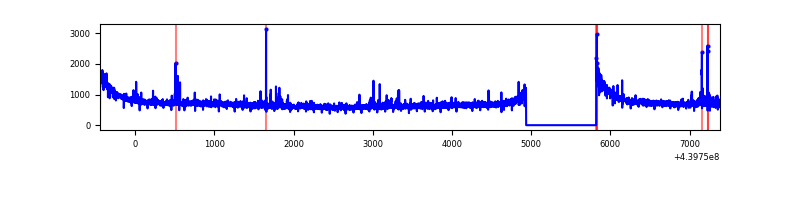 |
| B | 7828 | 6944 | 269 | 269 | 3.44% | 3.87% | 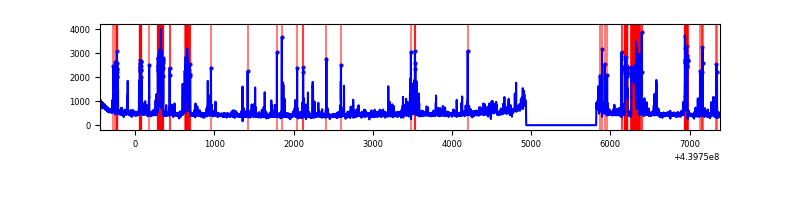 |
| C | 7828 | 6944 | 12 | 12 | 0.15% | 0.17% | 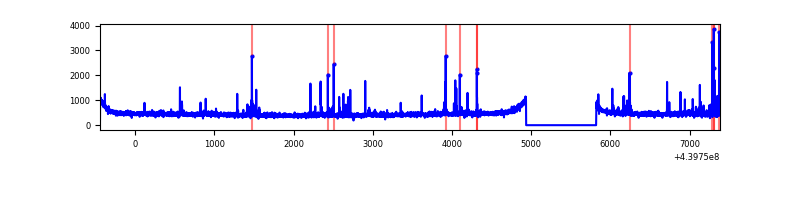 |
| D | 7828 | 6944 | 736 | 736 | 9.40% | 10.60% | 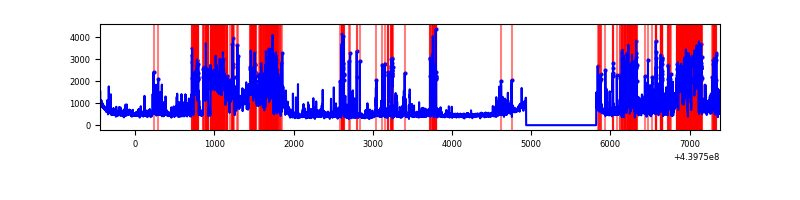 |
Top three noisy pixels from each quadrant. If the there are fewer than three noisy pixels in the level2.evt file, extra rows are filled as -1
| Pixel properties | Quadrant properties | ||||||
|---|---|---|---|---|---|---|---|
| Quadrant | DetID | PixID | Counts | Sigma | Mean | Median | Sigma |
| A | 10 | 83 | 1846134 | 11013.24 | 797 | 778 | 167.6 |
| A | 15 | 223 | 44988 | 263.85 | 797 | 778 | 167.6 |
| A | 0 | 243 | 44963 | 263.7 | 797 | 778 | 167.6 |
| B | 5 | 172 | 744869 | 4898.5 | 770 | 744 | 151.9 |
| B | 4 | 158 | 137097 | 897.6 | 770 | 744 | 151.9 |
| B | 0 | 219 | 100232 | 654.92 | 770 | 744 | 151.9 |
| C | 14 | 254 | 130088 | 697.05 | 787 | 792 | 185.5 |
| C | 1 | 3 | 26771 | 140.06 | 787 | 792 | 185.5 |
| C | 15 | 208 | 23313 | 121.41 | 787 | 792 | 185.5 |
| D | 1 | 20 | 1297649 | 6644.58 | 766 | 743 | 195.2 |
| D | 1 | 4 | 702033 | 3593.0 | 766 | 743 | 195.2 |
| D | 13 | 249 | 390666 | 1997.73 | 766 | 743 | 195.2 |
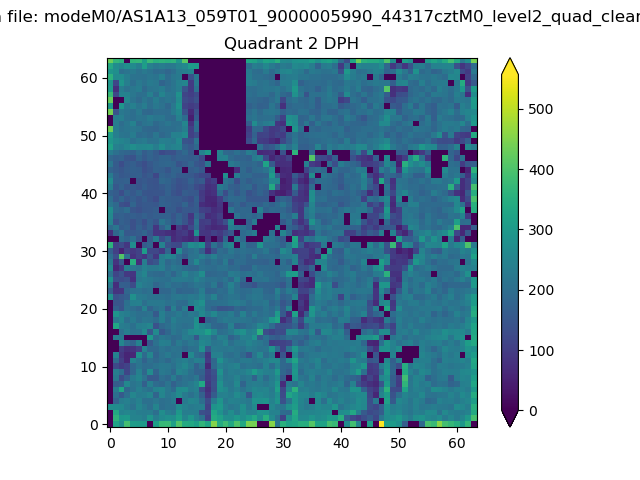
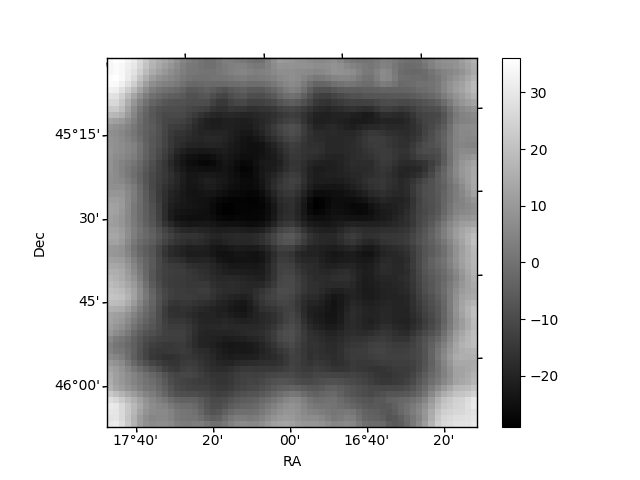
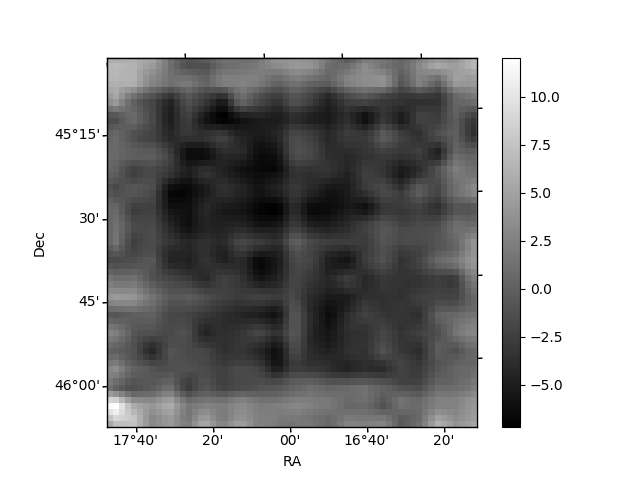
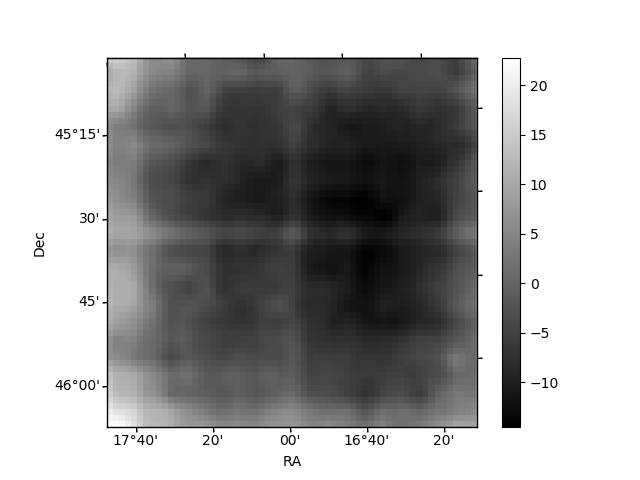
Histogram calculated using DETX and DETY for each event in the final _common_clean file
| Quadrant A | 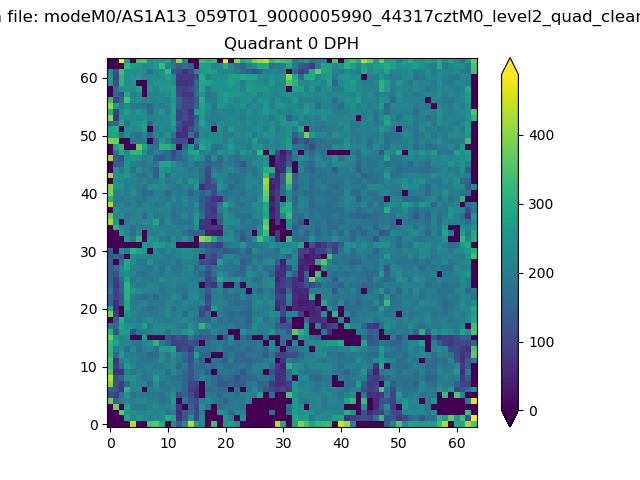 |
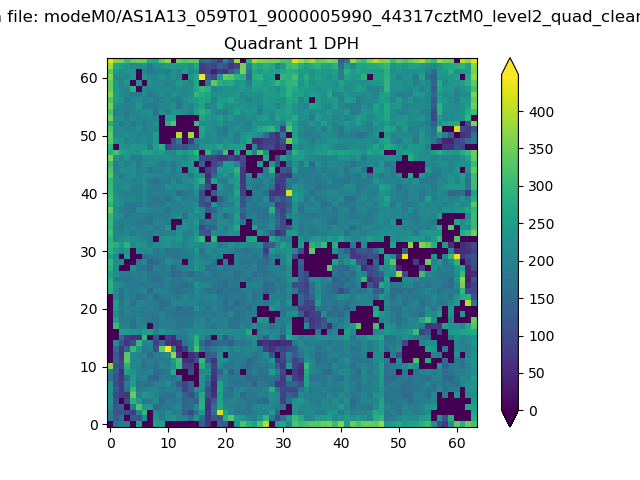 |
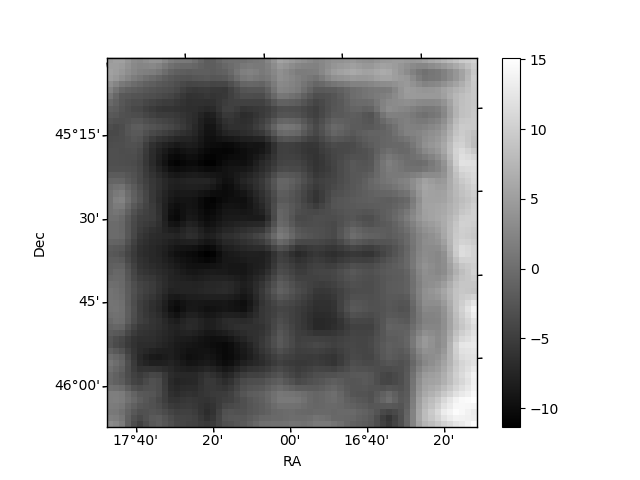
Quadrant B |
|---|---|---|---|
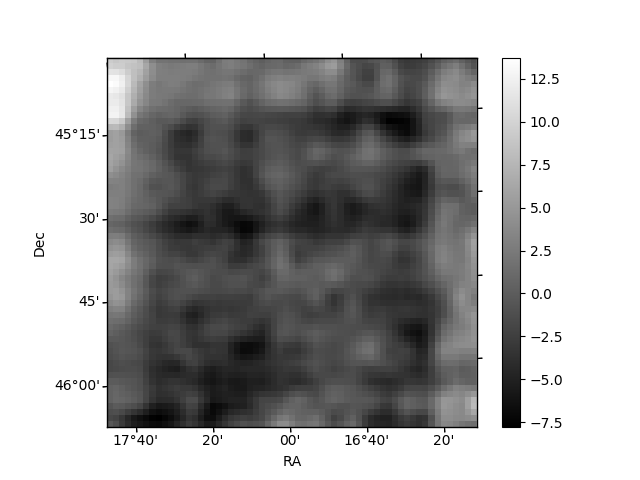
| Quadrant D | 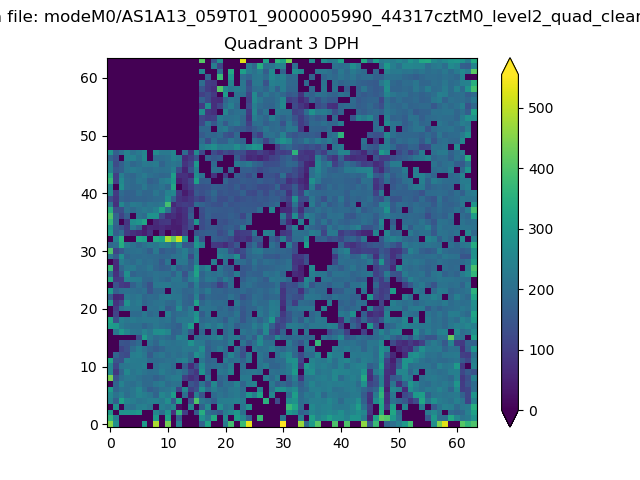 |
 |
Quadrant C |
| Plot type | Count rate plots | Images |
|---|---|---|
| Comparison with Poisson distribution Blue bars denote a histogram of data divided into 1 sec bins. Red curve is a Poisson curve with rate = median count rate of data. |
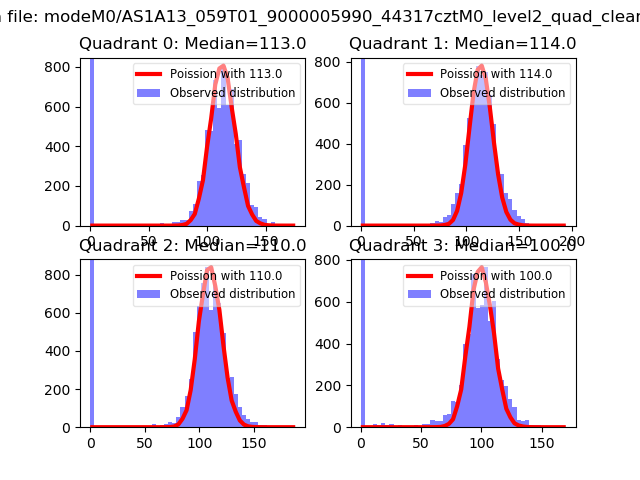 |
 |
| Quadrant-wise count rates Data is divided into 100 sec bins |
 |
|
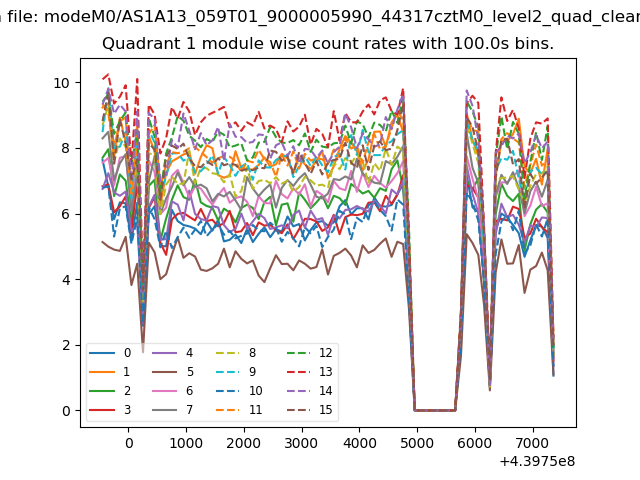
| Module-wise count rates for Quadrant A Data is divided into 100 sec bins |
 |
 |
| Module-wise count rates for Quadrant B Data is divided into 100 sec bins |
 |
 |
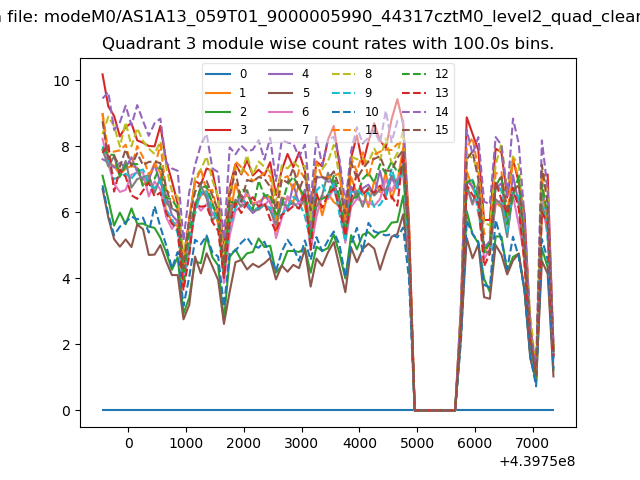
| Module-wise count rates for Quadrant C Data is divided into 100 sec bins |
 |
 |
| Module-wise count rates for Quadrant D Data is divided into 100 sec bins |
 |
 |
| Parameter | Plot |
|---|---|
| CZT HV Monitor | 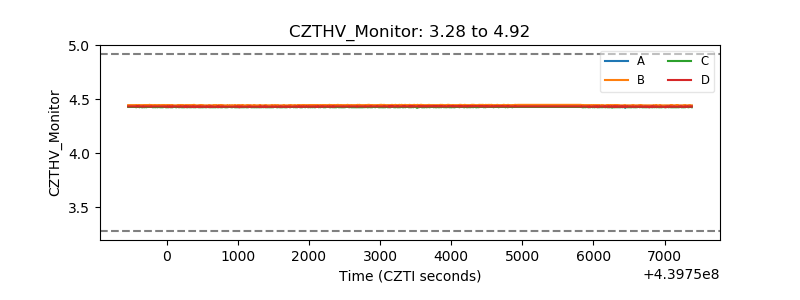 |
| D_VDD | 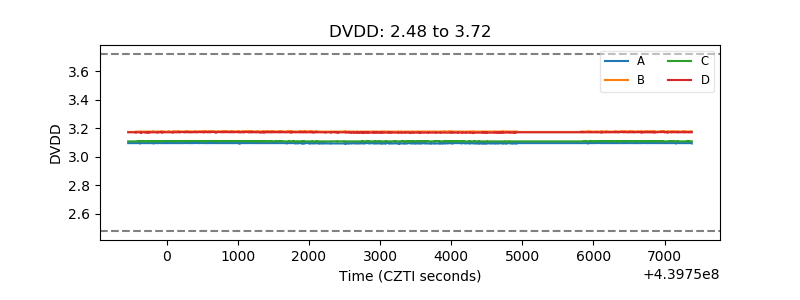 |
| Temperature 1 | 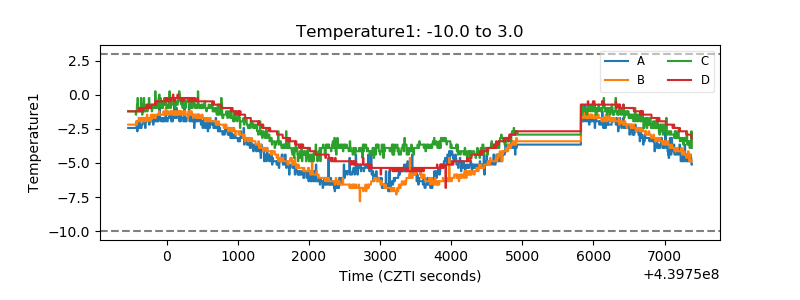 |
| Veto HV Monitor | 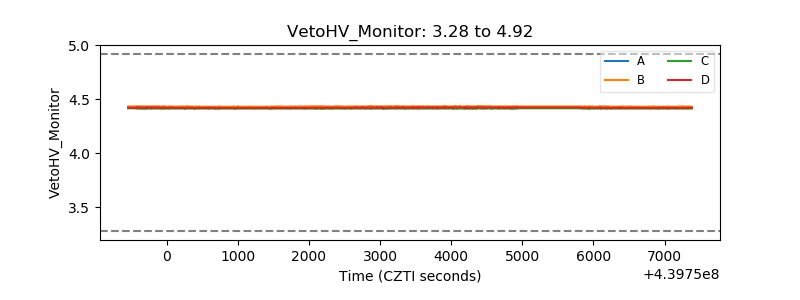 |
| Veto LLD | 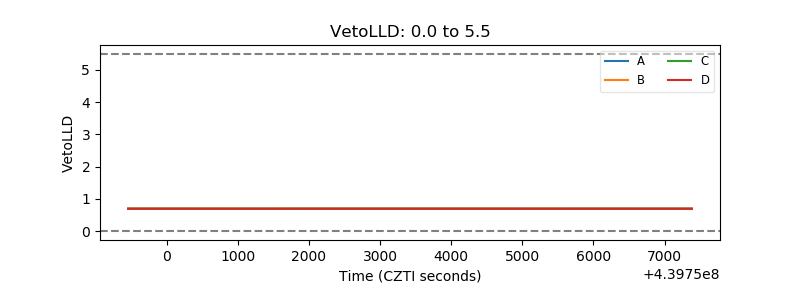 |
| Alpha Counter | 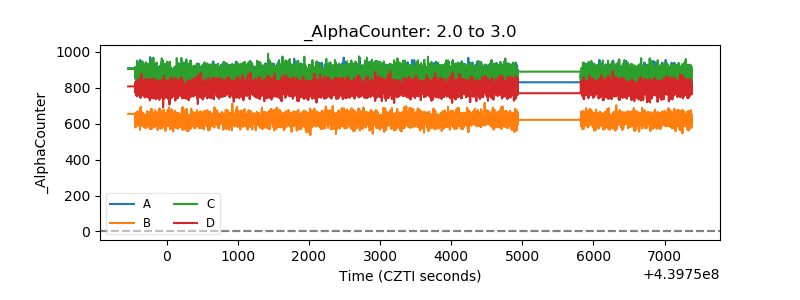 |
| _CPM_Rate | 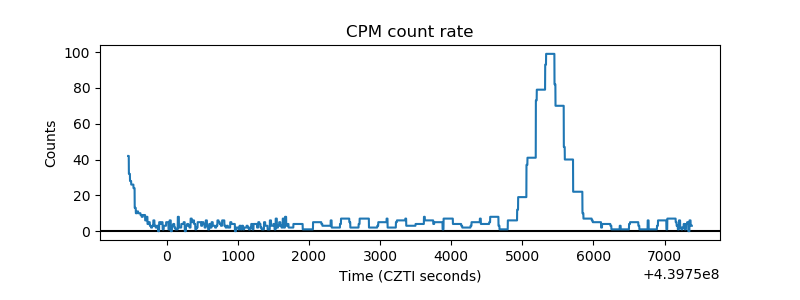 |
| CZT Counter | 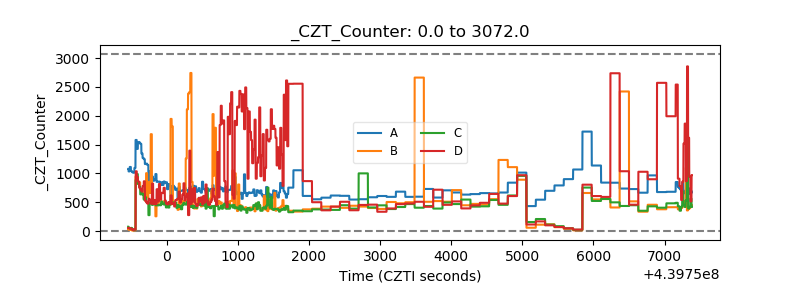 |
| +2.5 Volts monitor | 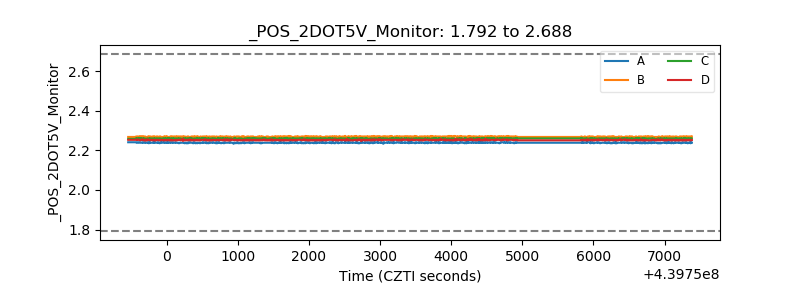 |
| +5 Volts monitor | 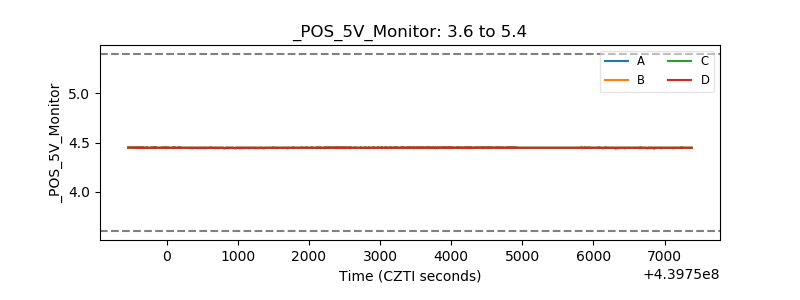 |
| _ROLL_ROT | 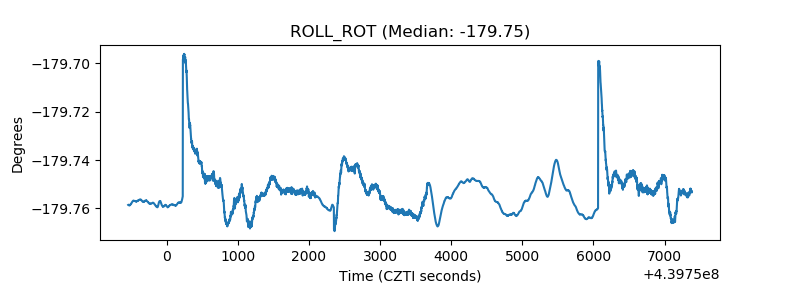 |
| _Roll_DEC | 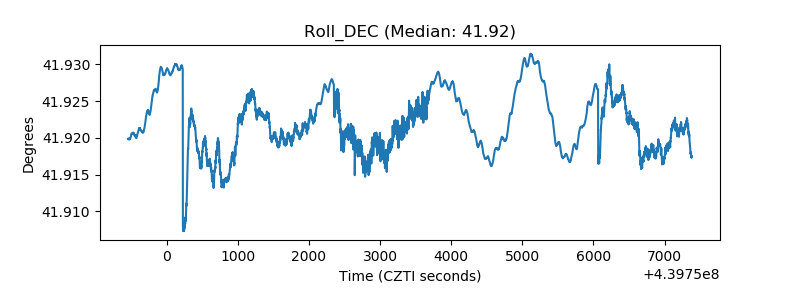 |
| _Roll_RA | 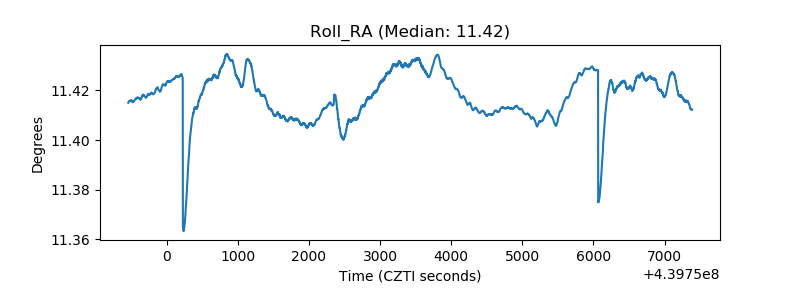 |
| Veto Counter | 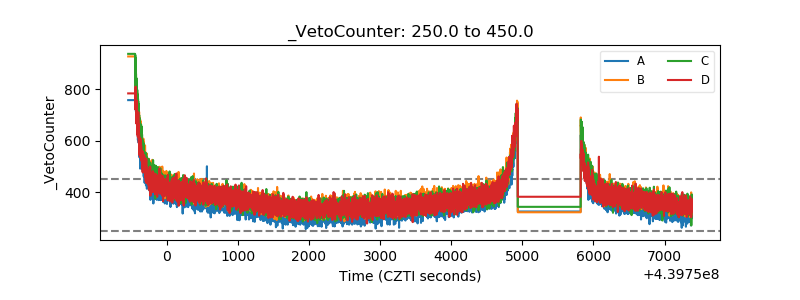 |