| Param | Original file | Final file |
|---|---|---|
| Filename | modeM0/AS1A13_059T01_9000005990_44318cztM0_level2.fits | modeM0/AS1A13_059T01_9000005990_44318cztM0_level2_quad_clean.evt |
| Size (bytes) | 602,352,000 | 113,808,960 |
| Size | 574.4 MB | 108.5 MB |
| Events in quadrant A | 5,680,244 | 789,270 |
| Events in quadrant B | 5,139,117 | 732,727 |
| Events in quadrant C | 4,084,806 | 756,619 |
| Events in quadrant D | 6,825,095 | 658,248 |
| Mode M0 | |||
|---|---|---|---|
| Quadrant | BADHDUFLAG | Total packets | Discarded packets |
| A | 0 | 22795 | 2 |
| B | 0 | 20383 | 2 |
| C | 0 | 17486 | 2 |
| D | 0 | 25414 | 2 |
| Mode SS | |||
|---|---|---|---|
| Quadrant | BADHDUFLAG | Total packets | Discarded packets |
| A | 0 | 148 | 0 |
| B | 0 | 148 | 0 |
| C | 0 | 148 | 0 |
| D | 0 | 148 | 0 |
| Mode M9 | |||
|---|---|---|---|
| Quadrant | BADHDUFLAG | Total packets | Discarded packets |
| A | 0 | 6 | 0 |
| B | 0 | 7 | 0 |
| C | 0 | 7 | 0 |
| D | 0 | 7 | 0 |
| Quadrant | Total seconds | Saturated seconds | Saturation percentage |
|---|---|---|---|
| A | 7318 | 240 | 3.279585% |
| B | 7318 | 824 | 11.259907% |
| C | 7318 | 351 | 4.796392% |
| D | 7318 | 875 | 11.956819% |
Noise dominated data is calculated using 1-second bins in cleaned event files. If a bin has >2000 counts, and if more than 50% of those come from <1% of pixels, then it is considered to be noise-dominated and hence unusable.
| Quadrant | # 1 sec bins | Bins with >0 counts | Bins with >2000 counts | High rate bins dominated by noise | Noise dominated (total time) | Noise dominated (detector-on time) | Marked lightcurve |
|---|---|---|---|---|---|---|---|
| A | 7733 | 7320 | 54 | 54 | 0.70% | 0.74% | 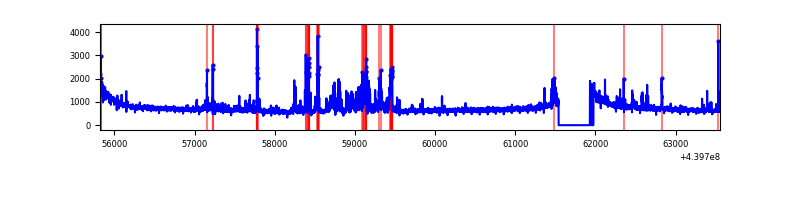 |
| B | 7733 | 7320 | 613 | 613 | 7.93% | 8.37% | 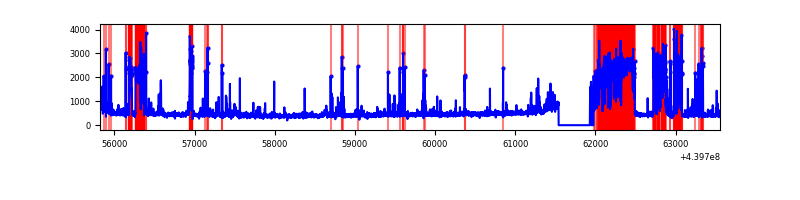 |
| C | 7733 | 7320 | 248 | 248 | 3.21% | 3.39% | 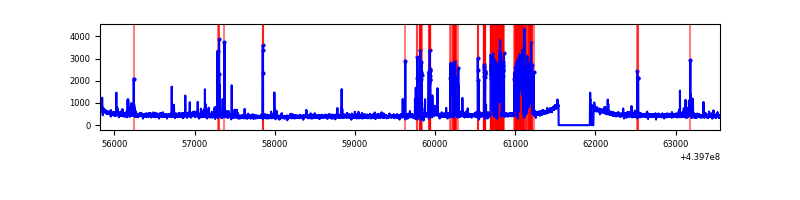 |
| D | 7733 | 7320 | 765 | 765 | 9.89% | 10.45% | 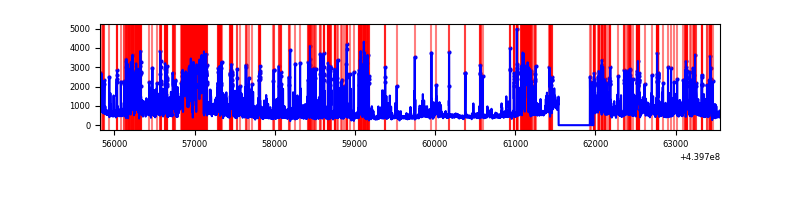 |
Top three noisy pixels from each quadrant. If the there are fewer than three noisy pixels in the level2.evt file, extra rows are filled as -1
| Pixel properties | Quadrant properties | ||||||
|---|---|---|---|---|---|---|---|
| Quadrant | DetID | PixID | Counts | Sigma | Mean | Median | Sigma |
| A | 10 | 83 | 1822781 | 10530.47 | 829 | 809 | 173.0 |
| A | 15 | 223 | 542867 | 3132.94 | 829 | 809 | 173.0 |
| A | 0 | 243 | 53227 | 302.96 | 829 | 809 | 173.0 |
| B | 5 | 172 | 1848495 | 12091.3 | 772 | 747 | 152.8 |
| B | 5 | 255 | 57679 | 372.55 | 772 | 747 | 152.8 |
| B | 0 | 219 | 46325 | 298.25 | 772 | 747 | 152.8 |
| C | 12 | 16 | 764271 | 4046.66 | 798 | 801 | 188.7 |
| C | 14 | 254 | 159916 | 843.37 | 798 | 801 | 188.7 |
| C | 1 | 3 | 28223 | 145.35 | 798 | 801 | 188.7 |
| D | 1 | 4 | 994207 | 5017.96 | 780 | 755 | 198.0 |
| D | 13 | 249 | 808325 | 4079.07 | 780 | 755 | 198.0 |
| D | 5 | 171 | 348762 | 1757.8 | 780 | 755 | 198.0 |
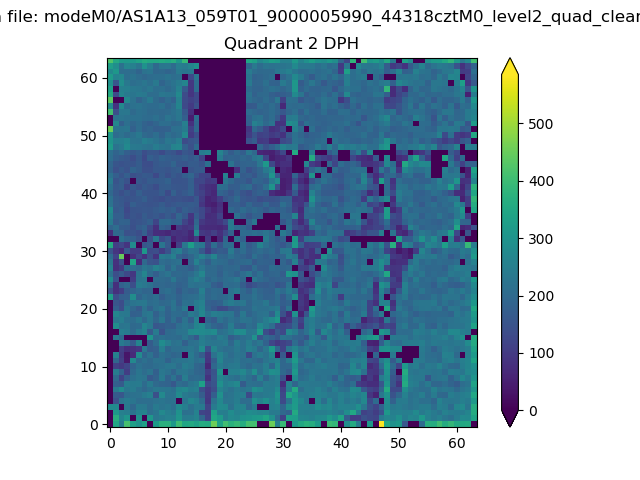
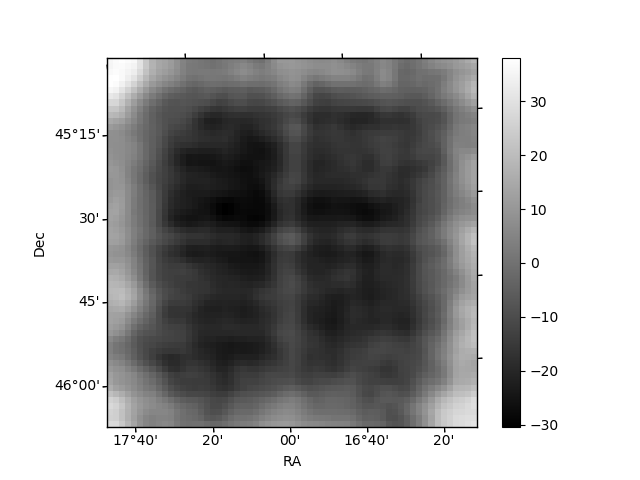
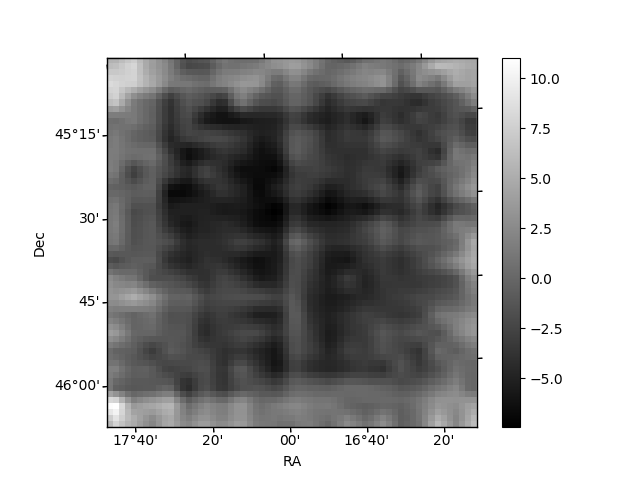
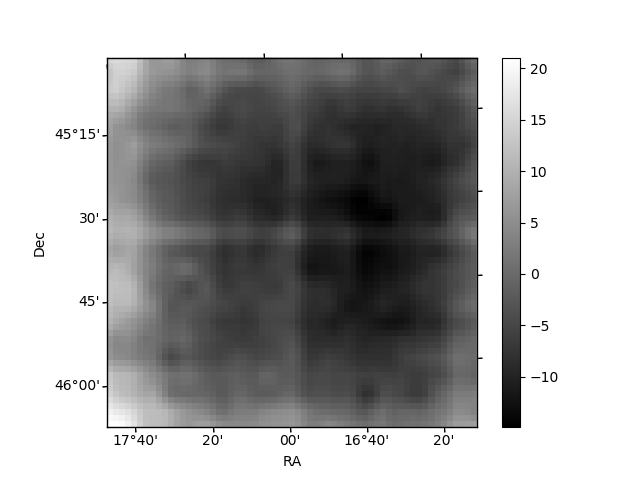
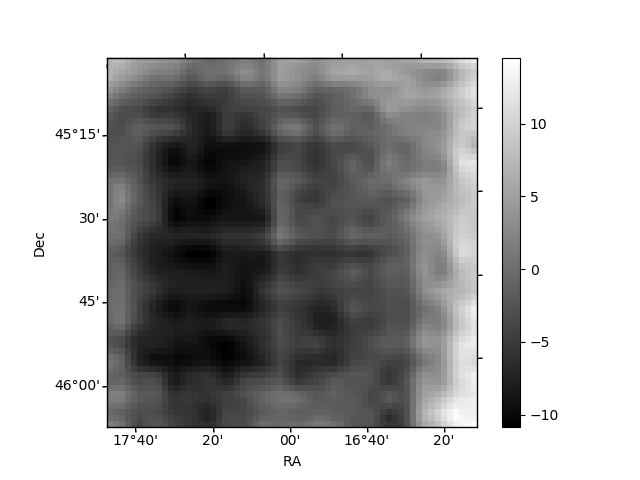
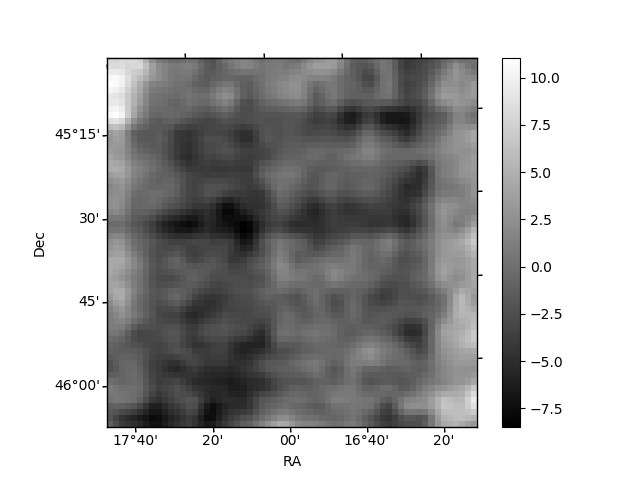
Histogram calculated using DETX and DETY for each event in the final _common_clean file
| Quadrant A | 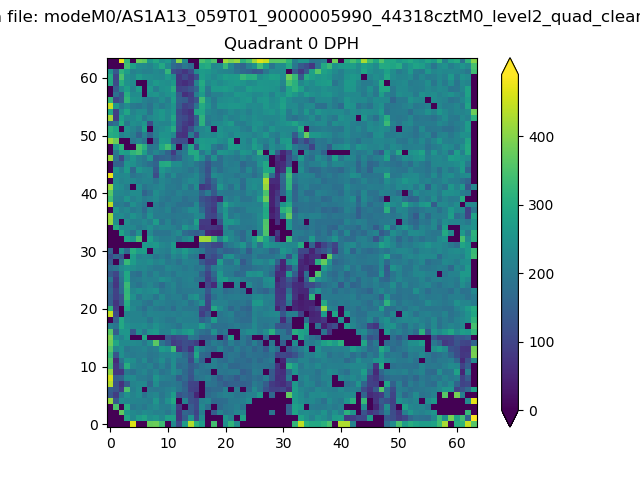 |
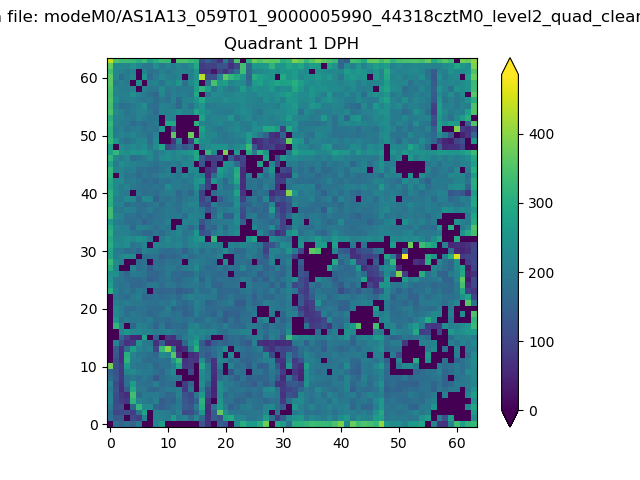 |
Quadrant B |
|---|---|---|---|
| Quadrant D | 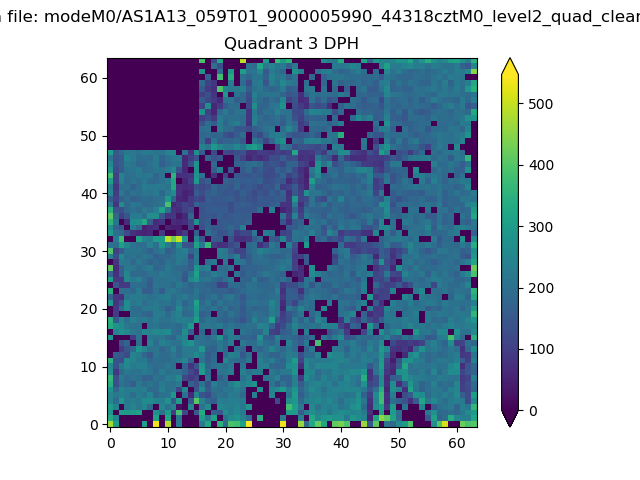 |
 |
Quadrant C |
| Plot type | Count rate plots | Images |
|---|---|---|
| Comparison with Poisson distribution Blue bars denote a histogram of data divided into 1 sec bins. Red curve is a Poisson curve with rate = median count rate of data. |
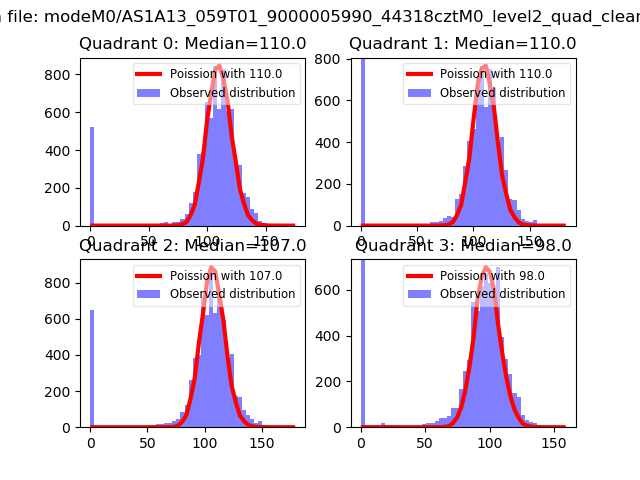 |
 |
| Quadrant-wise count rates Data is divided into 100 sec bins |
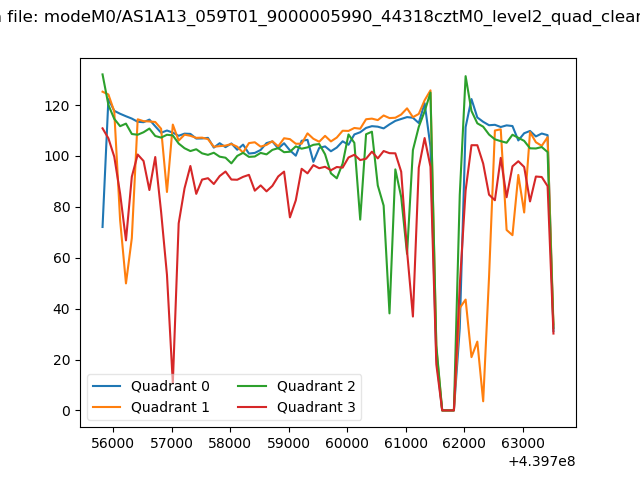 |
|
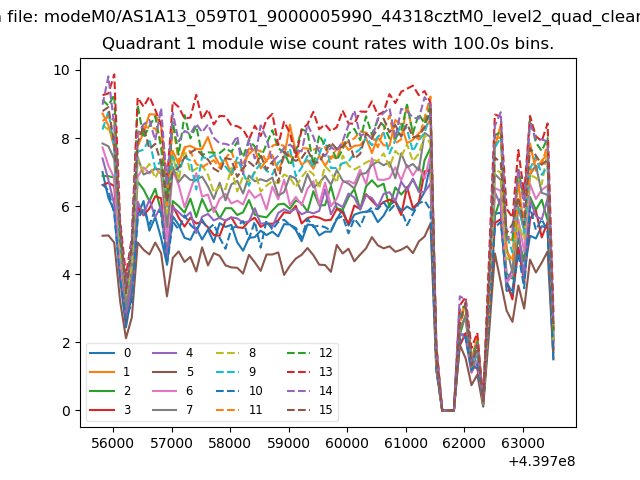
| Module-wise count rates for Quadrant A Data is divided into 100 sec bins |
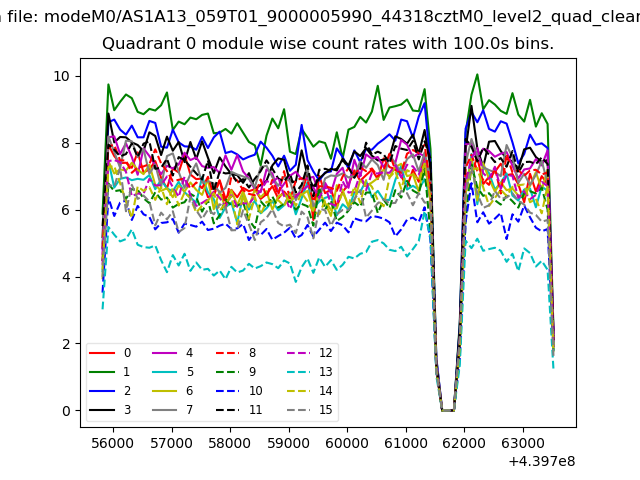 |
 |
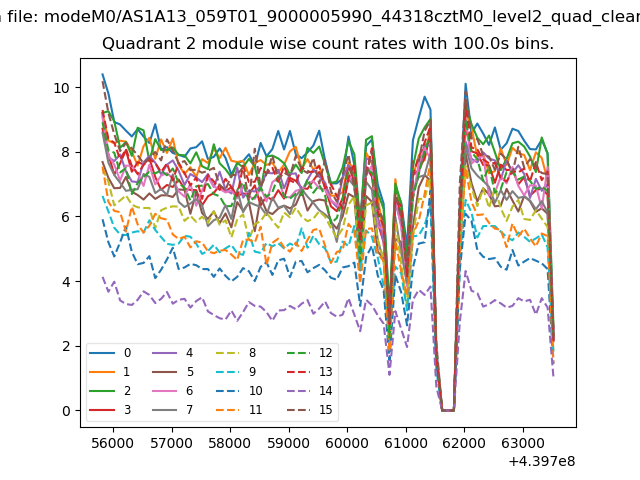
| Module-wise count rates for Quadrant B Data is divided into 100 sec bins |
 |
 |
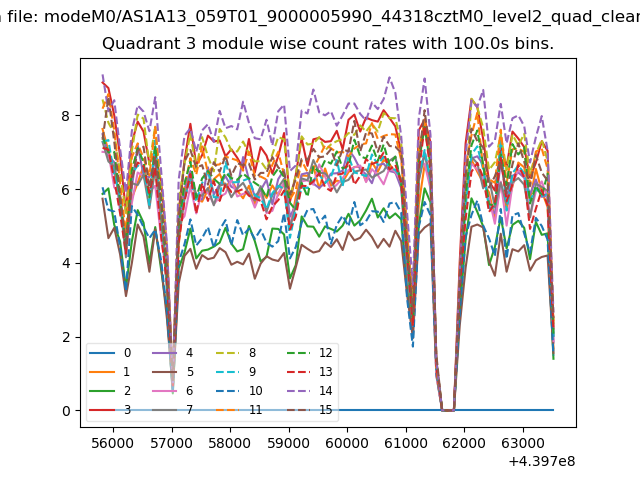
| Module-wise count rates for Quadrant C Data is divided into 100 sec bins |
 |
 |
| Module-wise count rates for Quadrant D Data is divided into 100 sec bins |
 |
 |
| Parameter | Plot |
|---|---|
| CZT HV Monitor | 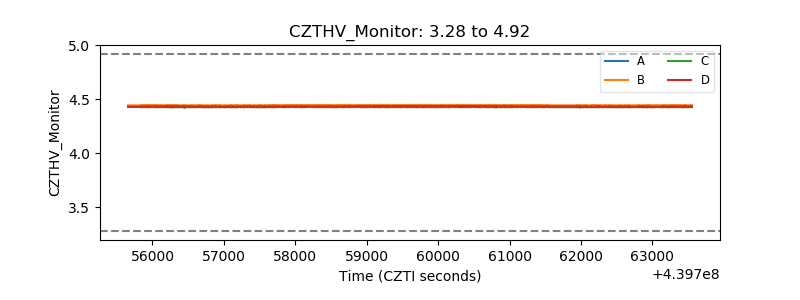 |
| D_VDD | 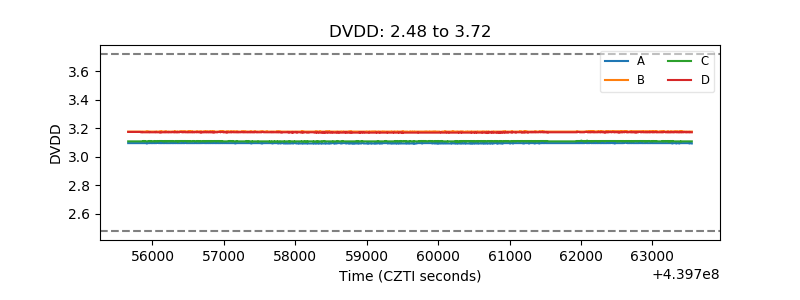 |
| Temperature 1 | 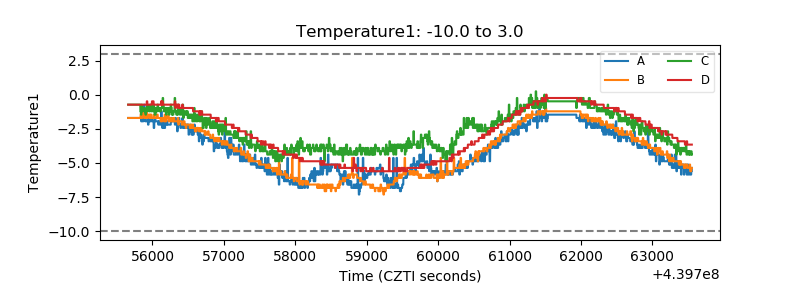 |
| Veto HV Monitor | 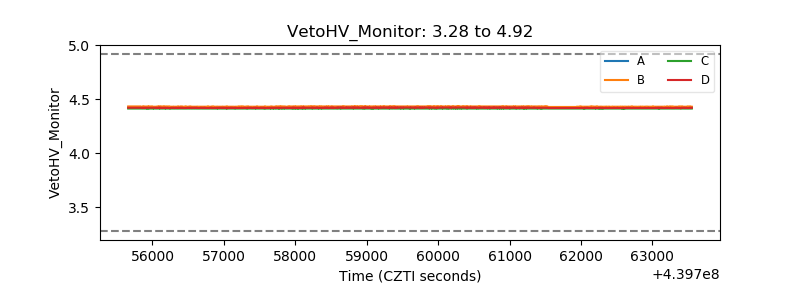 |
| Veto LLD | 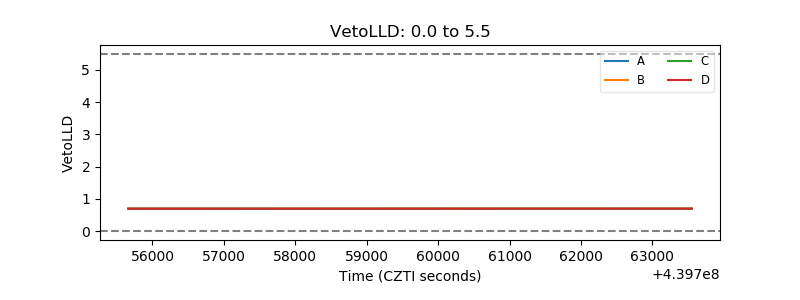 |
| Alpha Counter | 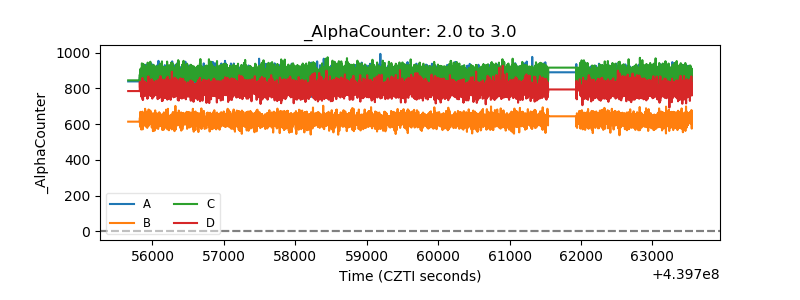 |
| _CPM_Rate | 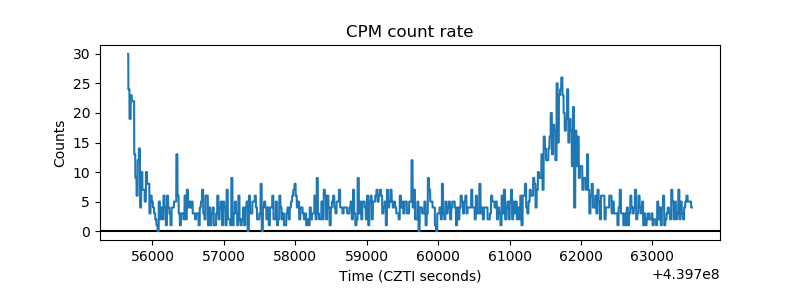 |
| CZT Counter | 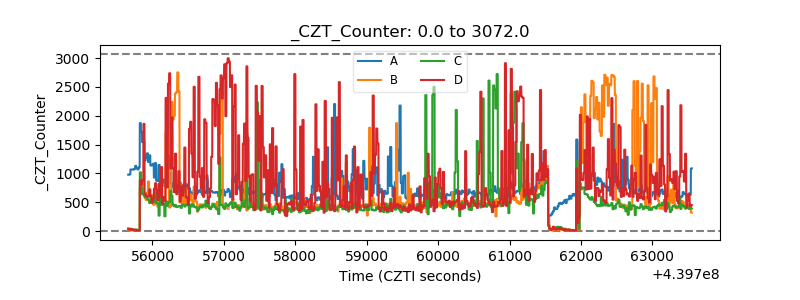 |
| +2.5 Volts monitor | 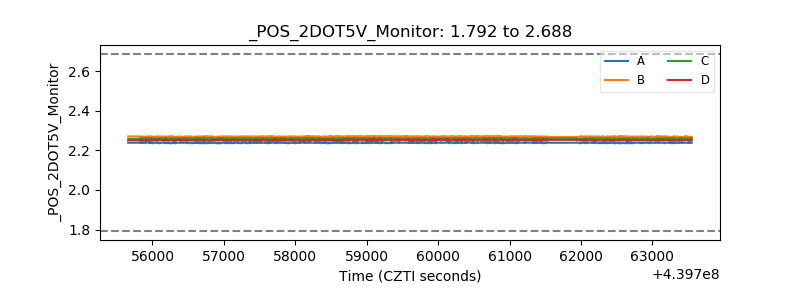 |
| +5 Volts monitor | 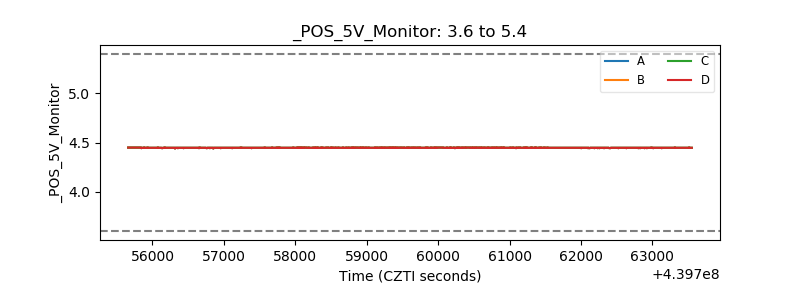 |
| _ROLL_ROT | 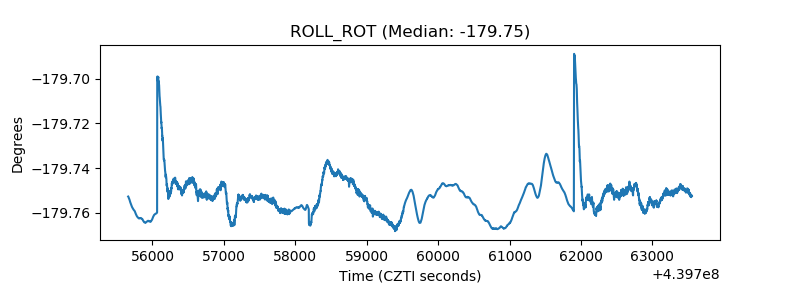 |
| _Roll_DEC | 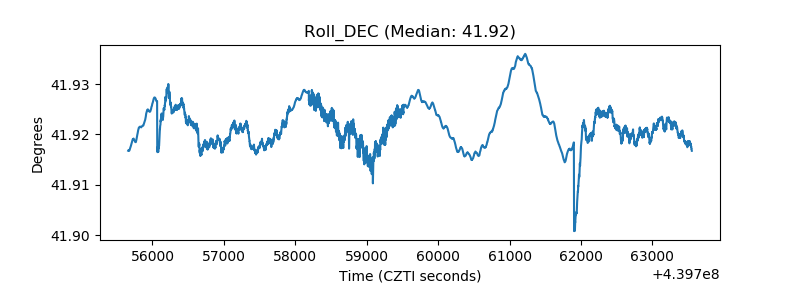 |
| _Roll_RA | 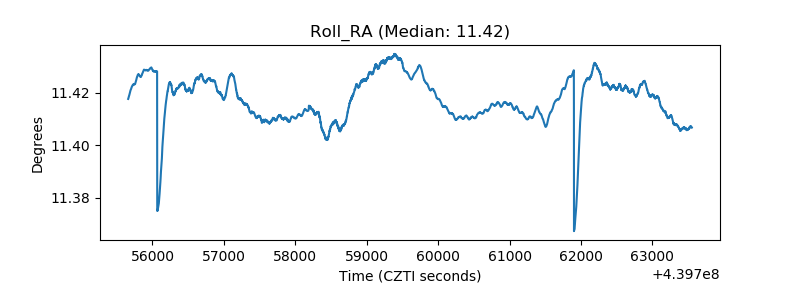 |
| Veto Counter | 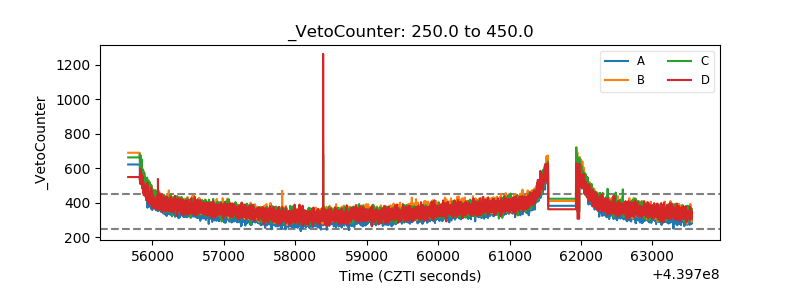 |