| Param | Original file | Final file |
|---|---|---|
| Filename | modeM0/AS1A13_059T01_9000005990_44319cztM0_level2.fits | modeM0/AS1A13_059T01_9000005990_44319cztM0_level2_quad_clean.evt |
| Size (bytes) | 621,446,400 | 126,034,560 |
| Size | 592.7 MB | 120.2 MB |
| Events in quadrant A | 5,599,149 | 873,518 |
| Events in quadrant B | 6,338,651 | 778,908 |
| Events in quadrant C | 3,869,234 | 858,545 |
| Events in quadrant D | 6,573,490 | 746,996 |
| Mode M0 | |||
|---|---|---|---|
| Quadrant | BADHDUFLAG | Total packets | Discarded packets |
| A | 0 | 22917 | 1 |
| B | 0 | 24434 | 1 |
| C | 0 | 17444 | 1 |
| D | 0 | 25223 | 1 |
| Mode SS | |||
|---|---|---|---|
| Quadrant | BADHDUFLAG | Total packets | Discarded packets |
| A | 0 | 162 | 0 |
| B | 0 | 162 | 0 |
| C | 0 | 162 | 0 |
| D | 0 | 162 | 0 |
| Mode M9 | |||
|---|---|---|---|
| Quadrant | BADHDUFLAG | Total packets | Discarded packets |
| A | 0 | 5 | 0 |
| B | 0 | 5 | 0 |
| C | 0 | 5 | 0 |
| D | 0 | 5 | 0 |
| Quadrant | Total seconds | Saturated seconds | Saturation percentage |
|---|---|---|---|
| A | 8037 | 156 | 1.941023% |
| B | 8037 | 1090 | 13.562274% |
| C | 8037 | 78 | 0.970511% |
| D | 8037 | 646 | 8.037825% |
Noise dominated data is calculated using 1-second bins in cleaned event files. If a bin has >2000 counts, and if more than 50% of those come from <1% of pixels, then it is considered to be noise-dominated and hence unusable.
| Quadrant | # 1 sec bins | Bins with >0 counts | Bins with >2000 counts | High rate bins dominated by noise | Noise dominated (total time) | Noise dominated (detector-on time) | Marked lightcurve |
|---|---|---|---|---|---|---|---|
| A | 8452 | 8039 | 10 | 10 | 0.12% | 0.12% | 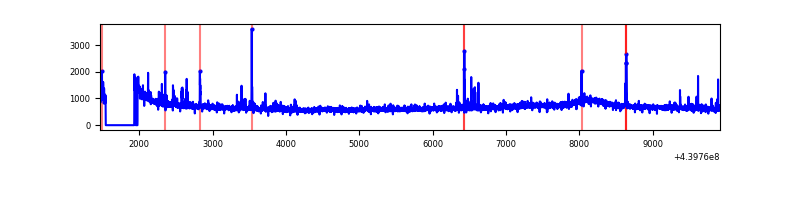 |
| B | 8452 | 8039 | 791 | 791 | 9.36% | 9.84% | 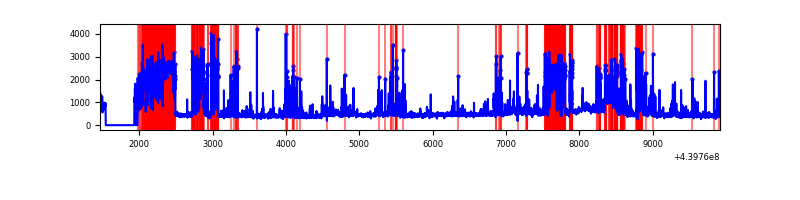 |
| C | 8452 | 8039 | 36 | 36 | 0.43% | 0.45% | 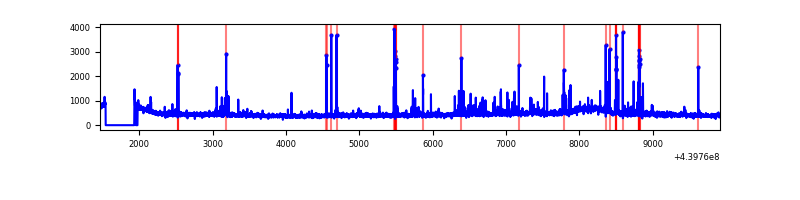 |
| D | 8452 | 8039 | 462 | 462 | 5.47% | 5.75% | 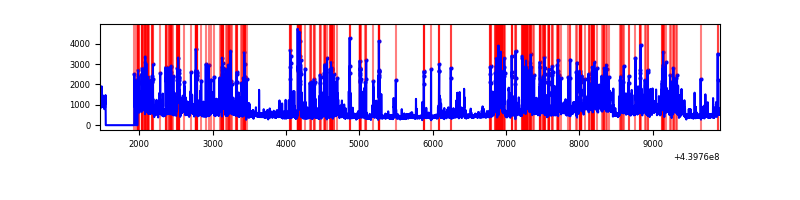 |
Top three noisy pixels from each quadrant. If the there are fewer than three noisy pixels in the level2.evt file, extra rows are filled as -1
| Pixel properties | Quadrant properties | ||||||
|---|---|---|---|---|---|---|---|
| Quadrant | DetID | PixID | Counts | Sigma | Mean | Median | Sigma |
| A | 10 | 83 | 1846667 | 9546.8 | 920 | 897 | 193.3 |
| A | 15 | 223 | 65096 | 332.05 | 920 | 897 | 193.3 |
| A | 7 | 3 | 58310 | 296.95 | 920 | 897 | 193.3 |
| B | 5 | 172 | 2368910 | 14086.9 | 850 | 823 | 168.1 |
| B | 5 | 255 | 356179 | 2113.89 | 850 | 823 | 168.1 |
| B | 5 | 235 | 67265 | 395.24 | 850 | 823 | 168.1 |
| C | 14 | 254 | 255035 | 1182.11 | 906 | 910 | 215.0 |
| C | 1 | 3 | 26520 | 119.13 | 906 | 910 | 215.0 |
| C | 3 | 233 | 21516 | 95.85 | 906 | 910 | 215.0 |
| D | 13 | 249 | 651523 | 2909.44 | 882 | 854 | 223.6 |
| D | 1 | 52 | 370170 | 1651.38 | 882 | 854 | 223.6 |
| D | 13 | 171 | 367863 | 1641.07 | 882 | 854 | 223.6 |
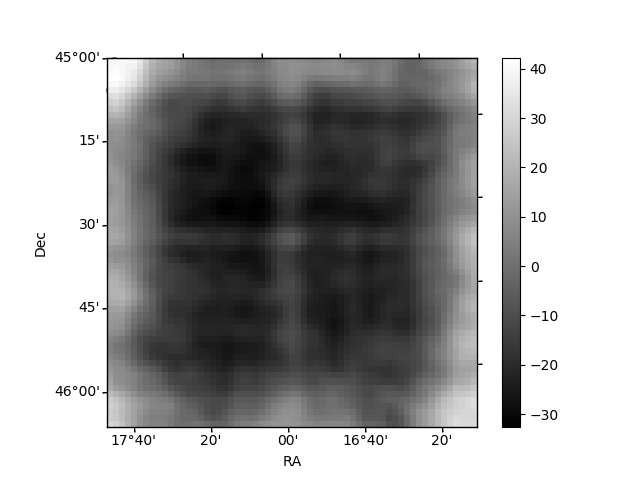
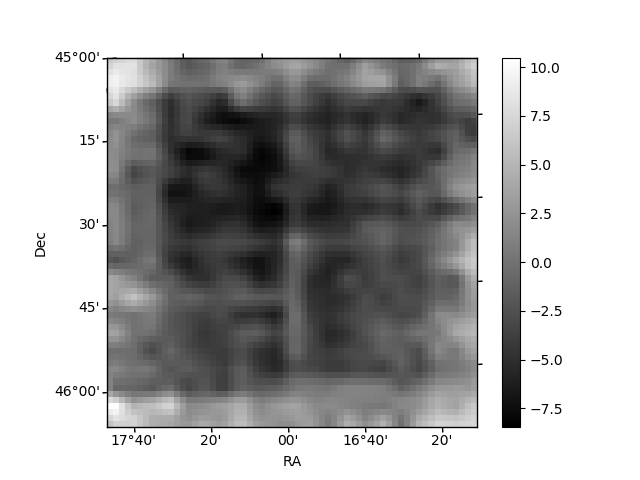
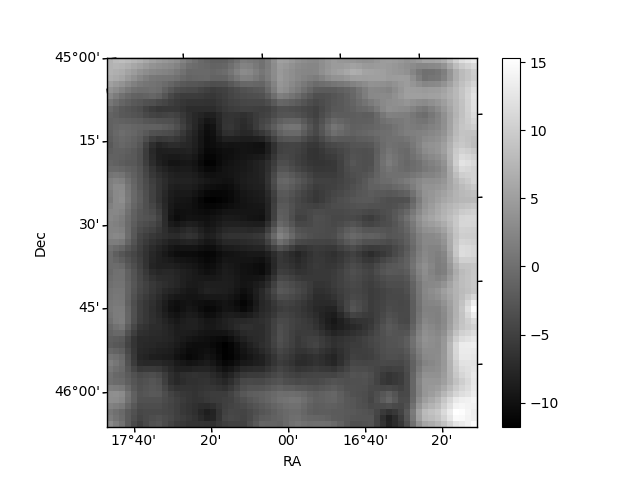
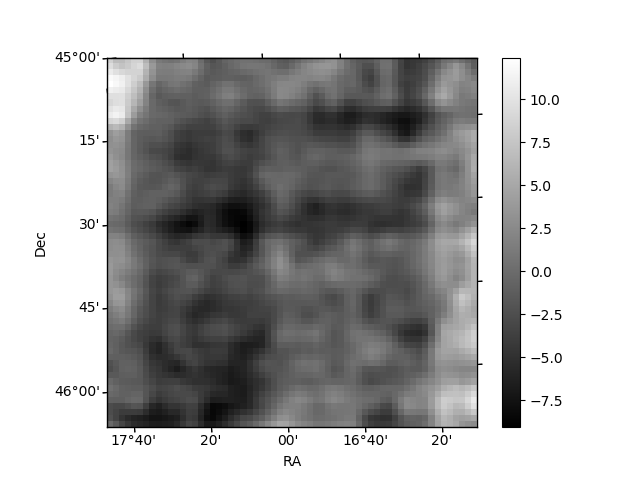
Histogram calculated using DETX and DETY for each event in the final _common_clean file
| Quadrant A | 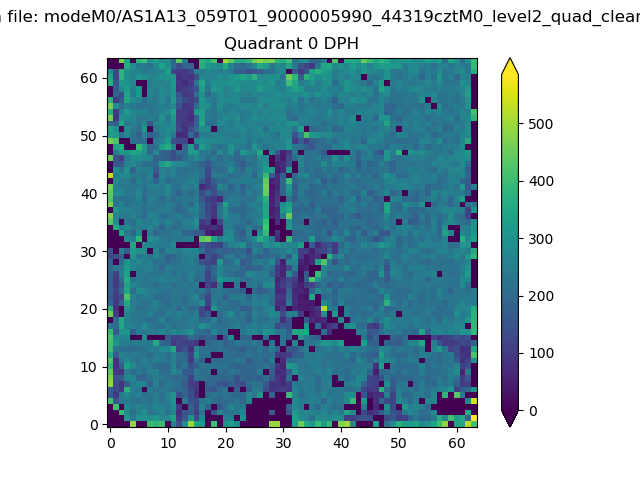 |
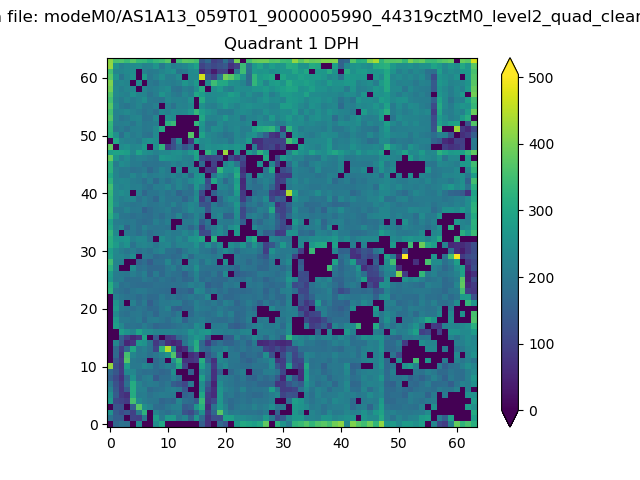 |
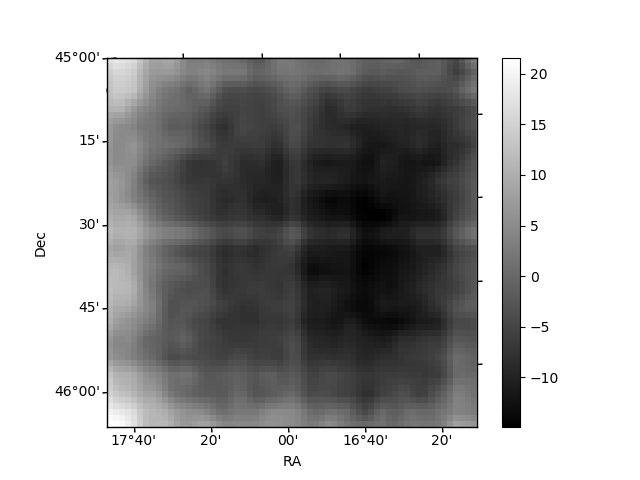
Quadrant B |
|---|---|---|---|
| Quadrant D | 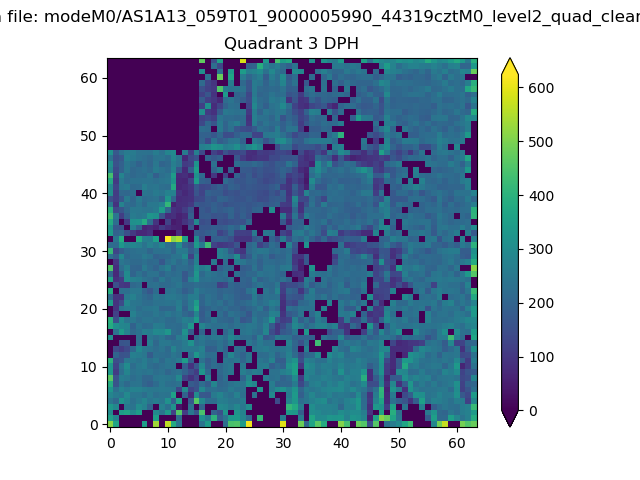 |
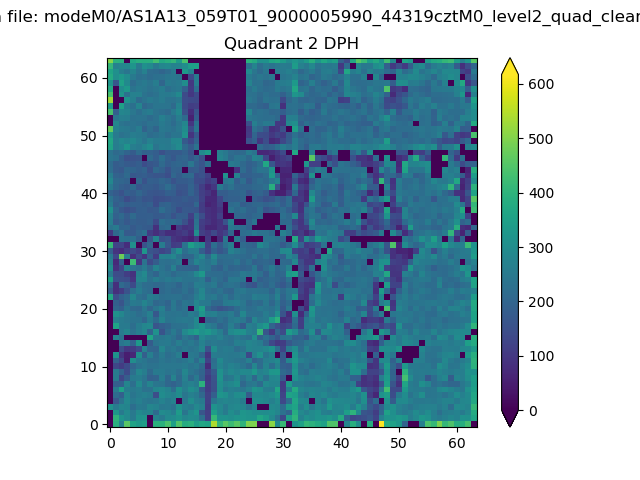 |
Quadrant C |
| Plot type | Count rate plots | Images |
|---|---|---|
| Comparison with Poisson distribution Blue bars denote a histogram of data divided into 1 sec bins. Red curve is a Poisson curve with rate = median count rate of data. |
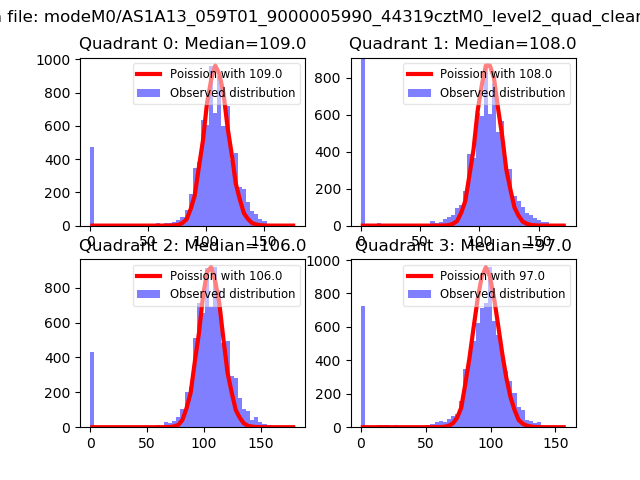 |
 |
| Quadrant-wise count rates Data is divided into 100 sec bins |
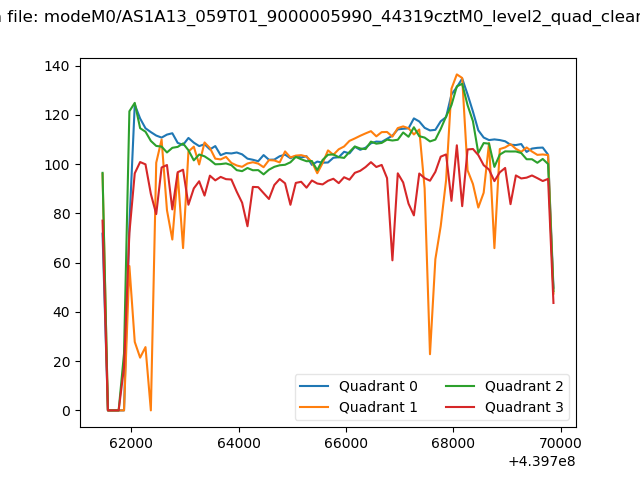 |
|
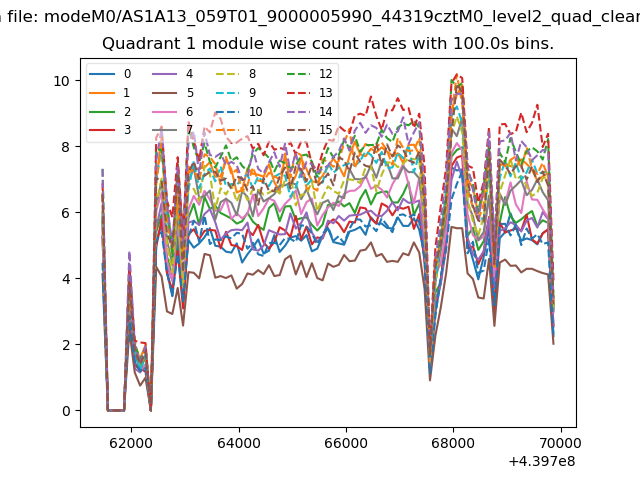
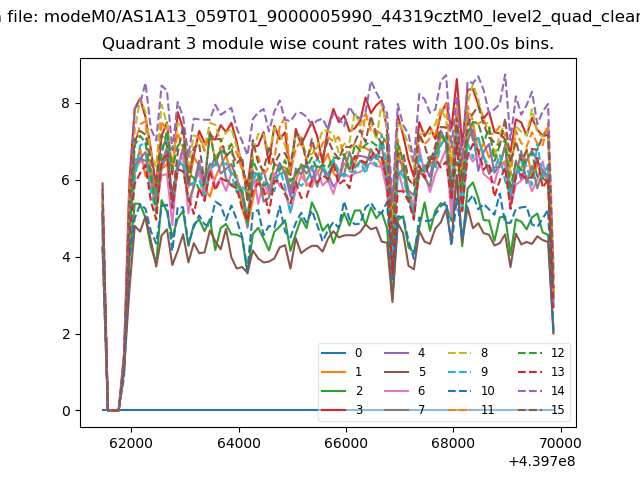
| Module-wise count rates for Quadrant A Data is divided into 100 sec bins |
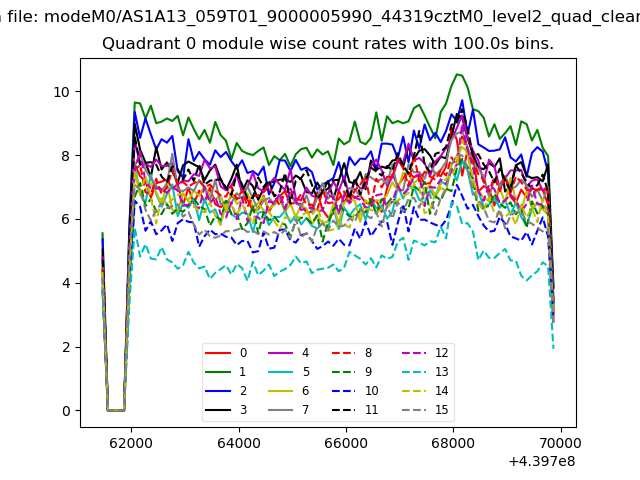 |
 |
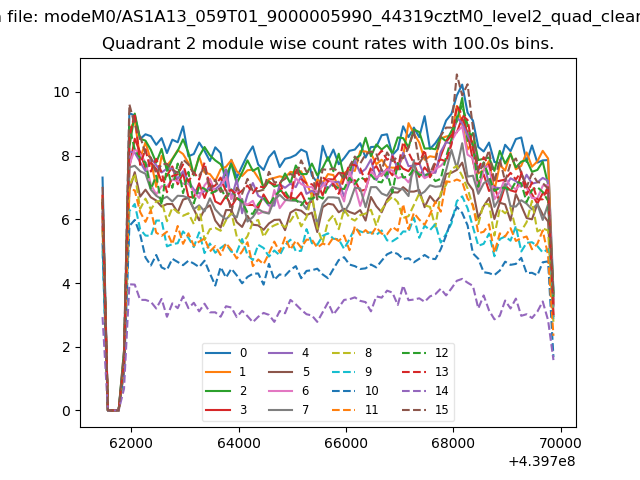
| Module-wise count rates for Quadrant B Data is divided into 100 sec bins |
 |
 |
| Module-wise count rates for Quadrant C Data is divided into 100 sec bins |
 |
 |
| Module-wise count rates for Quadrant D Data is divided into 100 sec bins |
 |
 |
| Parameter | Plot |
|---|---|
| CZT HV Monitor | 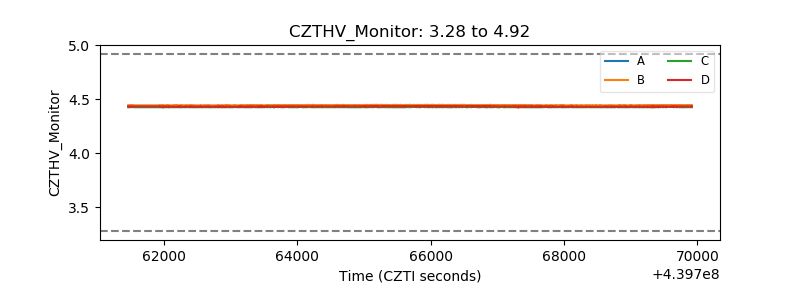 |
| D_VDD | 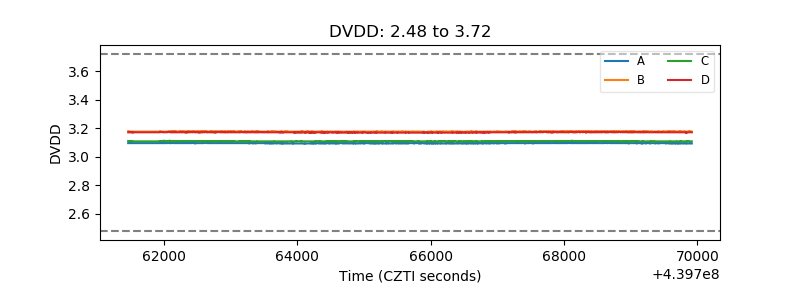 |
| Temperature 1 | 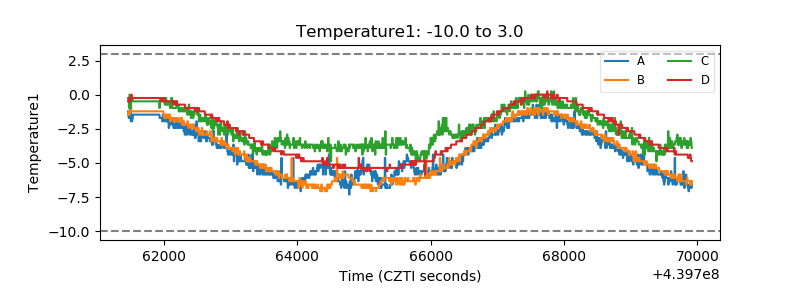 |
| Veto HV Monitor | 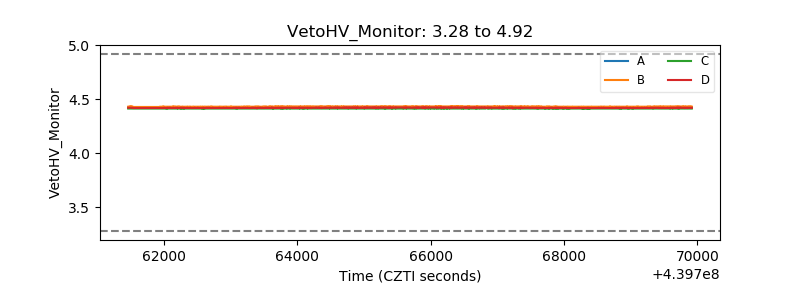 |
| Veto LLD | 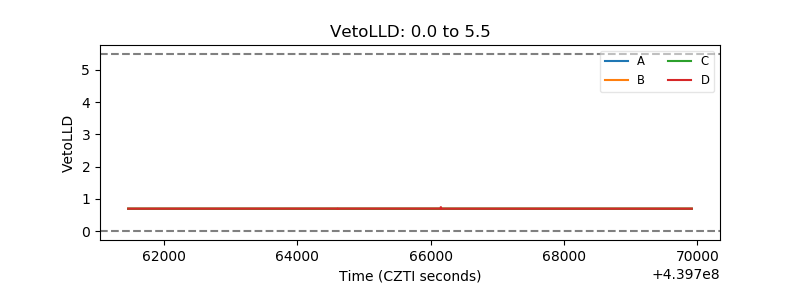 |
| Alpha Counter | 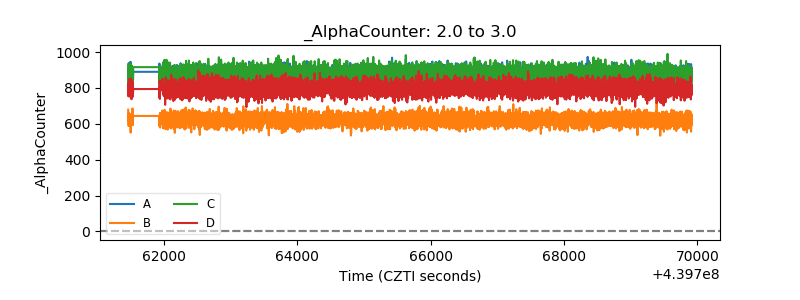 |
| _CPM_Rate | 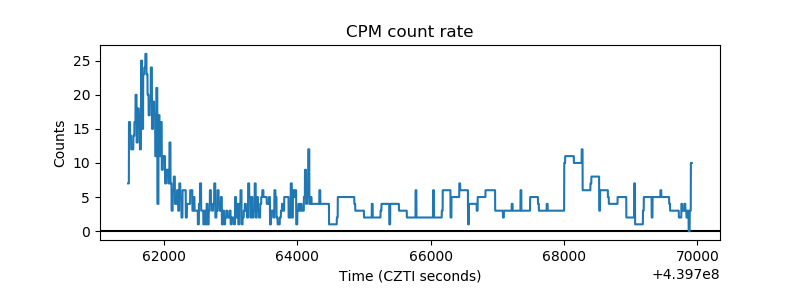 |
| CZT Counter | 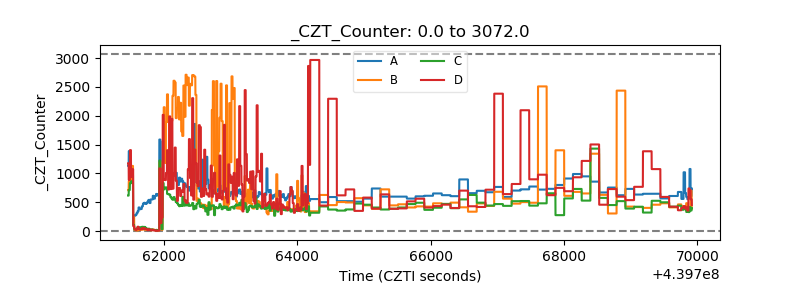 |
| +2.5 Volts monitor | 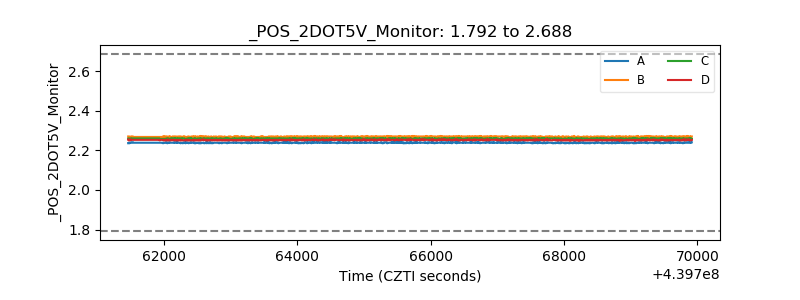 |
| +5 Volts monitor | 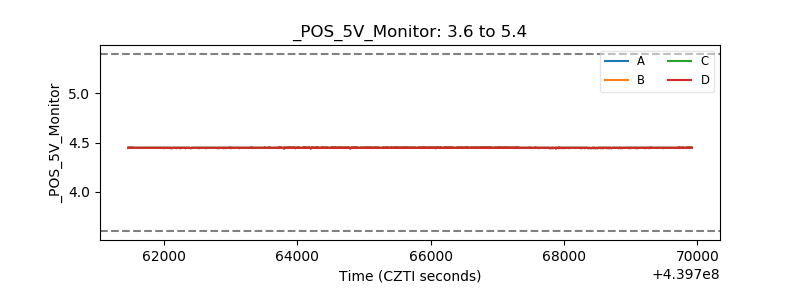 |
| _ROLL_ROT | 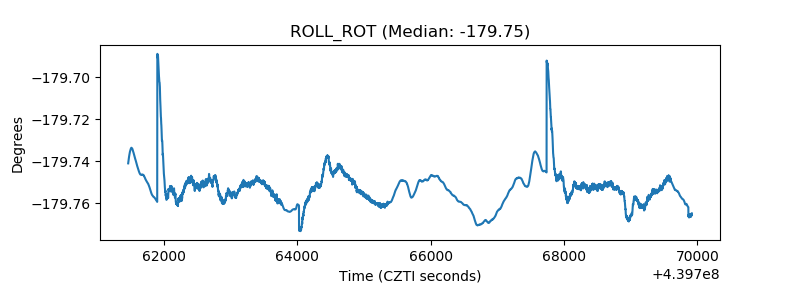 |
| _Roll_DEC | 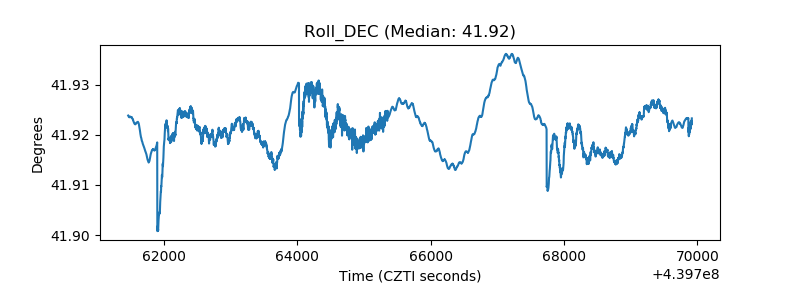 |
| _Roll_RA | 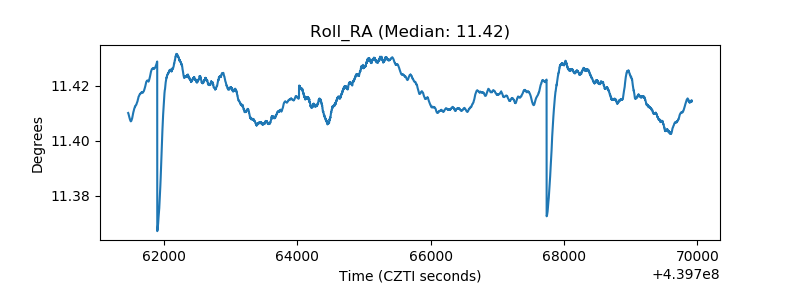 |
| Veto Counter | 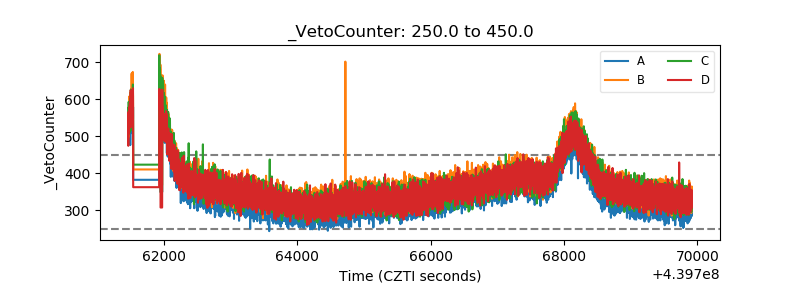 |