| Param | Original file | Final file |
|---|---|---|
| Filename | modeM0/AS1A13_059T01_9000005990_44323cztM0_level2.fits | modeM0/AS1A13_059T01_9000005990_44323cztM0_level2_quad_clean.evt |
| Size (bytes) | 1,212,664,320 | 291,188,160 |
| Size | 1.1 GB | 277.7 MB |
| Events in quadrant A | 12,523,692 | 1,949,704 |
| Events in quadrant B | 9,842,846 | 1,968,753 |
| Events in quadrant C | 8,410,327 | 1,945,132 |
| Events in quadrant D | 12,669,959 | 1,668,018 |
| Mode M0 | |||
|---|---|---|---|
| Quadrant | BADHDUFLAG | Total packets | Discarded packets |
| A | 0 | 52380 | 114 |
| B | 0 | 42100 | 111 |
| C | 0 | 38747 | 86 |
| D | 0 | 50955 | 83 |
| Mode SS | |||
|---|---|---|---|
| Quadrant | BADHDUFLAG | Total packets | Discarded packets |
| A | 0 | 380 | 0 |
| B | 0 | 380 | 0 |
| C | 0 | 380 | 0 |
| D | 0 | 380 | 0 |
| Mode M9 | |||
|---|---|---|---|
| Quadrant | BADHDUFLAG | Total packets | Discarded packets |
| A | 0 | 15 | 0 |
| B | 0 | 16 | 1 |
| C | 0 | 15 | 0 |
| D | 0 | 15 | 0 |
| Quadrant | Total seconds | Saturated seconds | Saturation percentage |
|---|---|---|---|
| A | 18631 | 306 | 1.642424% |
| B | 18629 | 463 | 2.485372% |
| C | 18633 | 90 | 0.483014% |
| D | 18639 | 1232 | 6.609797% |
Noise dominated data is calculated using 1-second bins in cleaned event files. If a bin has >2000 counts, and if more than 50% of those come from <1% of pixels, then it is considered to be noise-dominated and hence unusable.
| Quadrant | # 1 sec bins | Bins with >0 counts | Bins with >2000 counts | High rate bins dominated by noise | Noise dominated (total time) | Noise dominated (detector-on time) | Marked lightcurve |
|---|---|---|---|---|---|---|---|
| A | 20509 | 18643 | 26 | 26 | 0.13% | 0.14% | 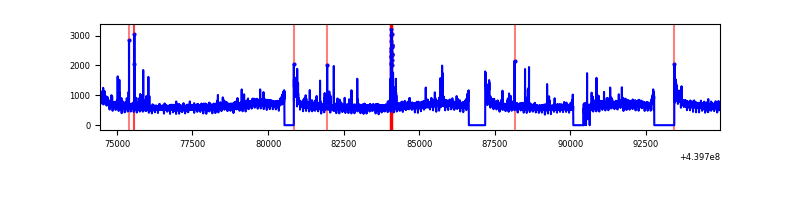 |
| B | 20509 | 18648 | 171 | 171 | 0.83% | 0.92% | 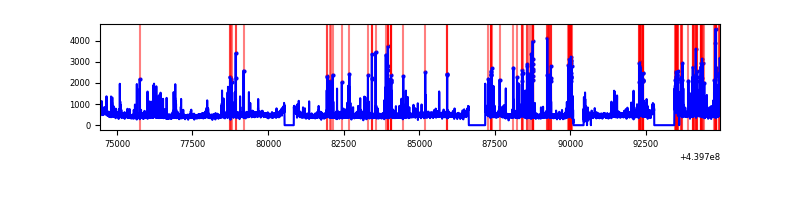 |
| C | 20509 | 18652 | 10 | 10 | 0.05% | 0.05% | 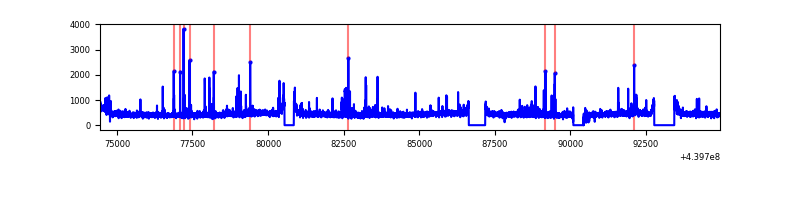 |
| D | 20509 | 18646 | 978 | 978 | 4.77% | 5.25% | 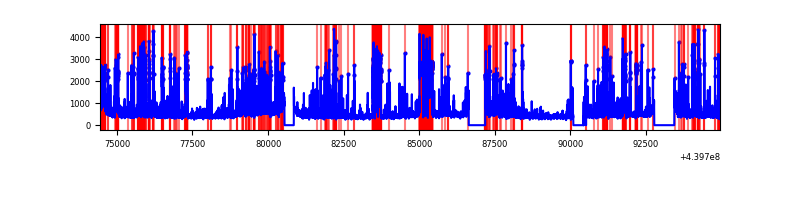 |
Top three noisy pixels from each quadrant. If the there are fewer than three noisy pixels in the level2.evt file, extra rows are filled as -1
| Pixel properties | Quadrant properties | ||||||
|---|---|---|---|---|---|---|---|
| Quadrant | DetID | PixID | Counts | Sigma | Mean | Median | Sigma |
| A | 10 | 83 | 4125860 | 9626.56 | 2085 | 2041 | 428.4 |
| A | 7 | 3 | 187577 | 433.11 | 2085 | 2041 | 428.4 |
| A | 15 | 223 | 59126 | 133.26 | 2085 | 2041 | 428.4 |
| B | 5 | 255 | 900863 | 2194.18 | 2073 | 2006 | 409.7 |
| B | 0 | 219 | 261829 | 634.25 | 2073 | 2006 | 409.7 |
| B | 0 | 190 | 158637 | 382.35 | 2073 | 2006 | 409.7 |
| C | 14 | 254 | 254555 | 519.3 | 2063 | 2077 | 486.2 |
| C | 1 | 3 | 52202 | 103.1 | 2063 | 2077 | 486.2 |
| C | 3 | 233 | 51275 | 101.19 | 2063 | 2077 | 486.2 |
| D | 13 | 249 | 1180973 | 2353.94 | 2003 | 1945 | 500.9 |
| D | 1 | 20 | 847828 | 1688.82 | 2003 | 1945 | 500.9 |
| D | 13 | 138 | 535613 | 1065.47 | 2003 | 1945 | 500.9 |
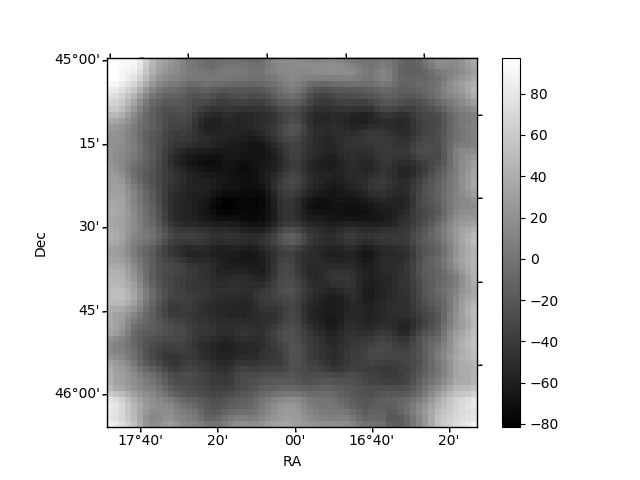
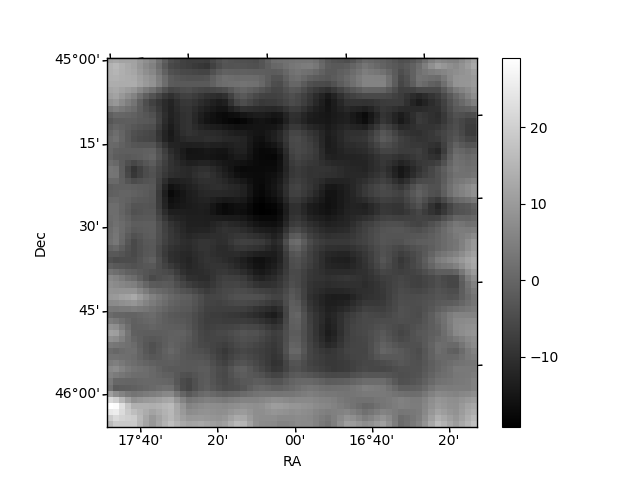
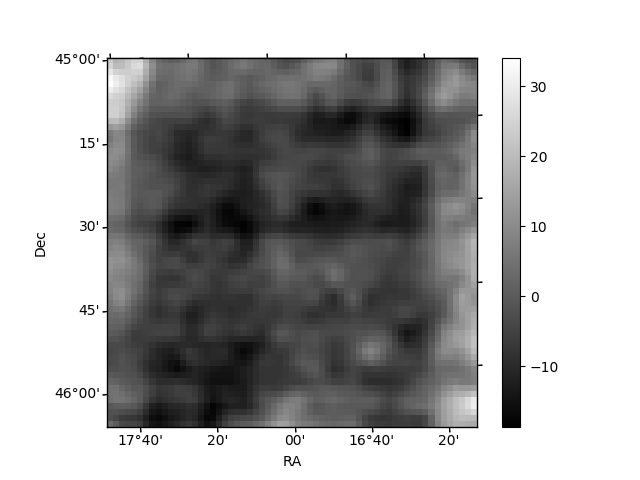
Histogram calculated using DETX and DETY for each event in the final _common_clean file
| Quadrant A | 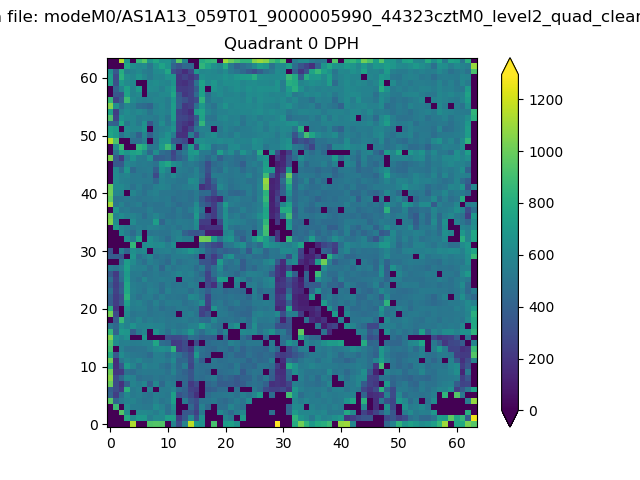 |
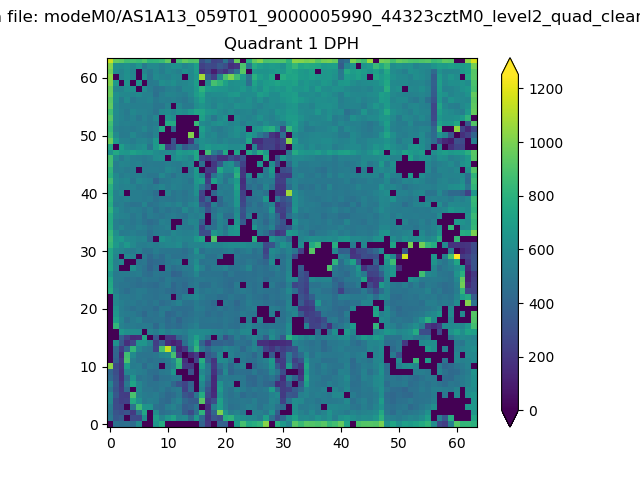 |
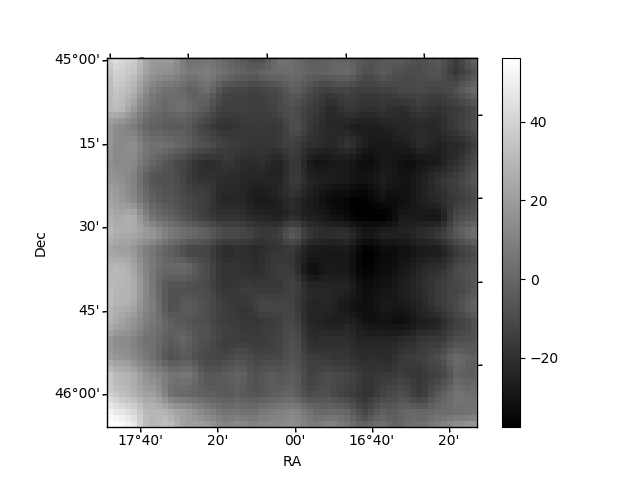
Quadrant B |
|---|---|---|---|
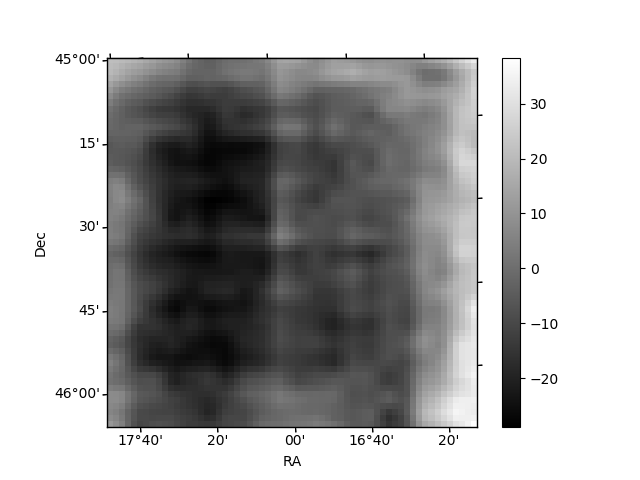
| Quadrant D | 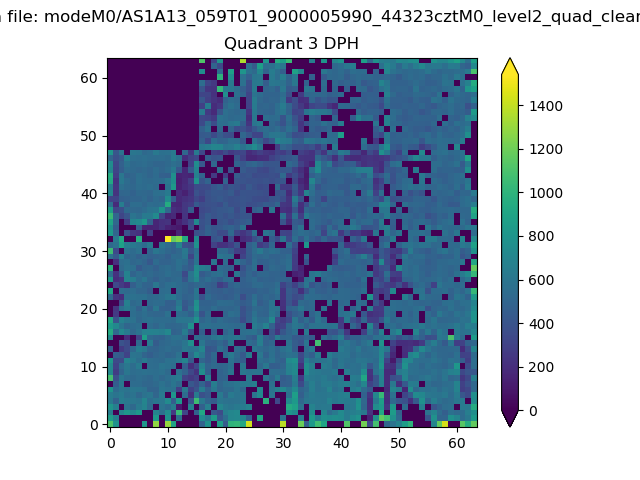 |
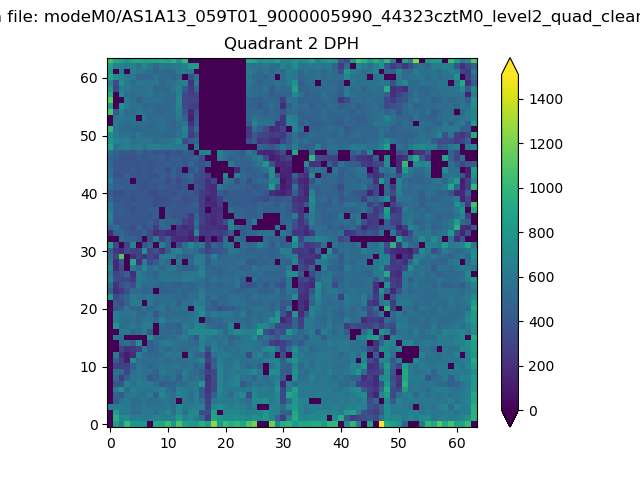 |
Quadrant C |
| Plot type | Count rate plots | Images |
|---|---|---|
| Comparison with Poisson distribution Blue bars denote a histogram of data divided into 1 sec bins. Red curve is a Poisson curve with rate = median count rate of data. |
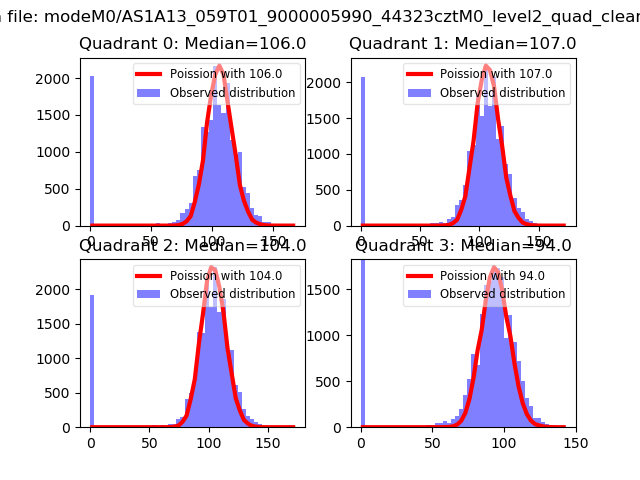 |
 |
| Quadrant-wise count rates Data is divided into 100 sec bins |
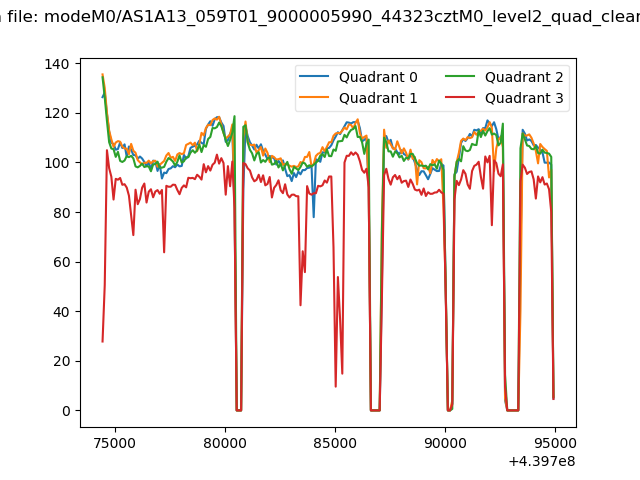 |
|
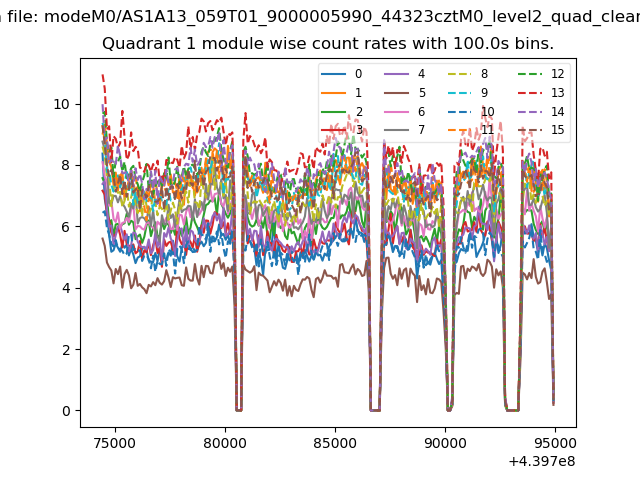
| Module-wise count rates for Quadrant A Data is divided into 100 sec bins |
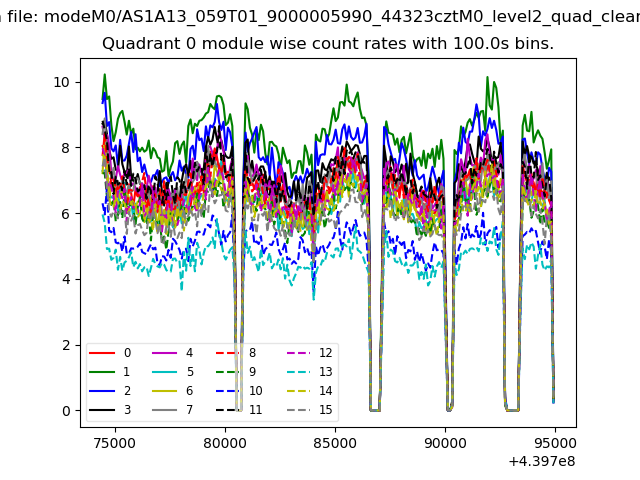 |
 |
| Module-wise count rates for Quadrant B Data is divided into 100 sec bins |
 |
 |
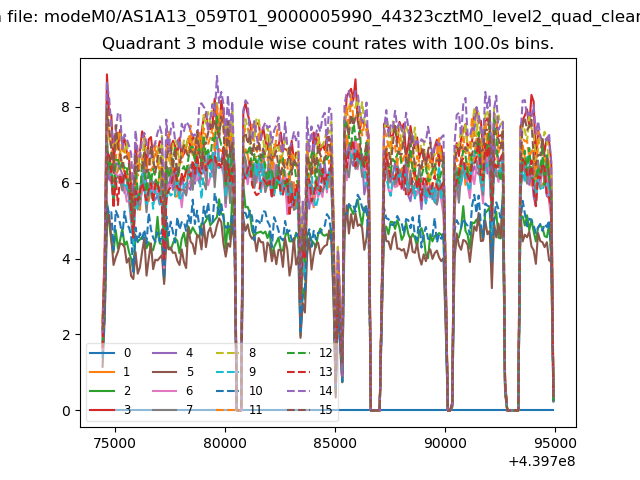
| Module-wise count rates for Quadrant C Data is divided into 100 sec bins |
 |
 |
| Module-wise count rates for Quadrant D Data is divided into 100 sec bins |
 |
 |
| Parameter | Plot |
|---|---|
| CZT HV Monitor | 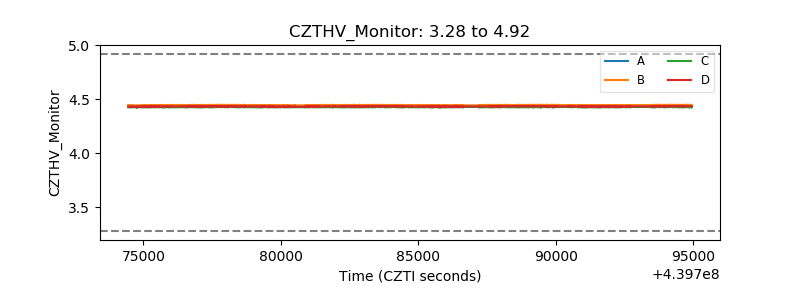 |
| D_VDD |  |
| Temperature 1 | 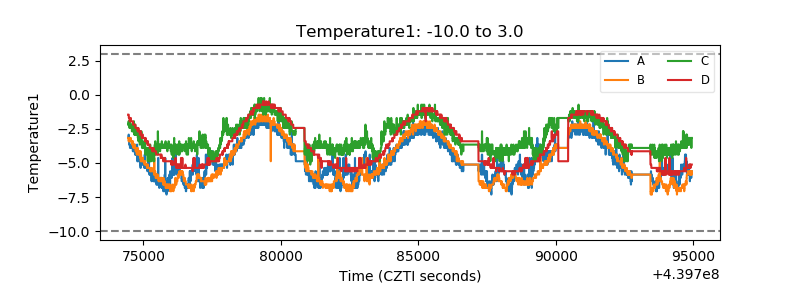 |
| Veto HV Monitor | 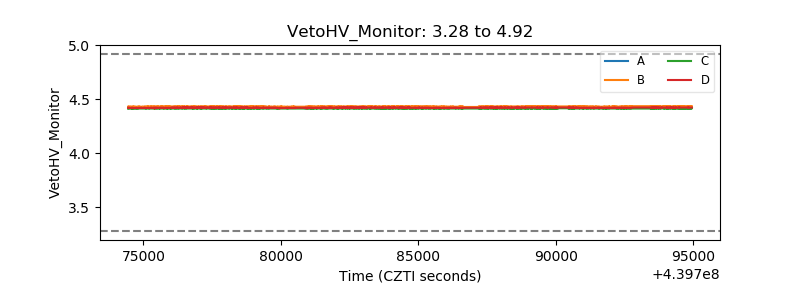 |
| Veto LLD | 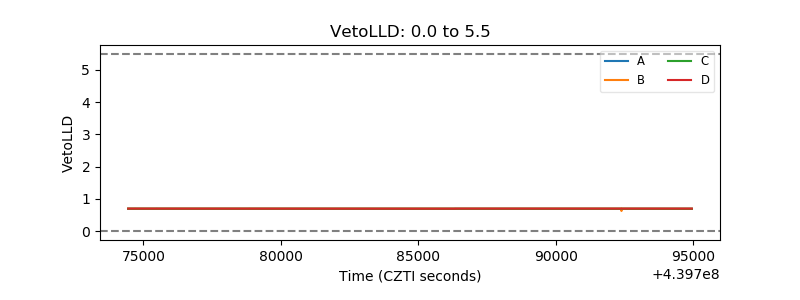 |
| Alpha Counter | 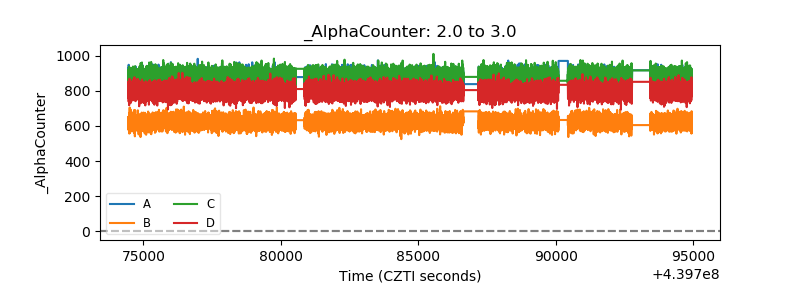 |
| _CPM_Rate | 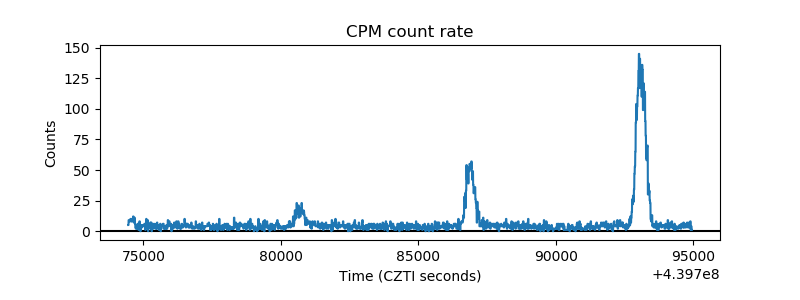 |
| CZT Counter | 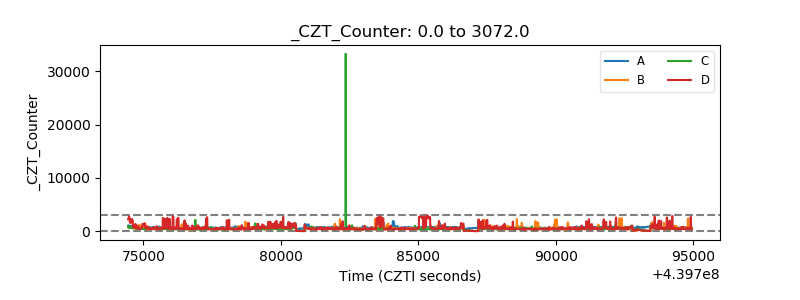 |
| +2.5 Volts monitor | 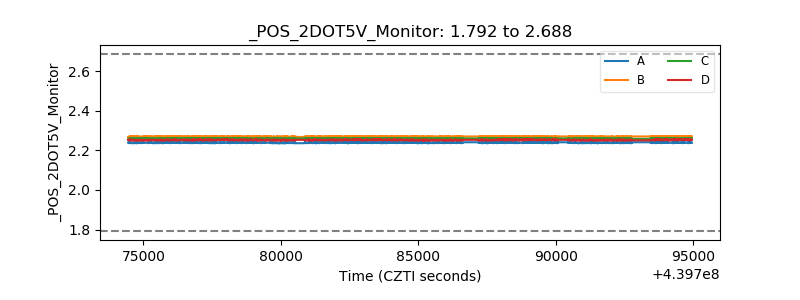 |
| +5 Volts monitor | 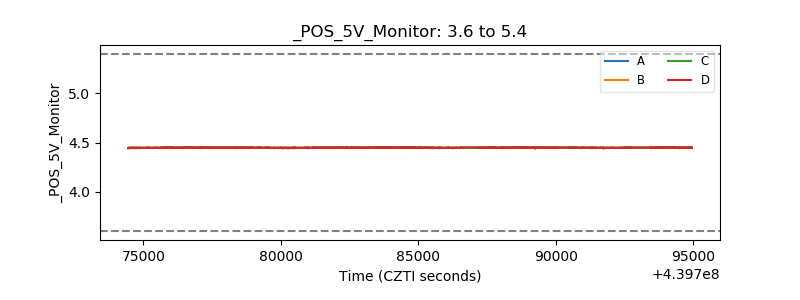 |
| _ROLL_ROT | 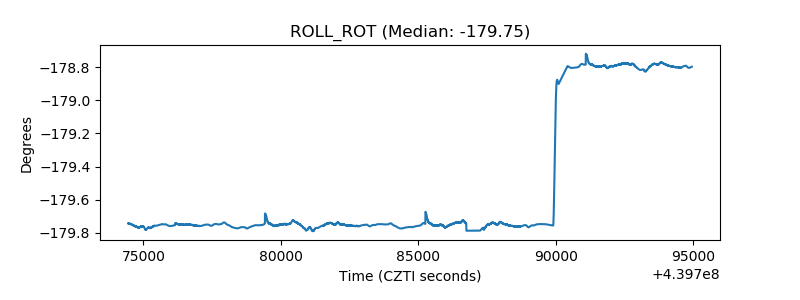 |
| _Roll_DEC | 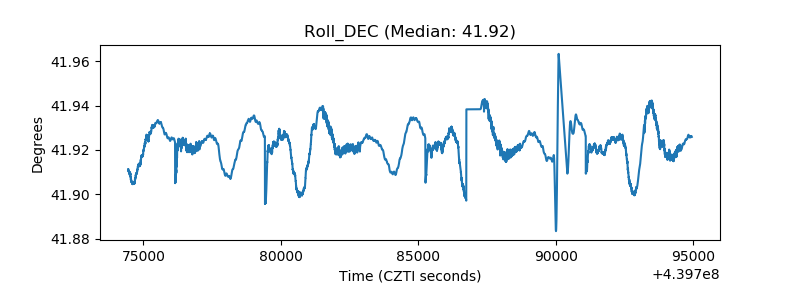 |
| _Roll_RA | 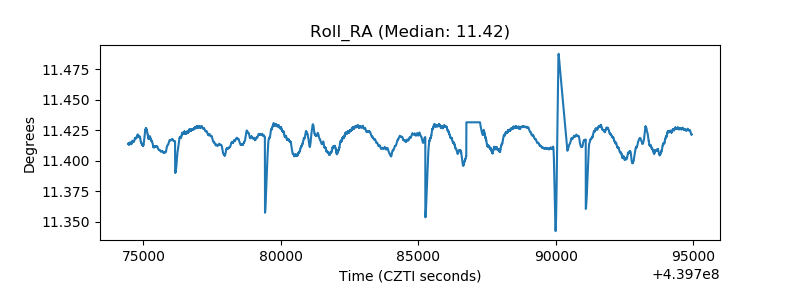 |
| Veto Counter | 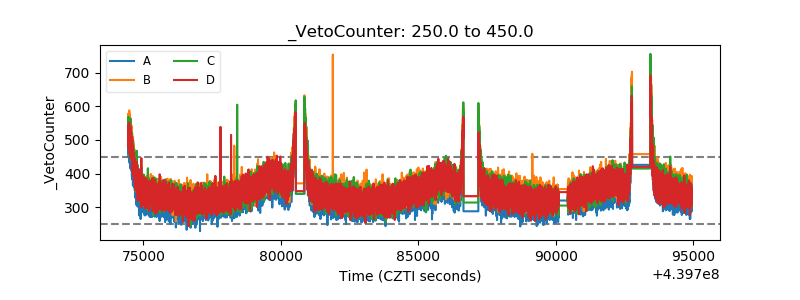 |