| Param | Original file | Final file |
|---|---|---|
| Filename | modeM0/AS1A13_059T01_9000005990_44324cztM0_level2.fits | modeM0/AS1A13_059T01_9000005990_44324cztM0_level2_quad_clean.evt |
| Size (bytes) | 442,281,600 | 109,019,520 |
| Size | 421.8 MB | 104.0 MB |
| Events in quadrant A | 4,659,928 | 721,064 |
| Events in quadrant B | 3,906,294 | 736,395 |
| Events in quadrant C | 3,021,994 | 721,427 |
| Events in quadrant D | 4,251,946 | 645,484 |
| Mode M0 | |||
|---|---|---|---|
| Quadrant | BADHDUFLAG | Total packets | Discarded packets |
| A | 0 | 19516 | 1 |
| B | 0 | 16101 | 1 |
| C | 0 | 13962 | 1 |
| D | 0 | 17463 | 1 |
| Mode SS | |||
|---|---|---|---|
| Quadrant | BADHDUFLAG | Total packets | Discarded packets |
| A | 0 | 138 | 0 |
| B | 0 | 138 | 0 |
| C | 0 | 138 | 0 |
| D | 0 | 138 | 0 |
| Mode M9 | |||
|---|---|---|---|
| Quadrant | BADHDUFLAG | Total packets | Discarded packets |
| A | 0 | 8 | 0 |
| B | 0 | 8 | 0 |
| C | 0 | 8 | 0 |
| D | 0 | 8 | 0 |
| Quadrant | Total seconds | Saturated seconds | Saturation percentage |
|---|---|---|---|
| A | 6838 | 130 | 1.901141% |
| B | 6838 | 242 | 3.539047% |
| C | 6839 | 57 | 0.833455% |
| D | 6839 | 309 | 4.518204% |
Noise dominated data is calculated using 1-second bins in cleaned event files. If a bin has >2000 counts, and if more than 50% of those come from <1% of pixels, then it is considered to be noise-dominated and hence unusable.
| Quadrant | # 1 sec bins | Bins with >0 counts | Bins with >2000 counts | High rate bins dominated by noise | Noise dominated (total time) | Noise dominated (detector-on time) | Marked lightcurve |
|---|---|---|---|---|---|---|---|
| A | 7668 | 6838 | 10 | 10 | 0.13% | 0.15% | 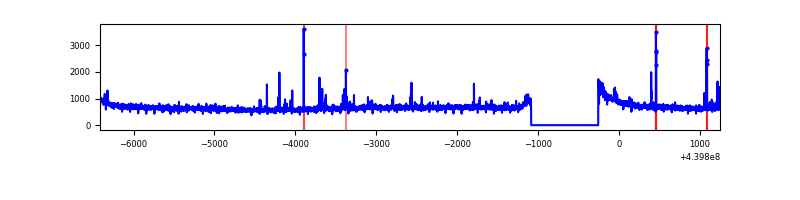 |
| B | 7668 | 6838 | 95 | 95 | 1.24% | 1.39% | 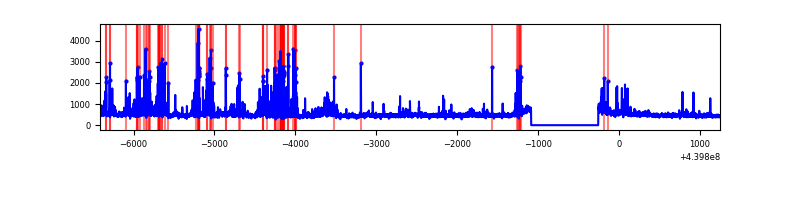 |
| C | 7669 | 6839 | 1 | 1 | 0.01% | 0.01% | 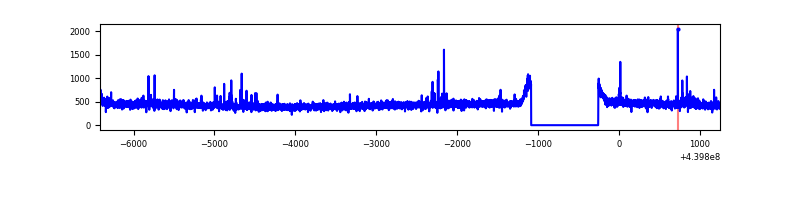 |
| D | 7669 | 6839 | 206 | 206 | 2.69% | 3.01% | 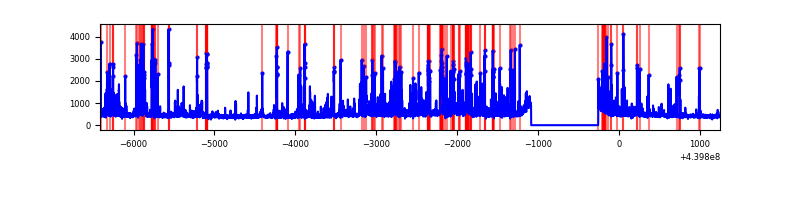 |
Top three noisy pixels from each quadrant. If the there are fewer than three noisy pixels in the level2.evt file, extra rows are filled as -1
| Pixel properties | Quadrant properties | ||||||
|---|---|---|---|---|---|---|---|
| Quadrant | DetID | PixID | Counts | Sigma | Mean | Median | Sigma |
| A | 10 | 83 | 1546327 | 9685.31 | 768 | 751 | 159.6 |
| A | 7 | 3 | 82507 | 512.32 | 768 | 751 | 159.6 |
| A | 4 | 0 | 21253 | 128.48 | 768 | 751 | 159.6 |
| B | 5 | 255 | 550516 | 3597.54 | 763 | 738 | 152.8 |
| B | 0 | 219 | 150172 | 977.84 | 763 | 738 | 152.8 |
| B | 0 | 190 | 76312 | 494.53 | 763 | 738 | 152.8 |
| C | 14 | 254 | 43296 | 237.13 | 760 | 763 | 179.4 |
| C | 1 | 3 | 10659 | 55.17 | 760 | 763 | 179.4 |
| C | 3 | 233 | 7690 | 38.62 | 760 | 763 | 179.4 |
| D | 2 | 153 | 619397 | 3296.29 | 747 | 724 | 187.7 |
| D | 13 | 249 | 412245 | 2192.58 | 747 | 724 | 187.7 |
| D | 2 | 249 | 76392 | 403.16 | 747 | 724 | 187.7 |
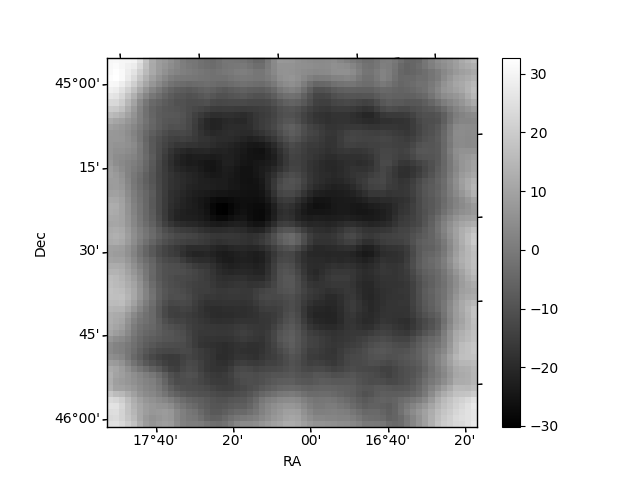
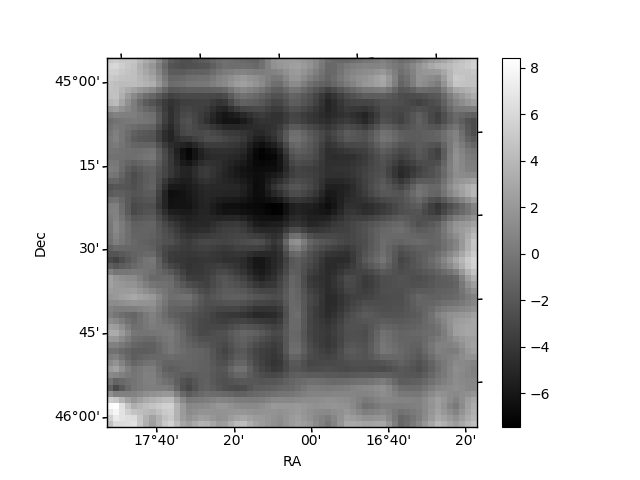
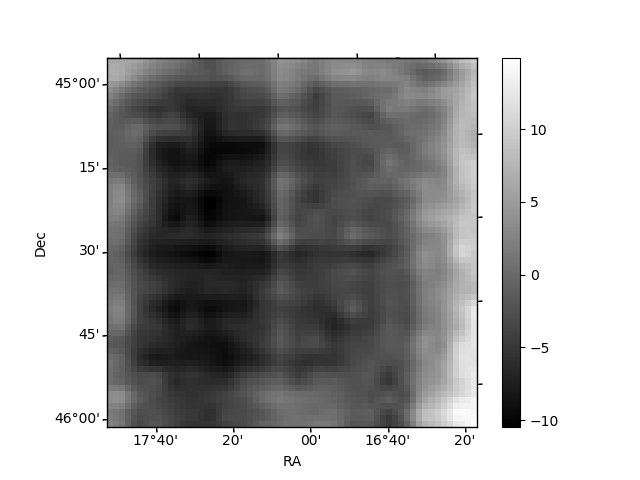
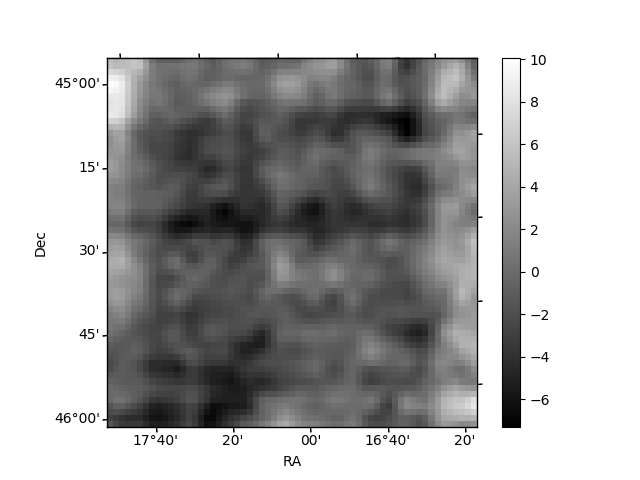
Histogram calculated using DETX and DETY for each event in the final _common_clean file
| Quadrant A | 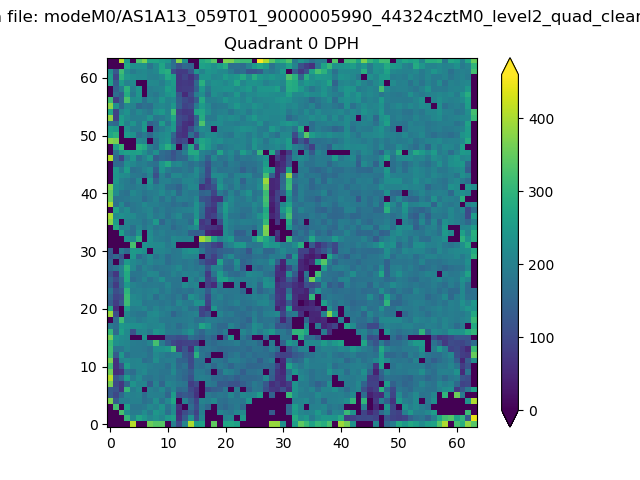 |
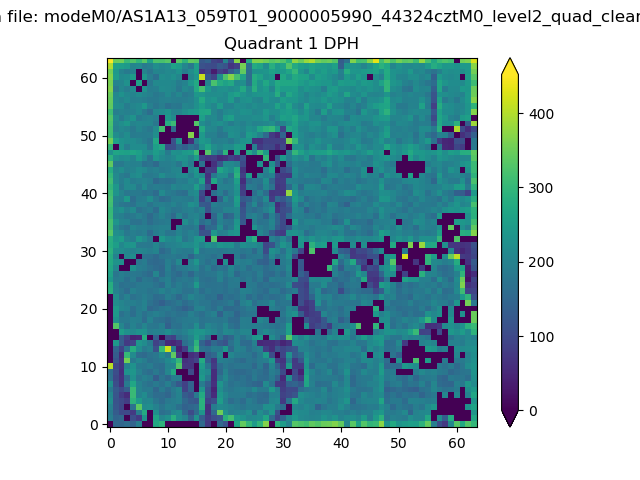 |
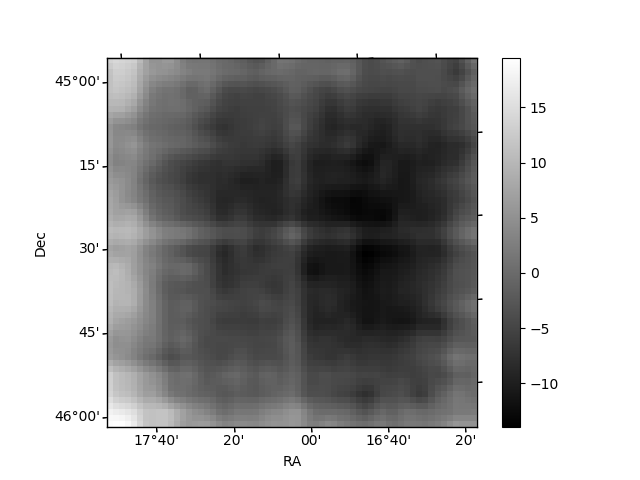
Quadrant B |
|---|---|---|---|
| Quadrant D | 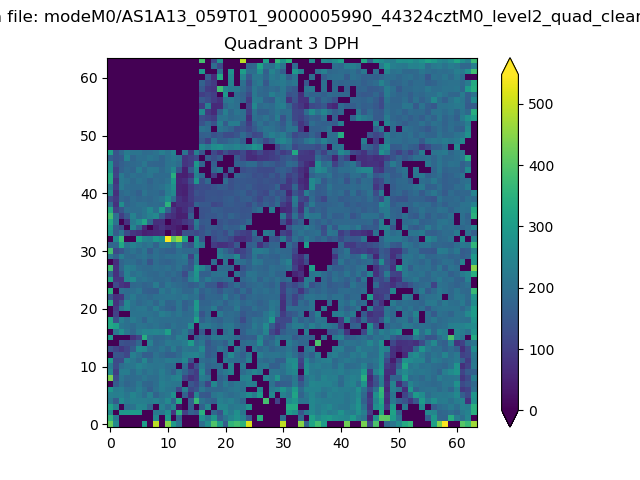 |
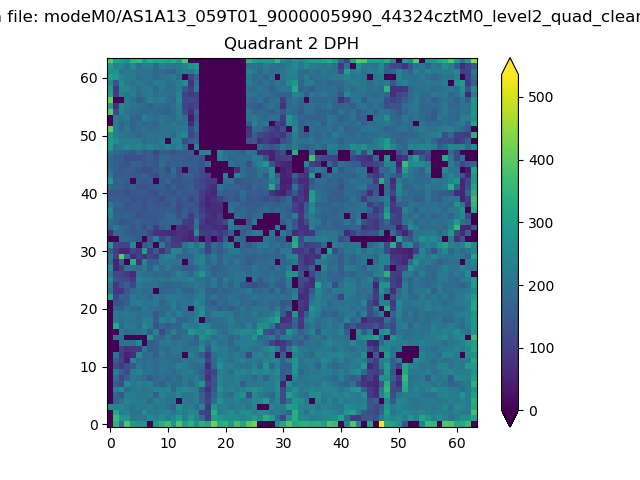 |
Quadrant C |
| Plot type | Count rate plots | Images |
|---|---|---|
| Comparison with Poisson distribution Blue bars denote a histogram of data divided into 1 sec bins. Red curve is a Poisson curve with rate = median count rate of data. |
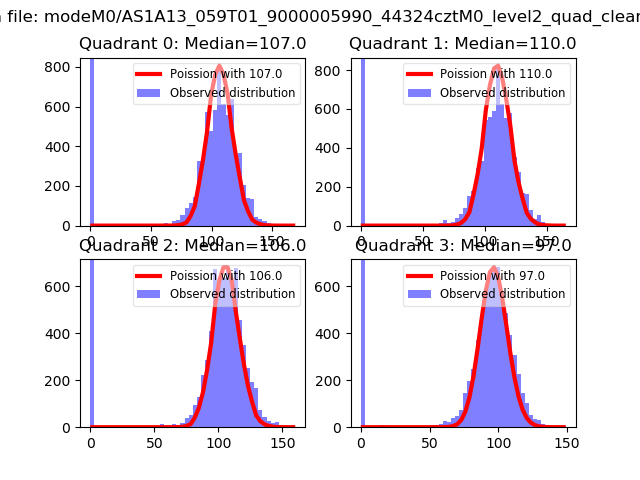 |
 |
| Quadrant-wise count rates Data is divided into 100 sec bins |
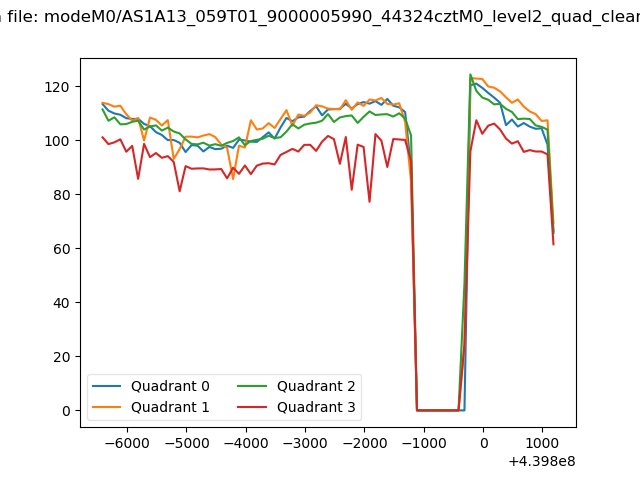 |
|
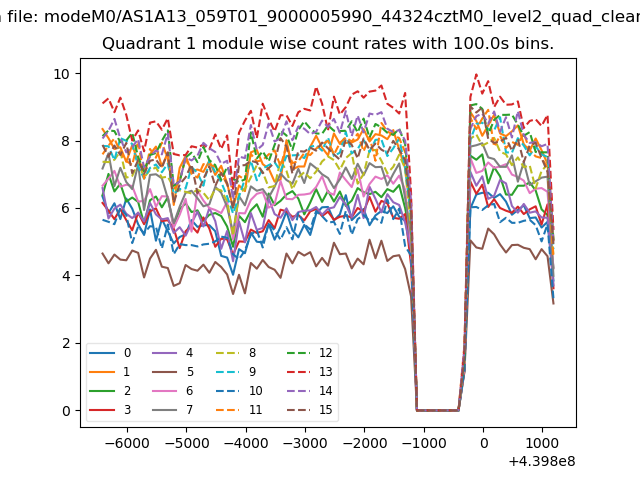
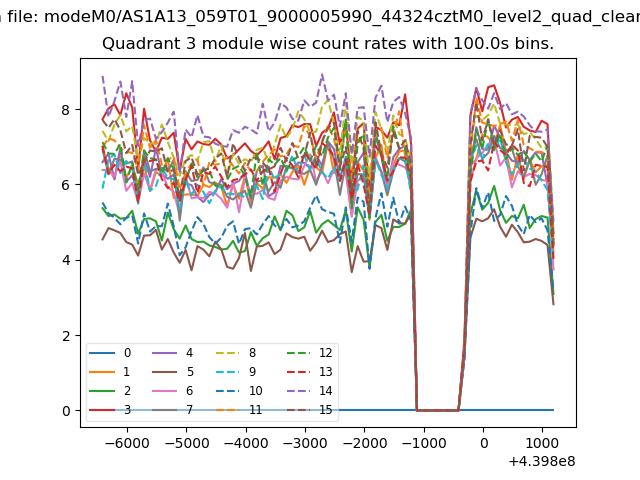
| Module-wise count rates for Quadrant A Data is divided into 100 sec bins |
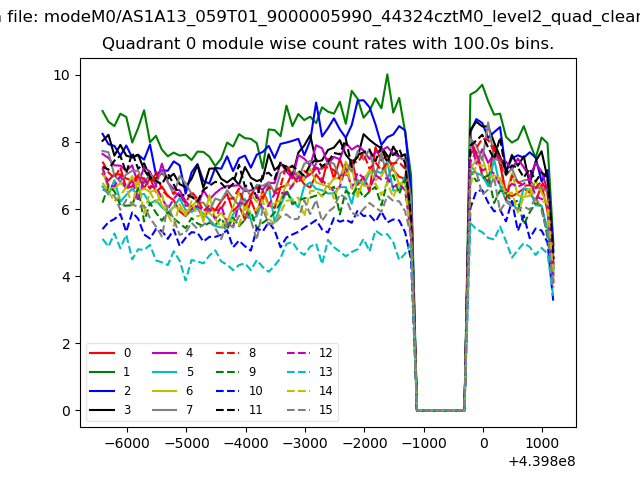 |
 |
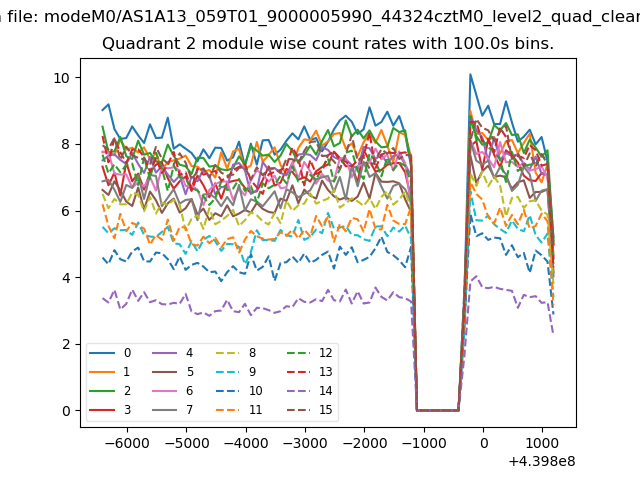
| Module-wise count rates for Quadrant B Data is divided into 100 sec bins |
 |
 |
| Module-wise count rates for Quadrant C Data is divided into 100 sec bins |
 |
 |
| Module-wise count rates for Quadrant D Data is divided into 100 sec bins |
 |
 |
| Parameter | Plot |
|---|---|
| CZT HV Monitor | 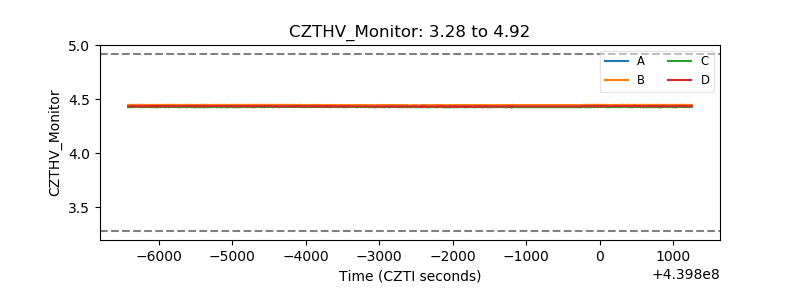 |
| D_VDD | 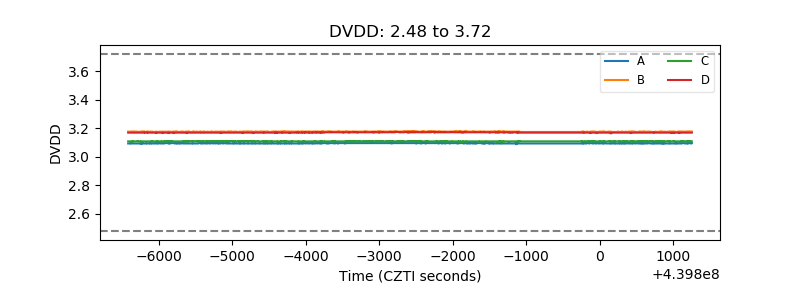 |
| Temperature 1 | 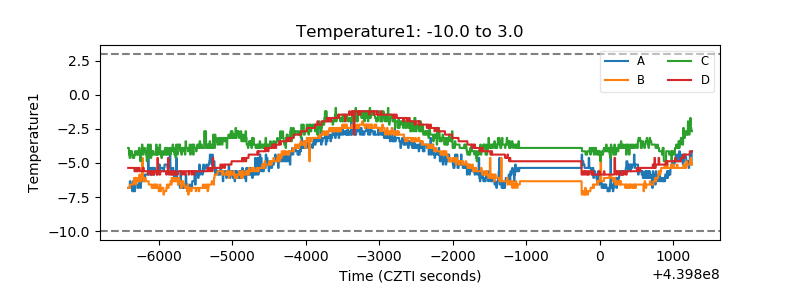 |
| Veto HV Monitor | 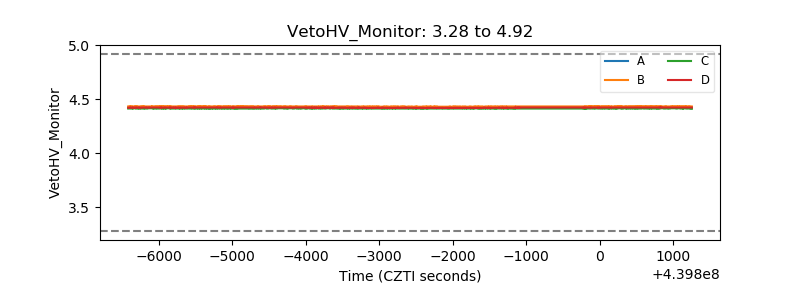 |
| Veto LLD | 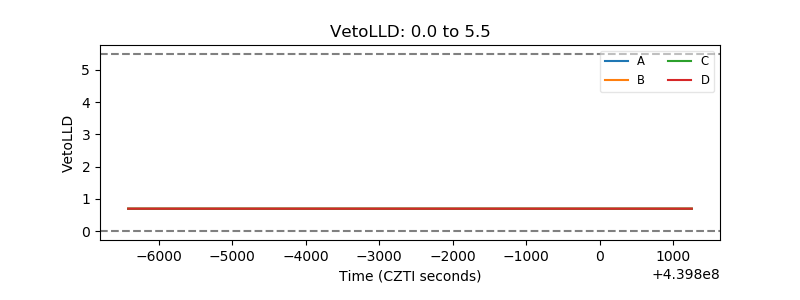 |
| Alpha Counter | 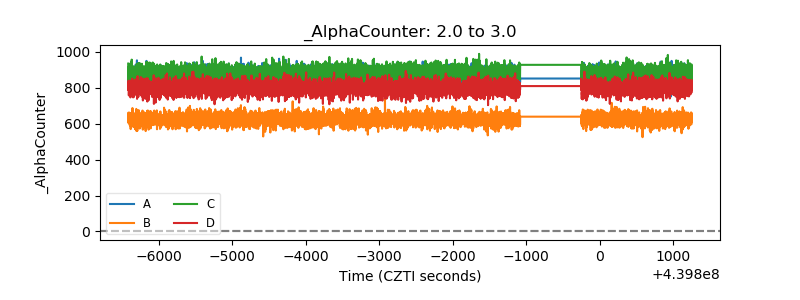 |
| _CPM_Rate | 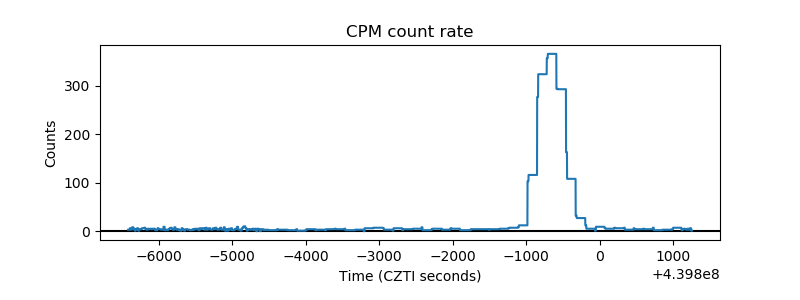 |
| CZT Counter | 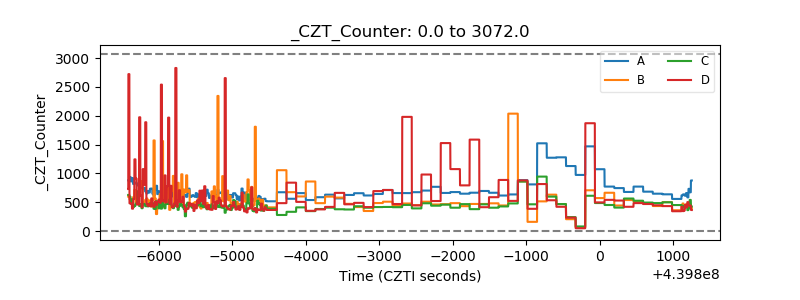 |
| +2.5 Volts monitor | 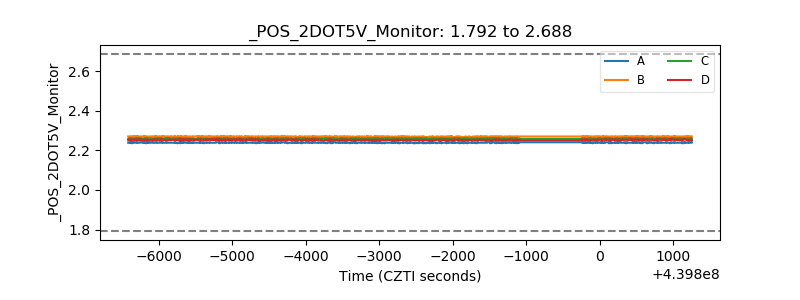 |
| +5 Volts monitor | 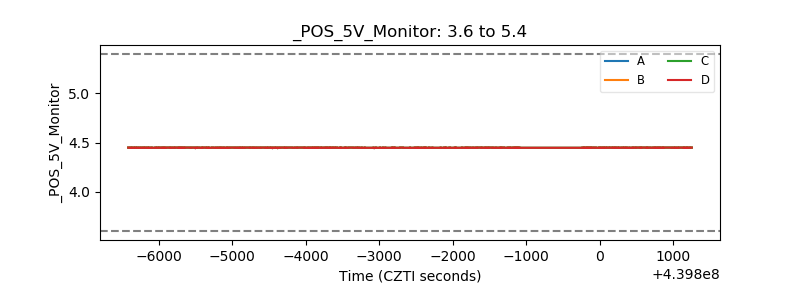 |
| _ROLL_ROT | 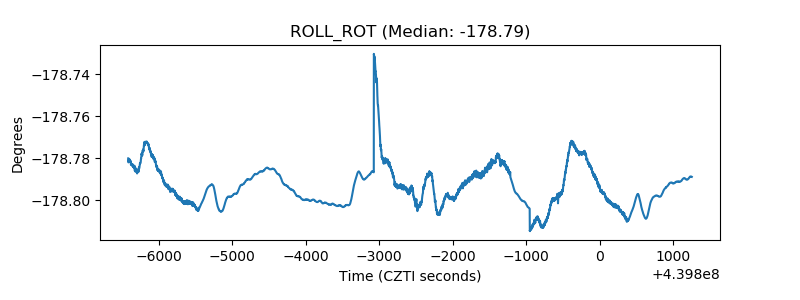 |
| _Roll_DEC | 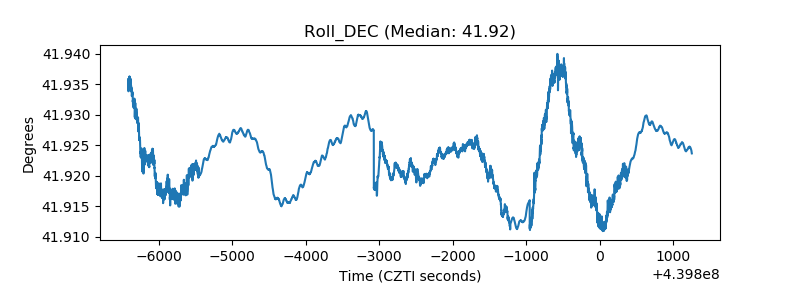 |
| _Roll_RA | 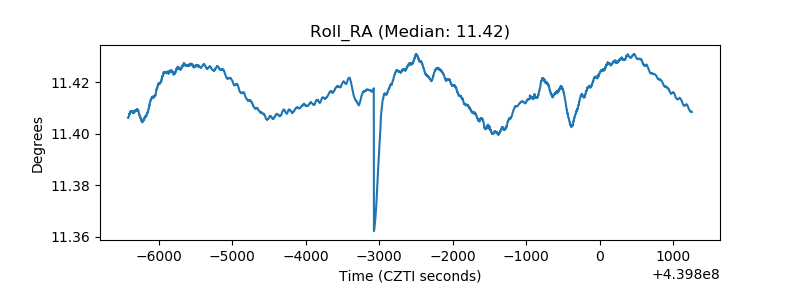 |
| Veto Counter | 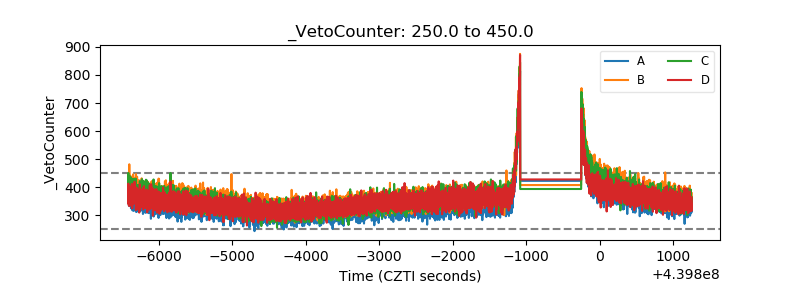 |