| Param | Original file | Final file |
|---|---|---|
| Filename | modeM0/AS1A13_059T01_9000005990_44326cztM0_level2.fits | modeM0/AS1A13_059T01_9000005990_44326cztM0_level2_quad_clean.evt |
| Size (bytes) | 504,895,680 | 119,600,640 |
| Size | 481.5 MB | 114.1 MB |
| Events in quadrant A | 5,368,280 | 798,505 |
| Events in quadrant B | 4,099,524 | 817,151 |
| Events in quadrant C | 3,380,752 | 797,513 |
| Events in quadrant D | 5,269,722 | 696,387 |
| Mode M0 | |||
|---|---|---|---|
| Quadrant | BADHDUFLAG | Total packets | Discarded packets |
| A | 0 | 22272 | 2 |
| B | 0 | 17089 | 2 |
| C | 0 | 15263 | 2 |
| D | 0 | 20703 | 2 |
| Mode SS | |||
|---|---|---|---|
| Quadrant | BADHDUFLAG | Total packets | Discarded packets |
| A | 0 | 150 | 0 |
| B | 0 | 150 | 0 |
| C | 0 | 150 | 0 |
| D | 0 | 150 | 0 |
| Mode M9 | |||
|---|---|---|---|
| Quadrant | BADHDUFLAG | Total packets | Discarded packets |
| A | 0 | 18 | 0 |
| B | 0 | 18 | 0 |
| C | 0 | 18 | 0 |
| D | 0 | 18 | 0 |
| Quadrant | Total seconds | Saturated seconds | Saturation percentage |
|---|---|---|---|
| A | 7355 | 251 | 3.412644% |
| B | 7355 | 307 | 4.174031% |
| C | 7355 | 97 | 1.318831% |
| D | 7355 | 592 | 8.048946% |
Noise dominated data is calculated using 1-second bins in cleaned event files. If a bin has >2000 counts, and if more than 50% of those come from <1% of pixels, then it is considered to be noise-dominated and hence unusable.
| Quadrant | # 1 sec bins | Bins with >0 counts | Bins with >2000 counts | High rate bins dominated by noise | Noise dominated (total time) | Noise dominated (detector-on time) | Marked lightcurve |
|---|---|---|---|---|---|---|---|
| A | 9175 | 7355 | 26 | 26 | 0.28% | 0.35% | 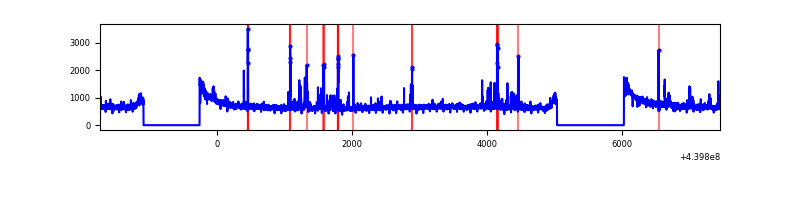 |
| B | 9175 | 7355 | 73 | 73 | 0.80% | 0.99% | 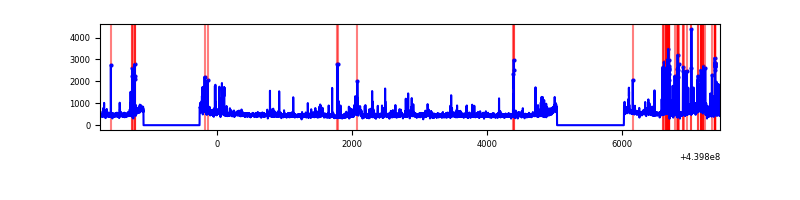 |
| C | 9175 | 7356 | 4 | 4 | 0.04% | 0.05% | 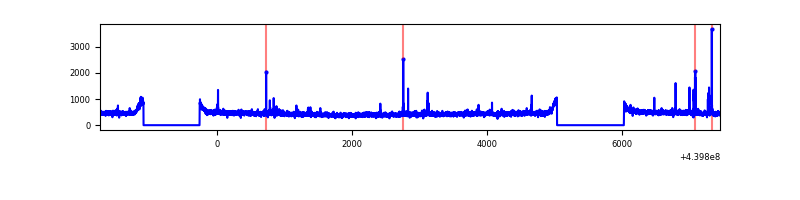 |
| D | 9175 | 7355 | 420 | 420 | 4.58% | 5.71% | 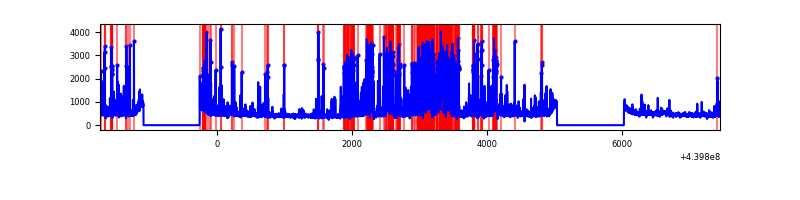 |
Top three noisy pixels from each quadrant. If the there are fewer than three noisy pixels in the level2.evt file, extra rows are filled as -1
| Pixel properties | Quadrant properties | ||||||
|---|---|---|---|---|---|---|---|
| Quadrant | DetID | PixID | Counts | Sigma | Mean | Median | Sigma |
| A | 10 | 83 | 1767071 | 9988.5 | 854 | 837 | 176.8 |
| A | 7 | 3 | 157207 | 884.31 | 854 | 837 | 176.8 |
| A | 10 | 248 | 75224 | 420.68 | 854 | 837 | 176.8 |
| B | 5 | 255 | 393003 | 2328.89 | 849 | 823 | 168.4 |
| B | 0 | 219 | 146823 | 866.99 | 849 | 823 | 168.4 |
| B | 0 | 190 | 61521 | 360.44 | 849 | 823 | 168.4 |
| C | 14 | 254 | 78493 | 388.98 | 843 | 846 | 199.6 |
| C | 1 | 3 | 12327 | 57.52 | 843 | 846 | 199.6 |
| C | 3 | 233 | 7254 | 32.1 | 843 | 846 | 199.6 |
| D | 13 | 249 | 1307243 | 6277.33 | 822 | 796 | 208.1 |
| D | 2 | 153 | 314838 | 1508.94 | 822 | 796 | 208.1 |
| D | 12 | 233 | 100807 | 480.54 | 822 | 796 | 208.1 |
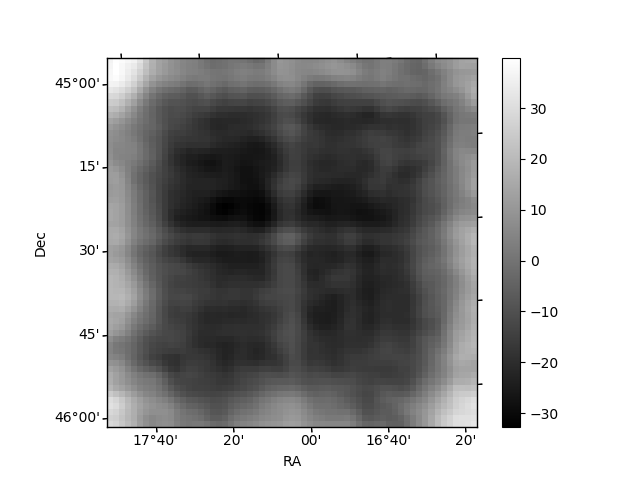
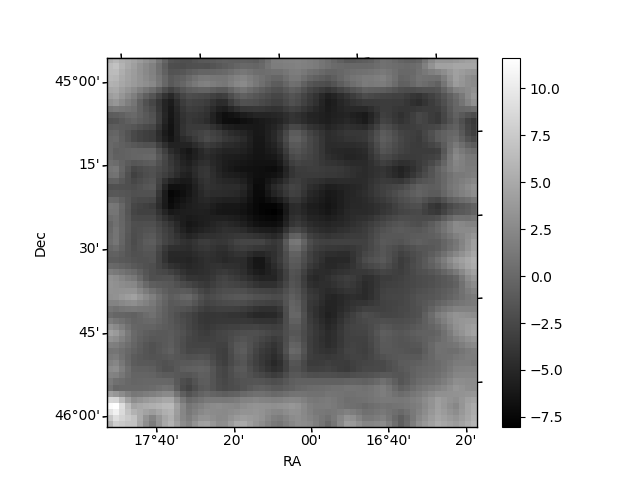
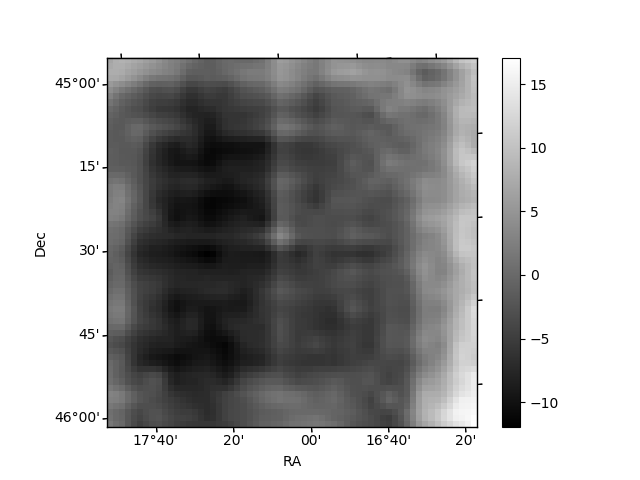
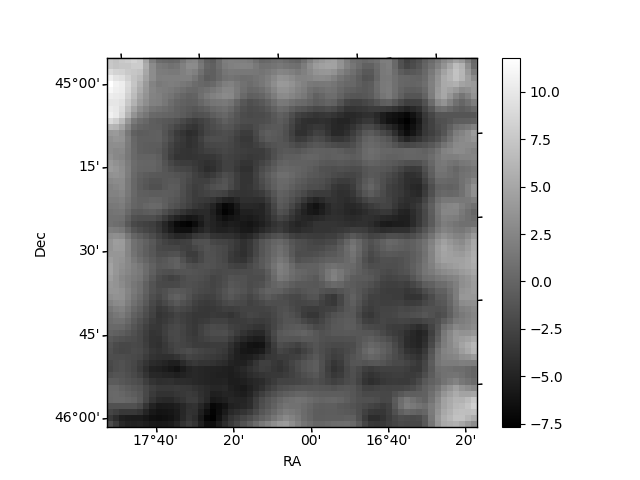
Histogram calculated using DETX and DETY for each event in the final _common_clean file
| Quadrant A | 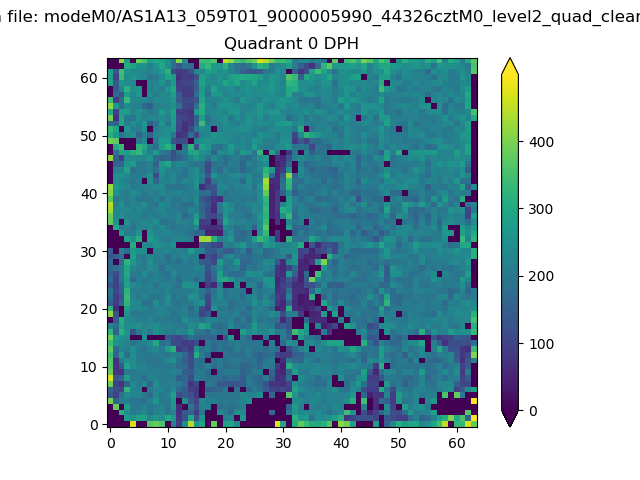 |
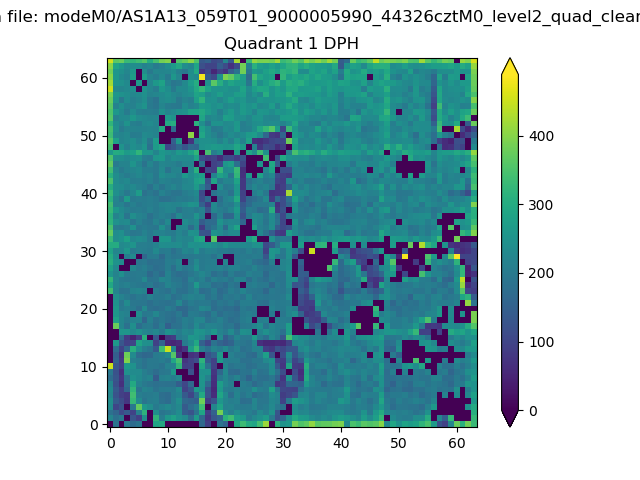 |
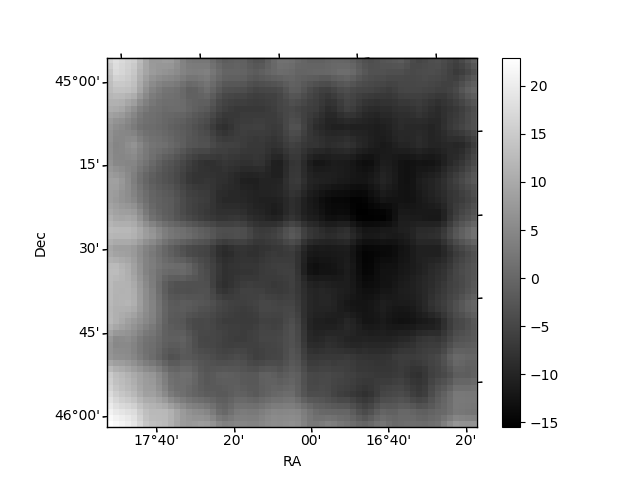
Quadrant B |
|---|---|---|---|
| Quadrant D | 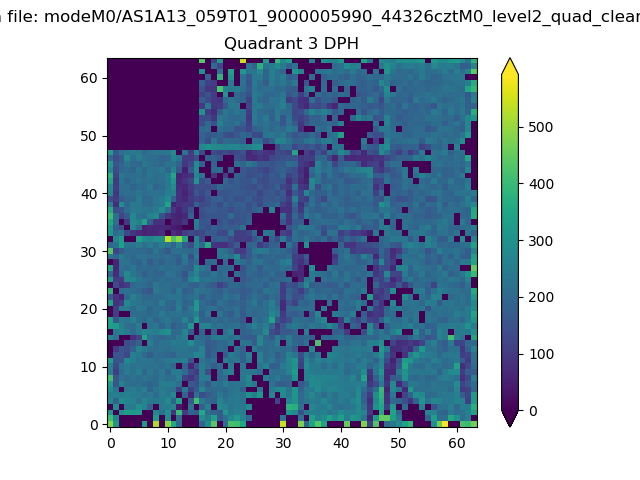 |
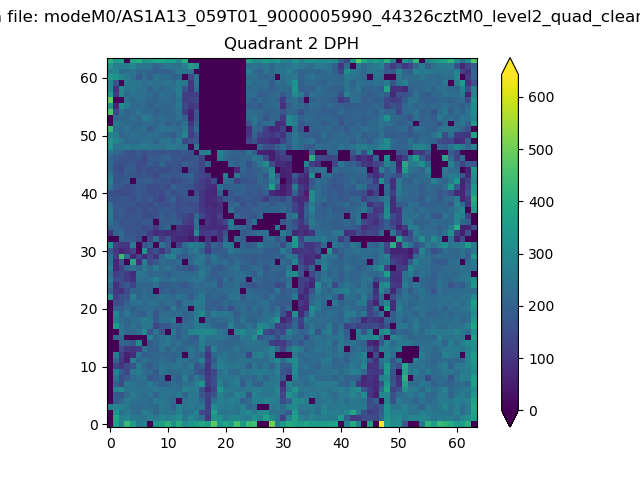 |
Quadrant C |
| Plot type | Count rate plots | Images |
|---|---|---|
| Comparison with Poisson distribution Blue bars denote a histogram of data divided into 1 sec bins. Red curve is a Poisson curve with rate = median count rate of data. |
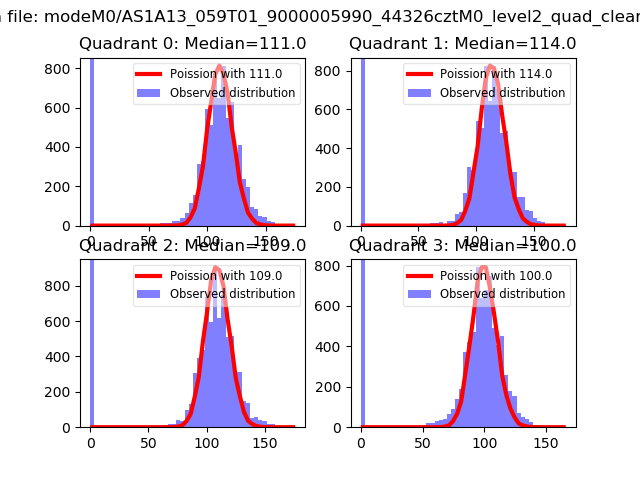 |
 |
| Quadrant-wise count rates Data is divided into 100 sec bins |
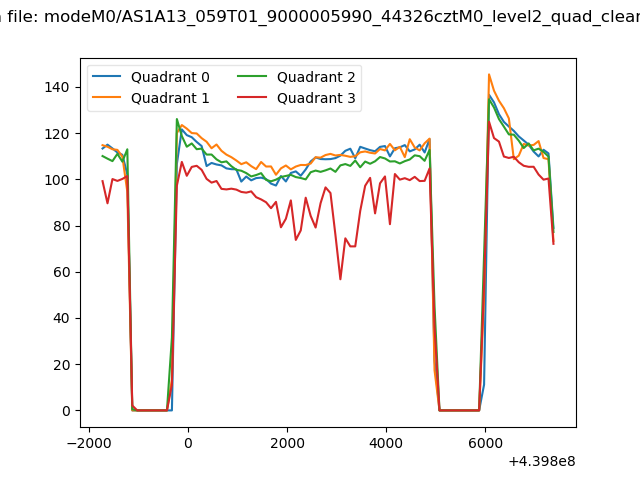 |
|
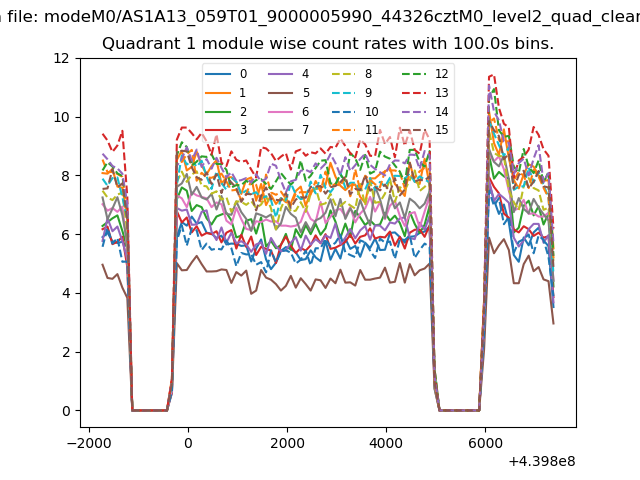
| Module-wise count rates for Quadrant A Data is divided into 100 sec bins |
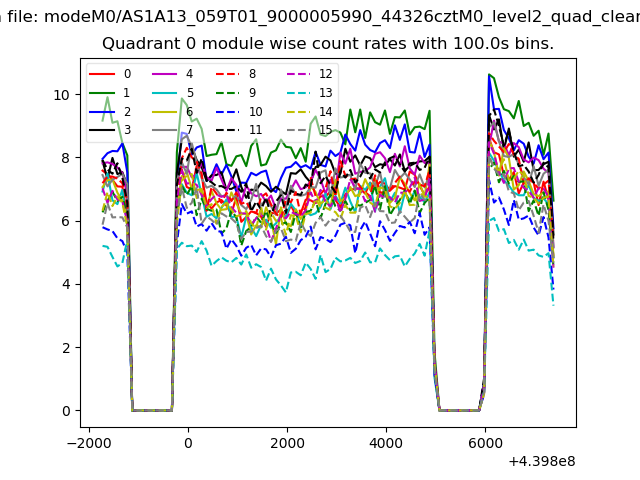 |
 |
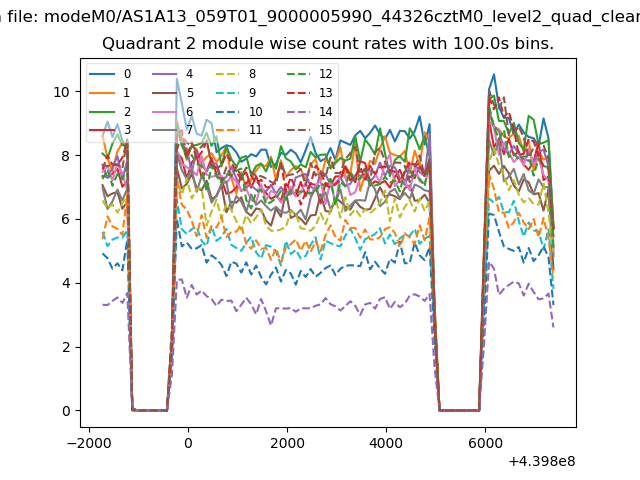
| Module-wise count rates for Quadrant B Data is divided into 100 sec bins |
 |
 |
| Module-wise count rates for Quadrant C Data is divided into 100 sec bins |
 |
 |
| Module-wise count rates for Quadrant D Data is divided into 100 sec bins |
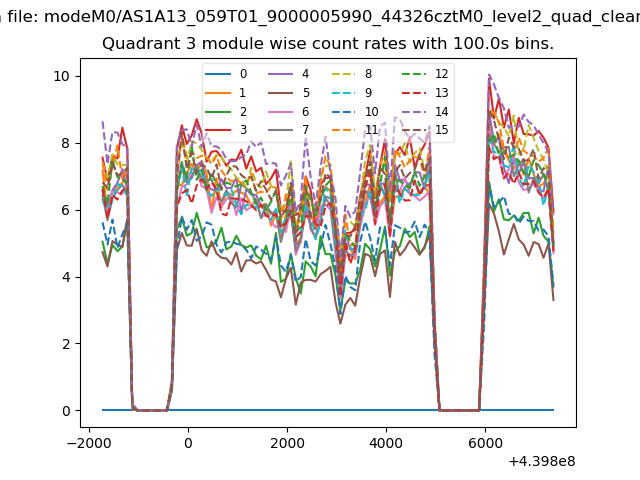 |
 |
| Parameter | Plot |
|---|---|
| CZT HV Monitor | 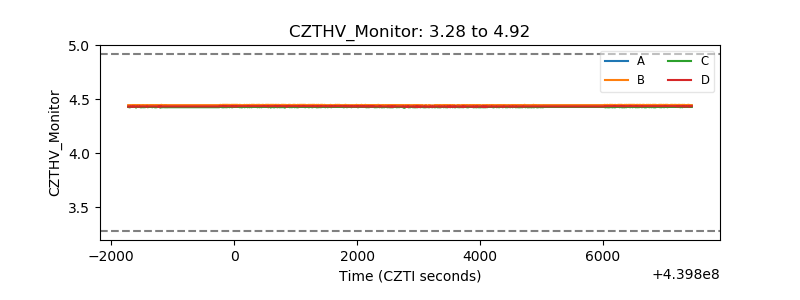 |
| D_VDD | 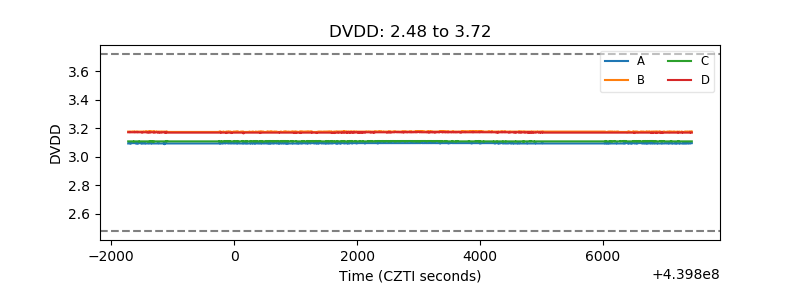 |
| Temperature 1 | 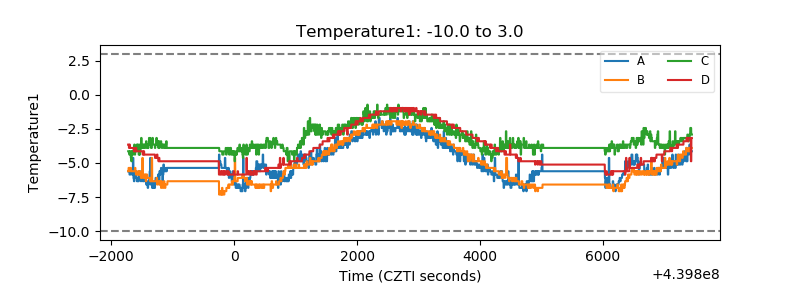 |
| Veto HV Monitor | 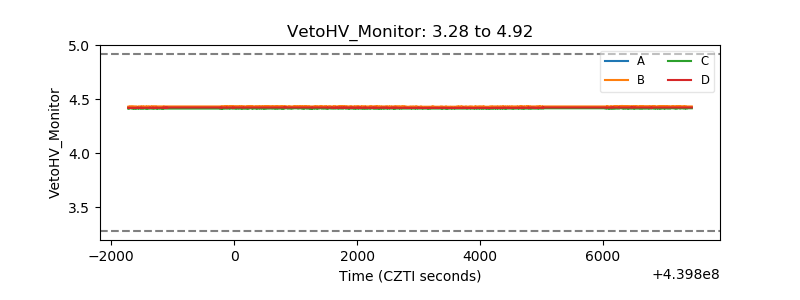 |
| Veto LLD | 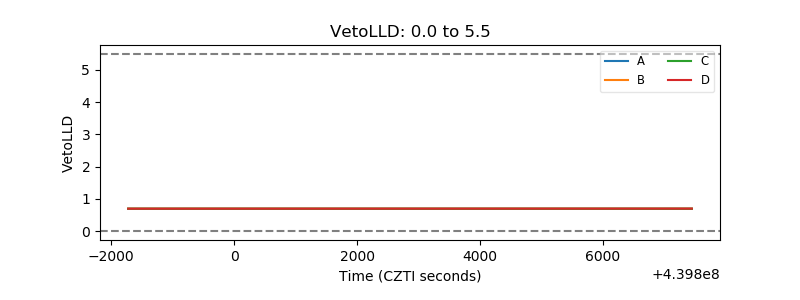 |
| Alpha Counter | 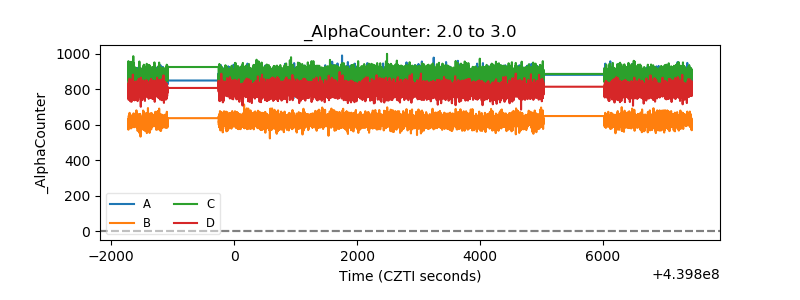 |
| _CPM_Rate | 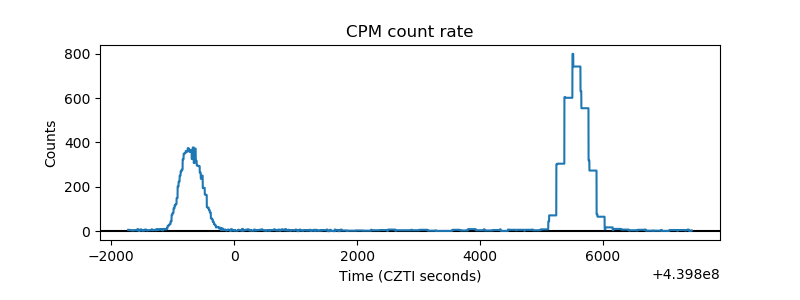 |
| CZT Counter | 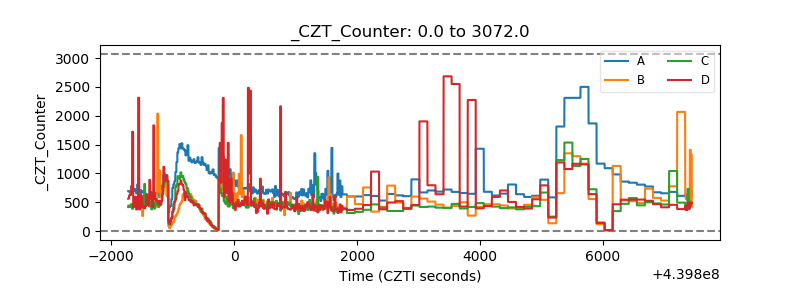 |
| +2.5 Volts monitor | 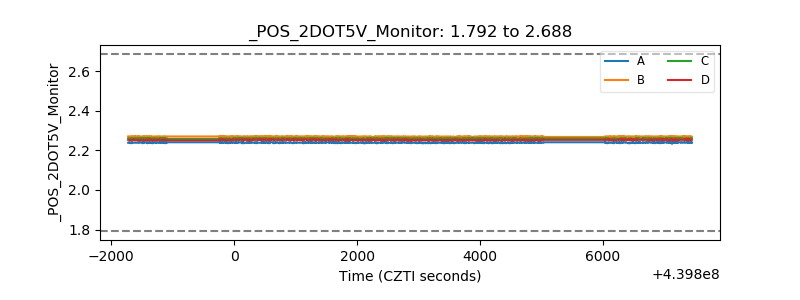 |
| +5 Volts monitor | 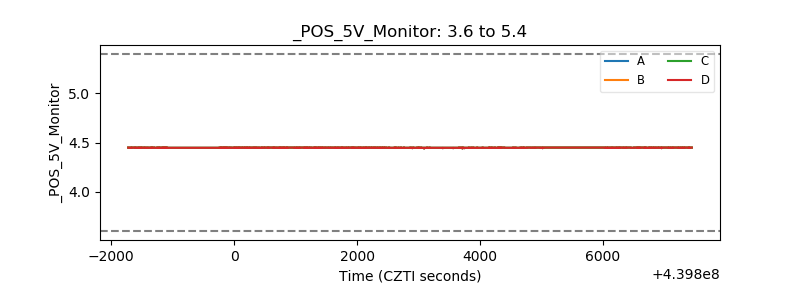 |
| _ROLL_ROT | 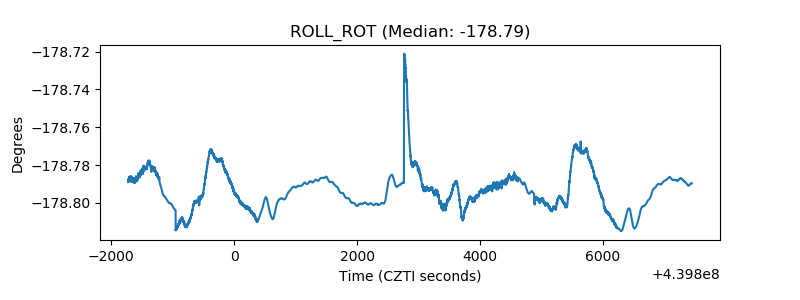 |
| _Roll_DEC | 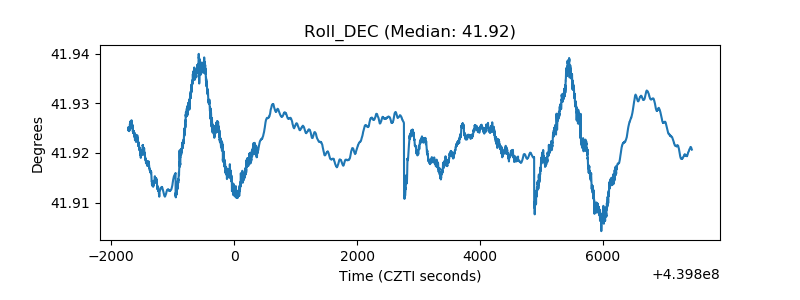 |
| _Roll_RA | 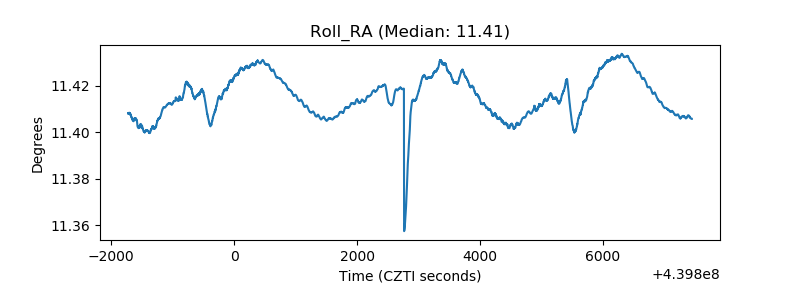 |
| Veto Counter | 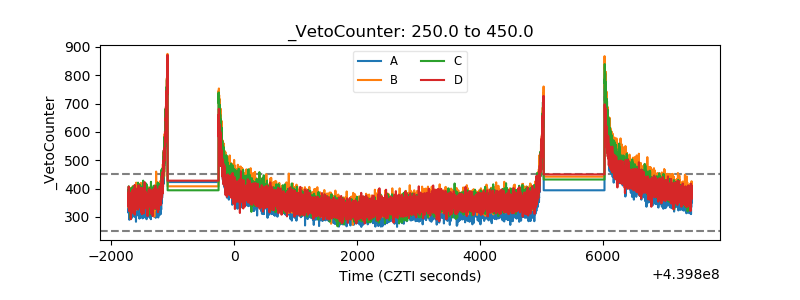 |