| Param | Original file | Final file |
|---|---|---|
| Filename | modeM0/AS1A13_059T01_9000005990_44505cztM0_level2.fits | modeM0/AS1A13_059T01_9000005990_44505cztM0_level2_quad_clean.evt |
| Size (bytes) | 449,078,400 | 102,467,520 |
| Size | 428.3 MB | 97.7 MB |
| Events in quadrant A | 4,514,132 | 685,129 |
| Events in quadrant B | 4,127,022 | 691,110 |
| Events in quadrant C | 3,445,804 | 682,041 |
| Events in quadrant D | 4,045,045 | 603,189 |
| Mode M0 | |||
|---|---|---|---|
| Quadrant | BADHDUFLAG | Total packets | Discarded packets |
| A | 0 | 19177 | 1 |
| B | 0 | 16604 | 1 |
| C | 0 | 14521 | 1 |
| D | 0 | 16371 | 1 |
| Mode SS | |||
|---|---|---|---|
| Quadrant | BADHDUFLAG | Total packets | Discarded packets |
| A | 0 | 128 | 0 |
| B | 0 | 128 | 0 |
| C | 0 | 128 | 0 |
| D | 0 | 128 | 0 |
| Mode M9 | |||
|---|---|---|---|
| Quadrant | BADHDUFLAG | Total packets | Discarded packets |
| A | 0 | 9 | 0 |
| B | 0 | 9 | 0 |
| C | 0 | 9 | 0 |
| D | 0 | 9 | 0 |
| Quadrant | Total seconds | Saturated seconds | Saturation percentage |
|---|---|---|---|
| A | 6324 | 199 | 3.146743% |
| B | 6325 | 385 | 6.086957% |
| C | 6325 | 91 | 1.438735% |
| D | 6325 | 341 | 5.391304% |
Noise dominated data is calculated using 1-second bins in cleaned event files. If a bin has >2000 counts, and if more than 50% of those come from <1% of pixels, then it is considered to be noise-dominated and hence unusable.
| Quadrant | # 1 sec bins | Bins with >0 counts | Bins with >2000 counts | High rate bins dominated by noise | Noise dominated (total time) | Noise dominated (detector-on time) | Marked lightcurve |
|---|---|---|---|---|---|---|---|
| A | 7184 | 6324 | 5 | 5 | 0.07% | 0.08% | 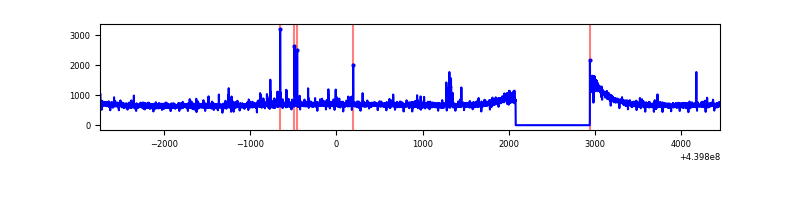 |
| B | 7185 | 6325 | 189 | 189 | 2.63% | 2.99% | 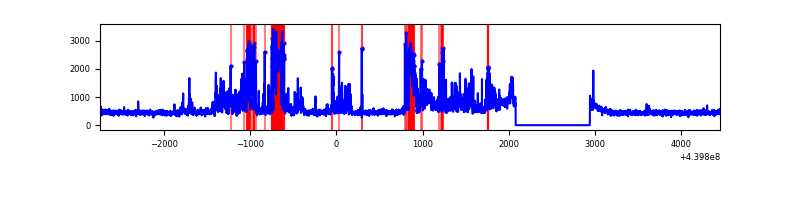 |
| C | 7185 | 6326 | 15 | 15 | 0.21% | 0.24% | 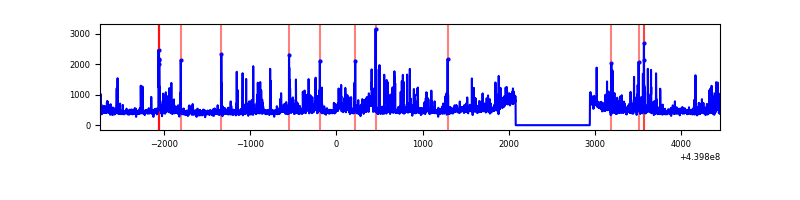 |
| D | 7185 | 6325 | 201 | 201 | 2.80% | 3.18% | 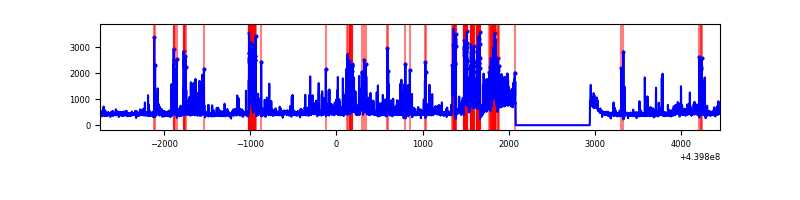 |
Top three noisy pixels from each quadrant. If the there are fewer than three noisy pixels in the level2.evt file, extra rows are filled as -1
| Pixel properties | Quadrant properties | ||||||
|---|---|---|---|---|---|---|---|
| Quadrant | DetID | PixID | Counts | Sigma | Mean | Median | Sigma |
| A | 10 | 83 | 1607762 | 10521.51 | 730 | 714 | 152.7 |
| A | 13 | 248 | 48819 | 314.95 | 730 | 714 | 152.7 |
| A | 4 | 2 | 21181 | 134.0 | 730 | 714 | 152.7 |
| B | 5 | 235 | 778232 | 5517.5 | 710 | 688 | 140.9 |
| B | 5 | 172 | 402959 | 2854.54 | 710 | 688 | 140.9 |
| B | 0 | 186 | 80805 | 568.51 | 710 | 688 | 140.9 |
| C | 3 | 233 | 459871 | 2692.65 | 716 | 718 | 170.5 |
| C | 14 | 254 | 176071 | 1028.34 | 716 | 718 | 170.5 |
| C | 12 | 250 | 16084 | 90.11 | 716 | 718 | 170.5 |
| D | 1 | 52 | 633172 | 3530.72 | 708 | 684 | 179.1 |
| D | 2 | 249 | 377409 | 2102.98 | 708 | 684 | 179.1 |
| D | 12 | 233 | 151491 | 841.84 | 708 | 684 | 179.1 |
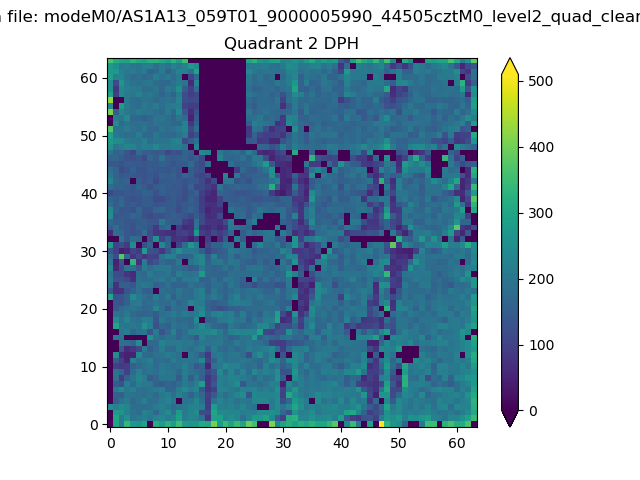
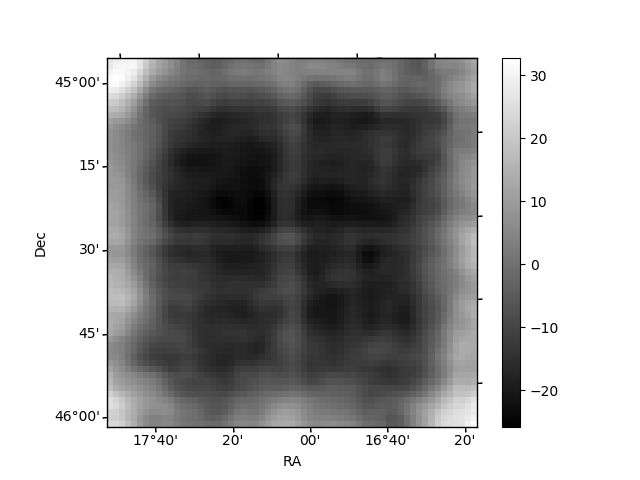
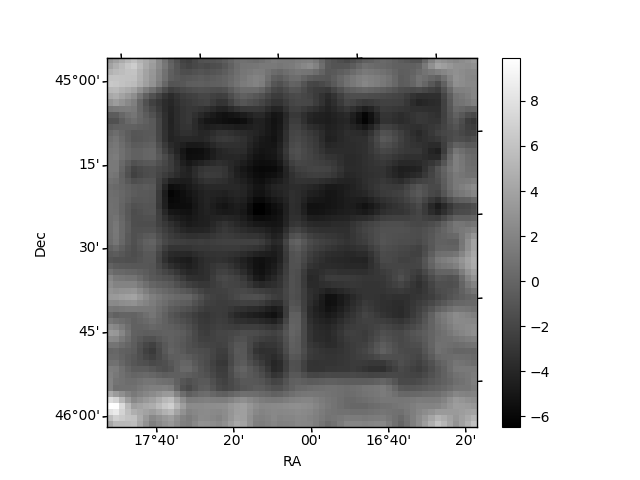
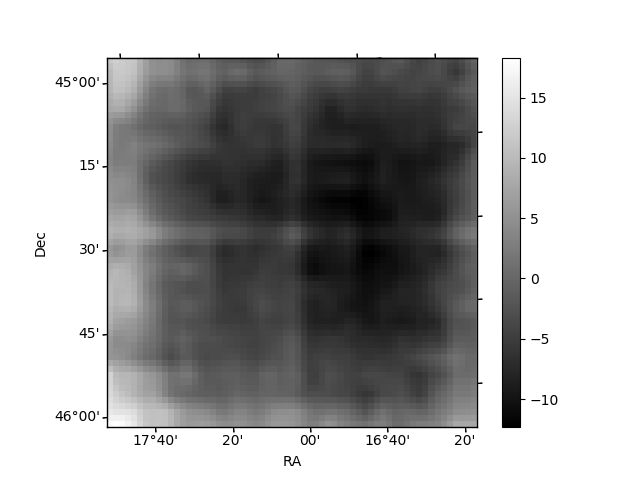
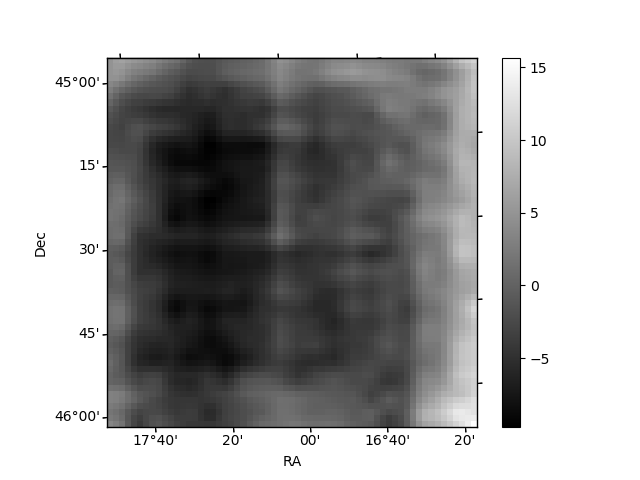
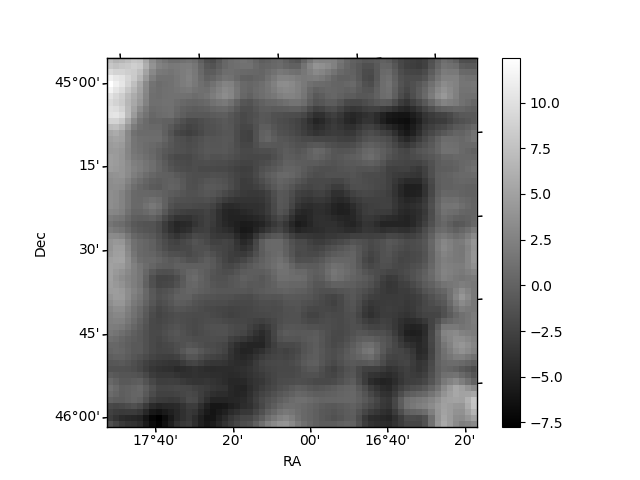
Histogram calculated using DETX and DETY for each event in the final _common_clean file
| Quadrant A | 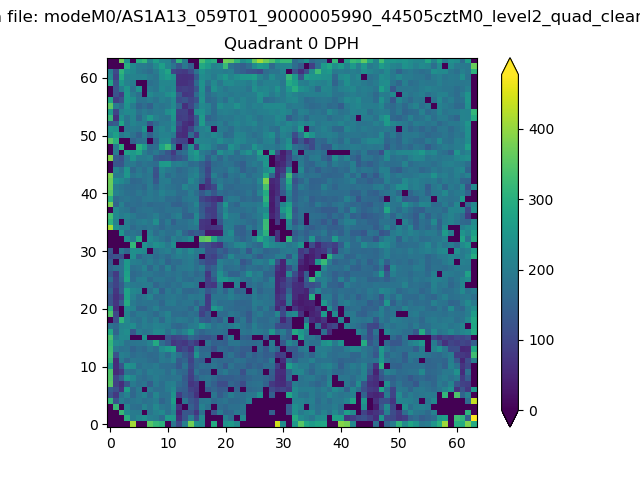 |
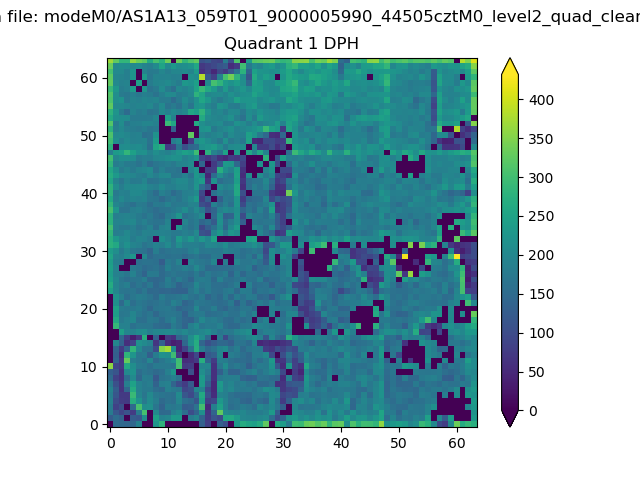 |
Quadrant B |
|---|---|---|---|
| Quadrant D | 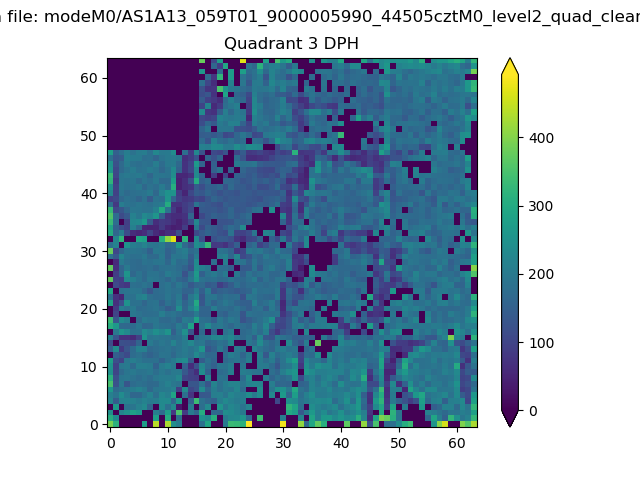 |
 |
Quadrant C |
| Plot type | Count rate plots | Images |
|---|---|---|
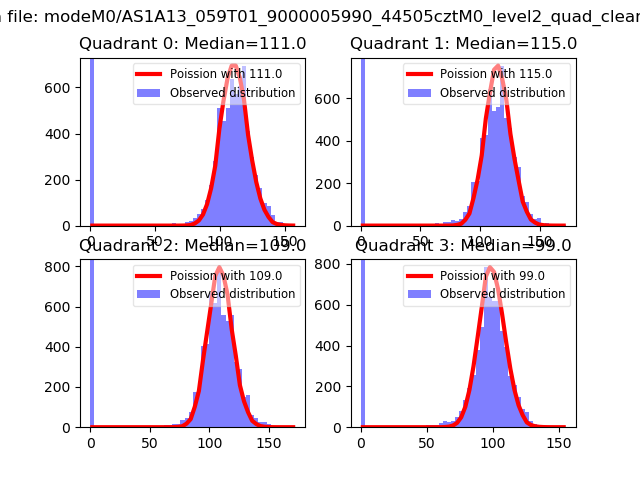
| Comparison with Poisson distribution Blue bars denote a histogram of data divided into 1 sec bins. Red curve is a Poisson curve with rate = median count rate of data. |
 |
 |
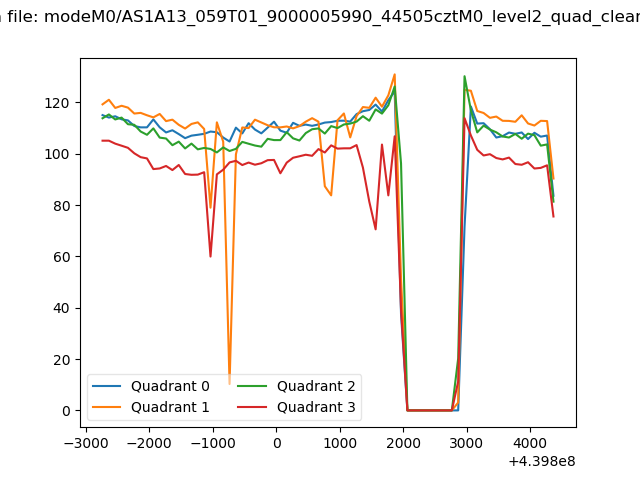
| Quadrant-wise count rates Data is divided into 100 sec bins |
 |
|
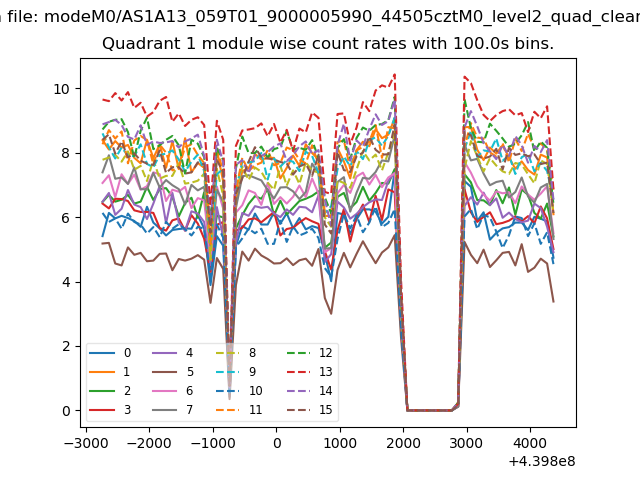
| Module-wise count rates for Quadrant A Data is divided into 100 sec bins |
 |
 |
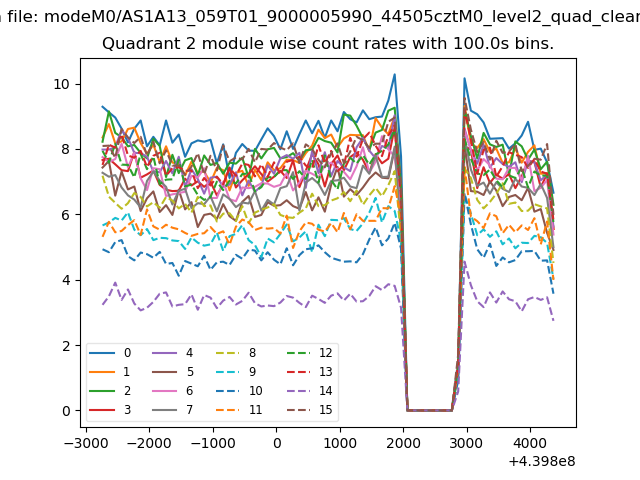
| Module-wise count rates for Quadrant B Data is divided into 100 sec bins |
 |
 |
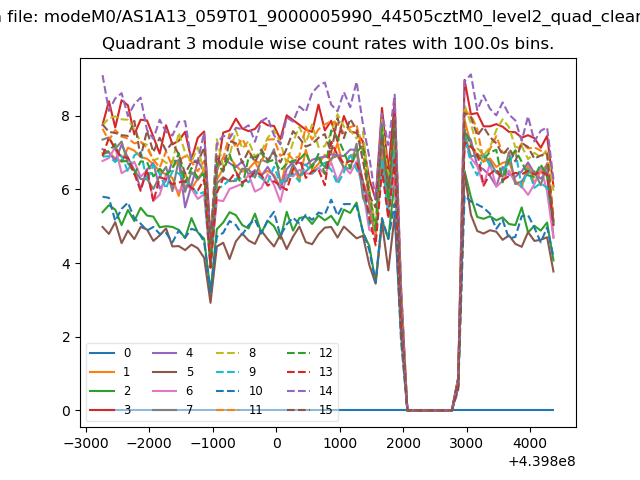
| Module-wise count rates for Quadrant C Data is divided into 100 sec bins |
 |
 |
| Module-wise count rates for Quadrant D Data is divided into 100 sec bins |
 |
 |
| Parameter | Plot |
|---|---|
| CZT HV Monitor | 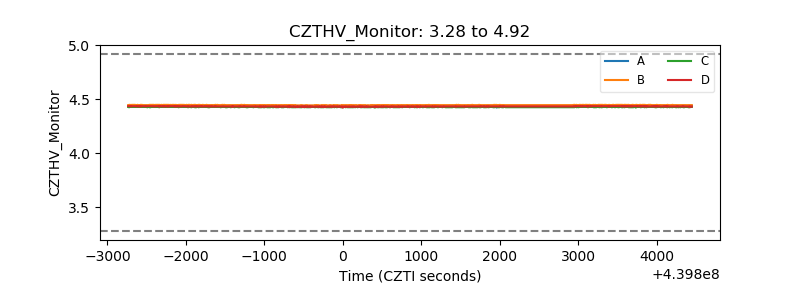 |
| D_VDD | 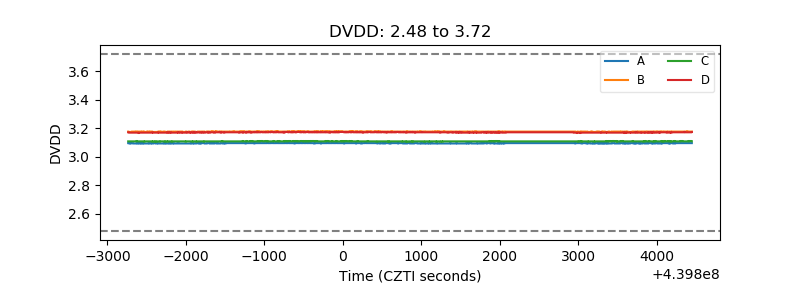 |
| Temperature 1 | 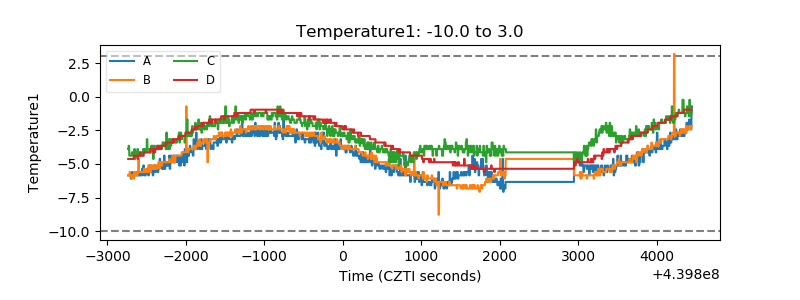 |
| Veto HV Monitor | 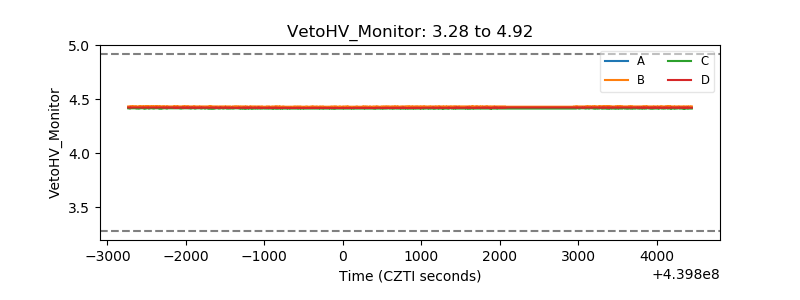 |
| Veto LLD | 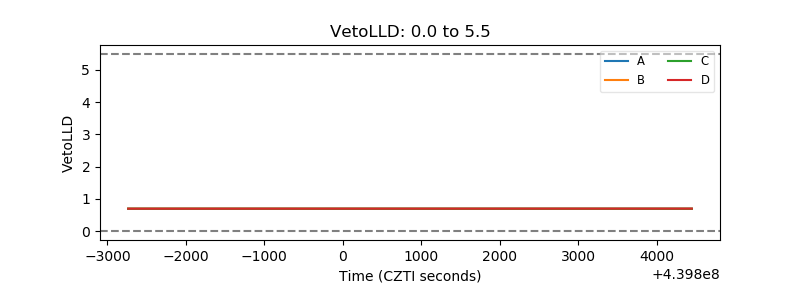 |
| Alpha Counter |  |
| _CPM_Rate | 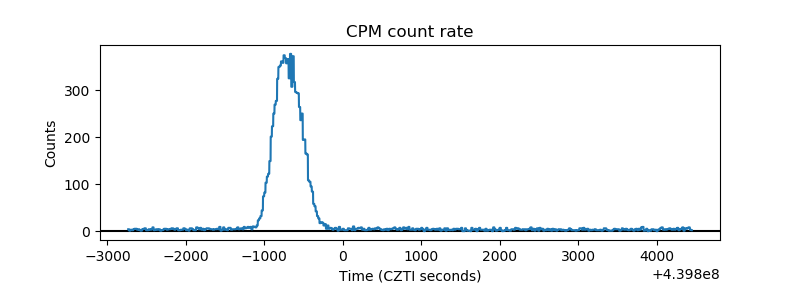 |
| CZT Counter | 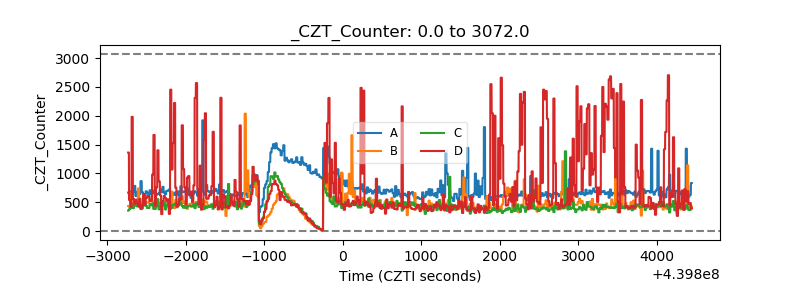 |
| +2.5 Volts monitor | 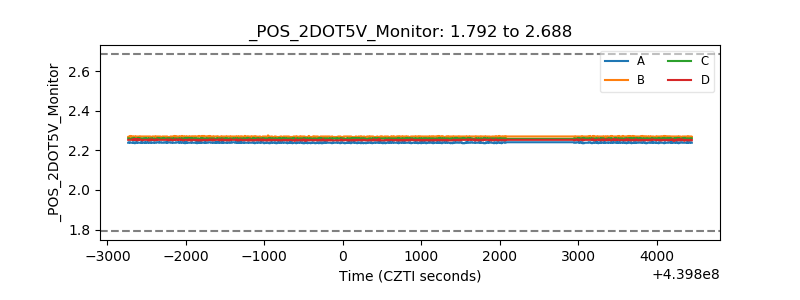 |
| +5 Volts monitor | 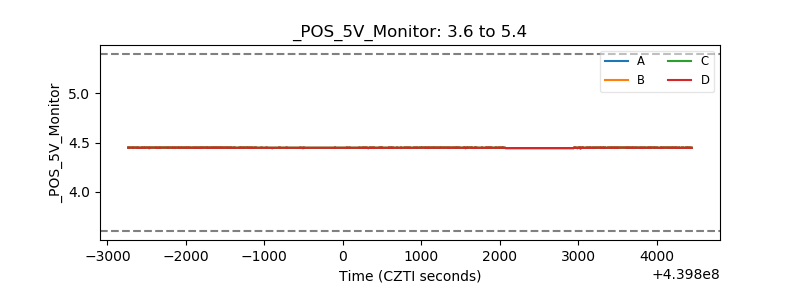 |
| _ROLL_ROT | 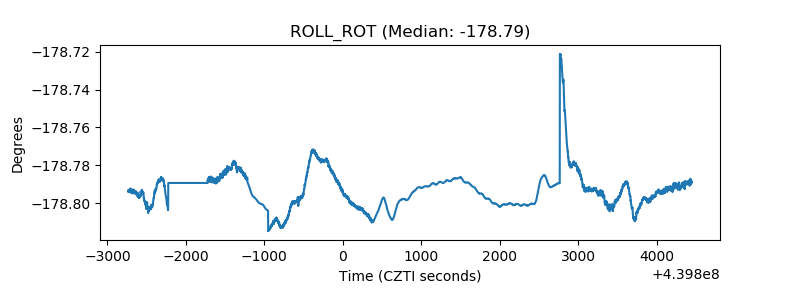 |
| _Roll_DEC | 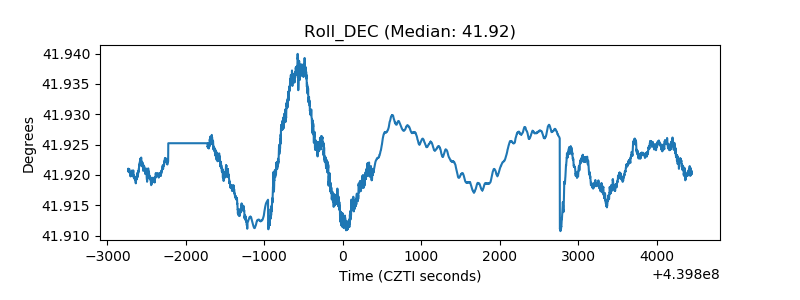 |
| _Roll_RA | 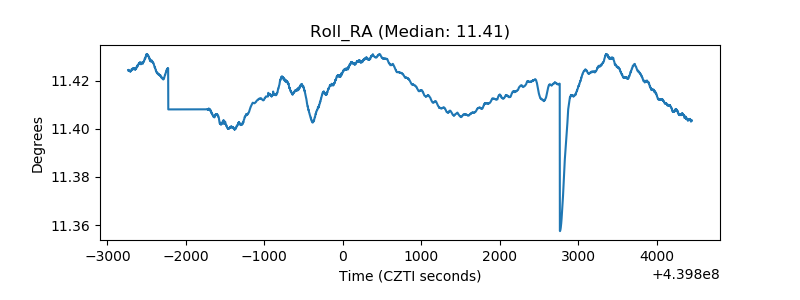 |
| Veto Counter | 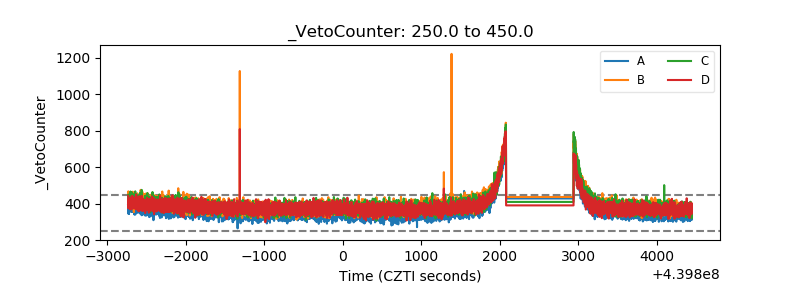 |