| Param | Original file | Final file |
|---|---|---|
| Filename | modeM0/AS1A13_059T01_9000005990_44507cztM0_level2.fits | modeM0/AS1A13_059T01_9000005990_44507cztM0_level2_quad_clean.evt |
| Size (bytes) | 33,091,200 | 9,034,560 |
| Size | 31.6 MB | 8.6 MB |
| Events in quadrant A | 362,998 | 58,919 |
| Events in quadrant B | 242,017 | 60,390 |
| Events in quadrant C | 238,515 | 57,705 |
| Events in quadrant D | 335,536 | 50,918 |
| Mode M0 | |||
|---|---|---|---|
| Quadrant | BADHDUFLAG | Total packets | Discarded packets |
| A | 0 | 1603 | 0 |
| B | 0 | 1092 | 0 |
| C | 0 | 1091 | 0 |
| D | 0 | 1373 | 0 |
| Mode SS | |||
|---|---|---|---|
| Quadrant | BADHDUFLAG | Total packets | Discarded packets |
| A | 0 | 12 | 0 |
| B | 0 | 12 | 0 |
| C | 0 | 12 | 0 |
| D | 0 | 12 | 0 |
| Quadrant | Total seconds | Saturated seconds | Saturation percentage |
|---|---|---|---|
| A | 542 | 0 | 0.000000% |
| B | 543 | 1 | 0.184162% |
| C | 543 | 0 | 0.000000% |
| D | 543 | 22 | 4.051565% |
Noise dominated data is calculated using 1-second bins in cleaned event files. If a bin has >2000 counts, and if more than 50% of those come from <1% of pixels, then it is considered to be noise-dominated and hence unusable.
| Quadrant | # 1 sec bins | Bins with >0 counts | Bins with >2000 counts | High rate bins dominated by noise | Noise dominated (total time) | Noise dominated (detector-on time) | Marked lightcurve |
|---|---|---|---|---|---|---|---|
| A | 542 | 542 | 0 | 0 | 0.00% | 0.00% | 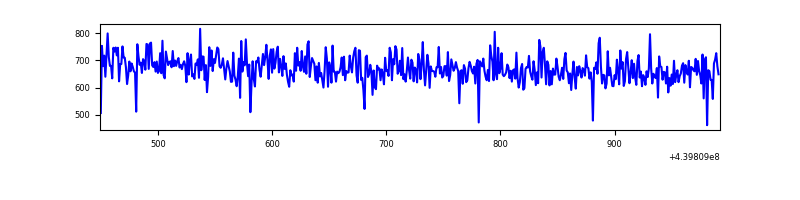 |
| B | 543 | 543 | 0 | 0 | 0.00% | 0.00% | 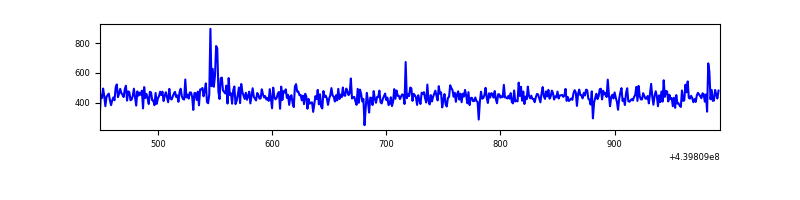 |
| C | 543 | 543 | 0 | 0 | 0.00% | 0.00% | 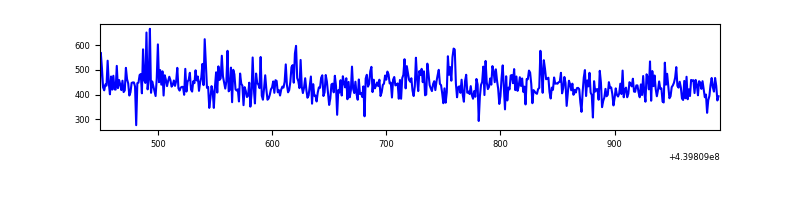 |
| D | 543 | 543 | 20 | 20 | 3.68% | 3.68% | 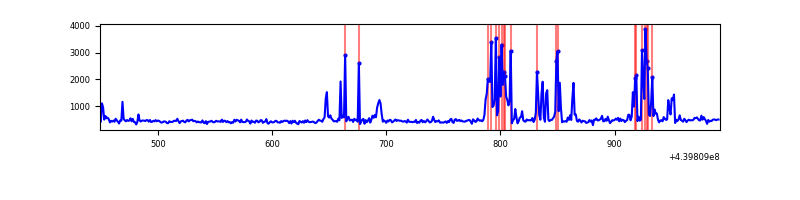 |
Top three noisy pixels from each quadrant. If the there are fewer than three noisy pixels in the level2.evt file, extra rows are filled as -1
| Pixel properties | Quadrant properties | ||||||
|---|---|---|---|---|---|---|---|
| Quadrant | DetID | PixID | Counts | Sigma | Mean | Median | Sigma |
| A | 10 | 83 | 126266 | 8506.25 | 61 | 60 | 14.8 |
| A | 3 | 137 | 682 | 41.92 | 61 | 60 | 14.8 |
| A | 0 | 226 | 470 | 27.63 | 61 | 60 | 14.8 |
| B | 4 | 170 | 2749 | 188.09 | 60 | 58 | 14.3 |
| B | 12 | 111 | 1537 | 103.38 | 60 | 58 | 14.3 |
| B | 11 | 111 | 1490 | 100.09 | 60 | 58 | 14.3 |
| C | 3 | 233 | 4433 | 273.63 | 59 | 59 | 16.0 |
| C | 14 | 254 | 2050 | 124.55 | 59 | 59 | 16.0 |
| C | 13 | 61 | 379 | 20.02 | 59 | 59 | 16.0 |
| D | 2 | 249 | 91286 | 5377.69 | 59 | 56 | 17.0 |
| D | 1 | 52 | 12212 | 716.55 | 59 | 56 | 17.0 |
| D | 12 | 233 | 3363 | 194.94 | 59 | 56 | 17.0 |
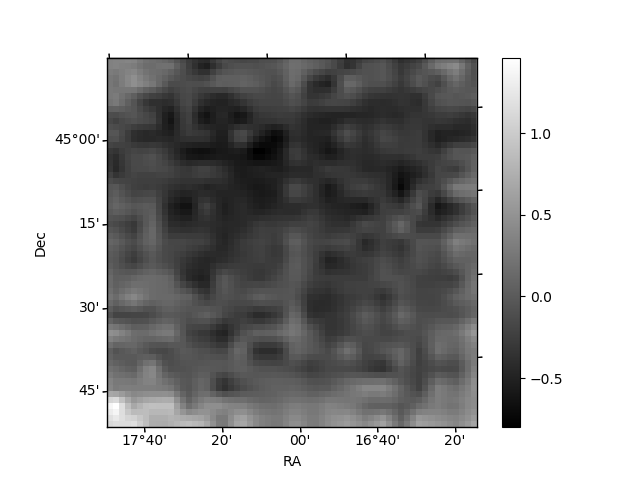
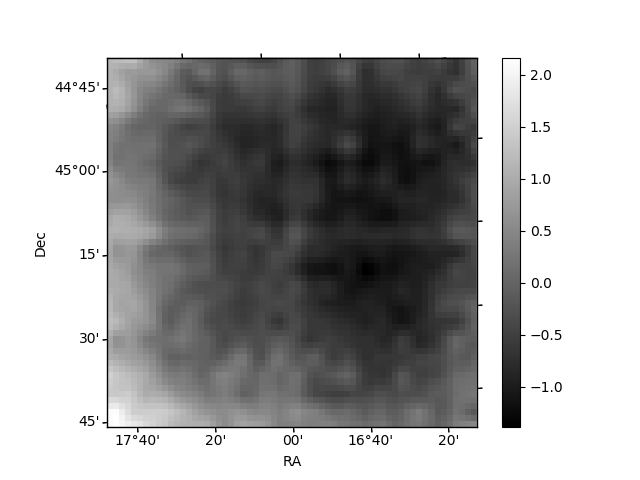
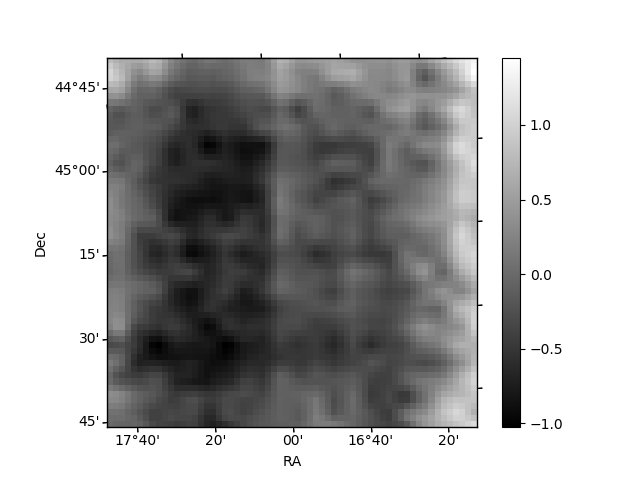
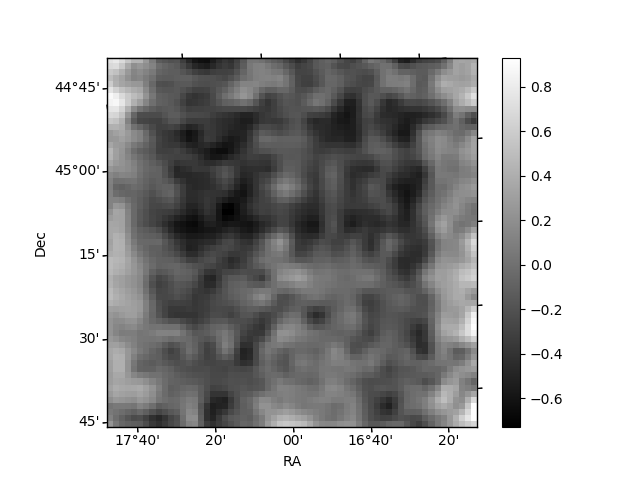
Histogram calculated using DETX and DETY for each event in the final _common_clean file
| Quadrant A | 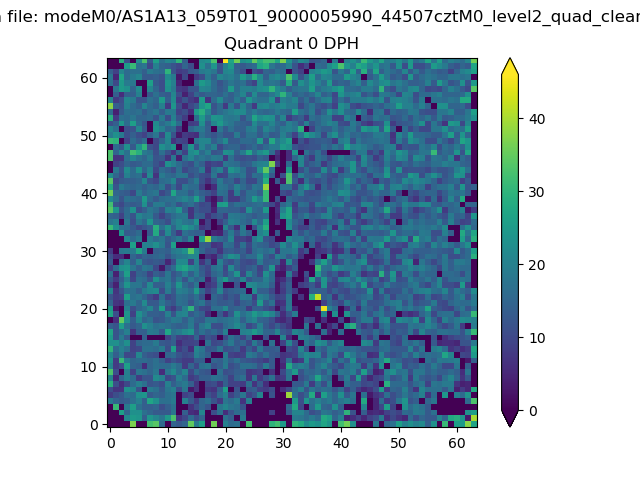 |
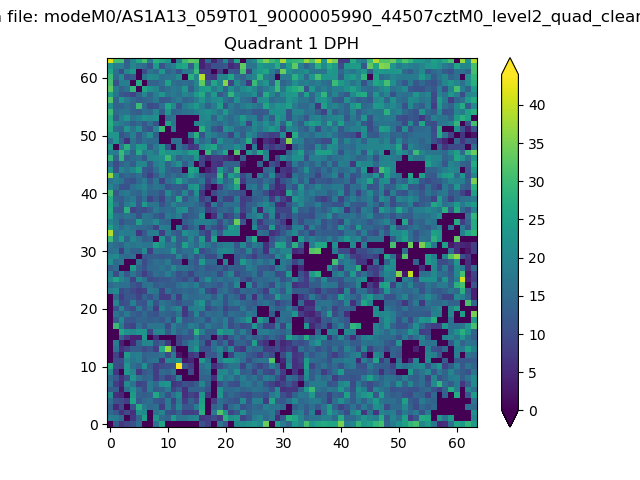 |
Quadrant B |
|---|---|---|---|
| Quadrant D | 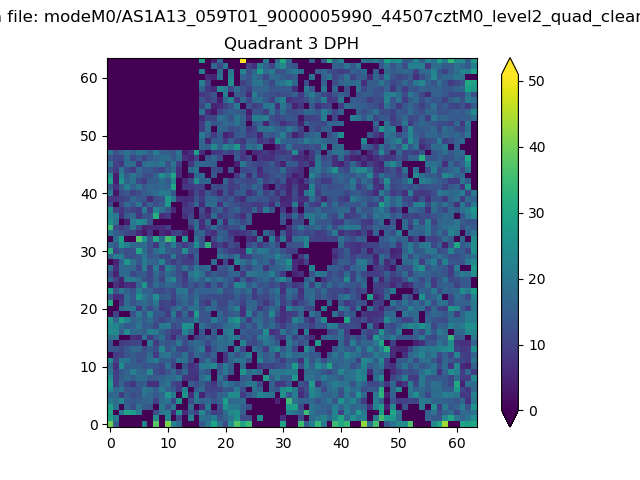 |
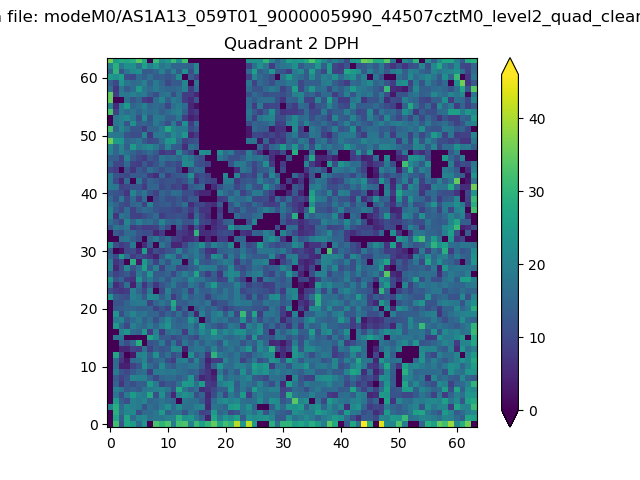 |
Quadrant C |
| Plot type | Count rate plots | Images |
|---|---|---|
| Comparison with Poisson distribution Blue bars denote a histogram of data divided into 1 sec bins. Red curve is a Poisson curve with rate = median count rate of data. |
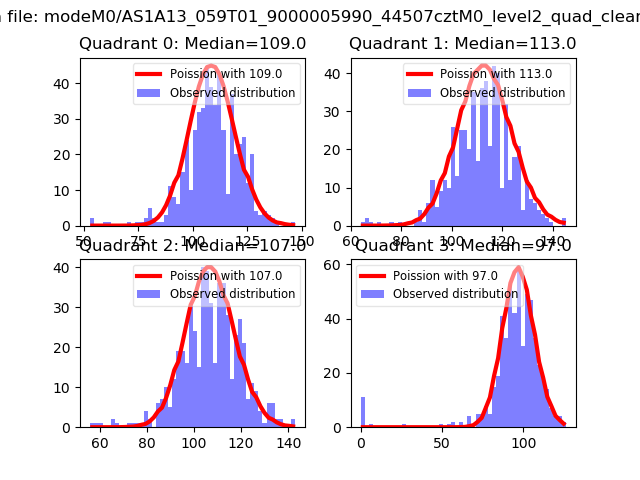 |
 |
| Quadrant-wise count rates Data is divided into 100 sec bins |
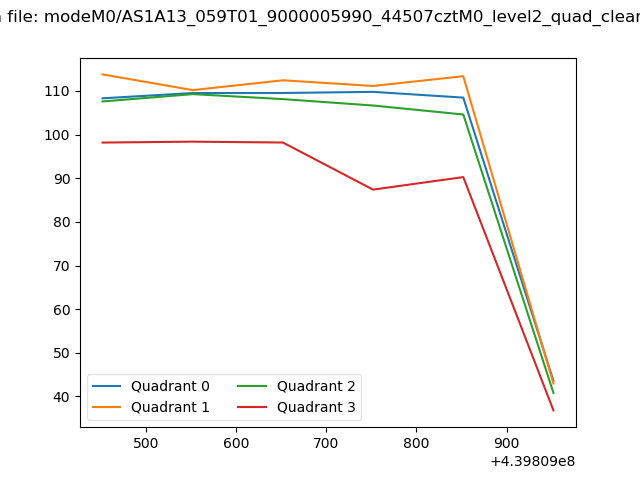 |
|
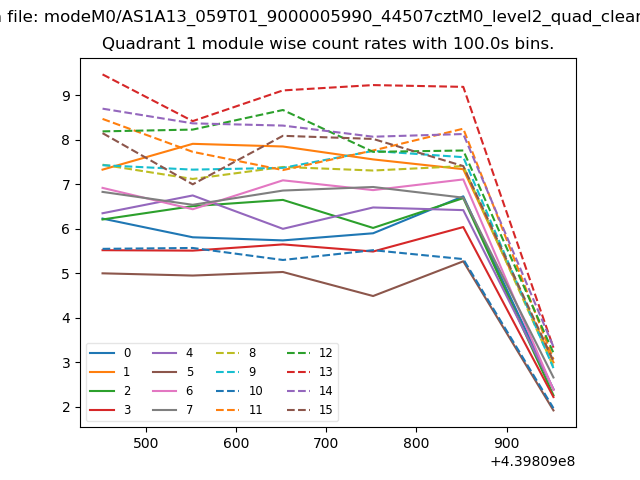
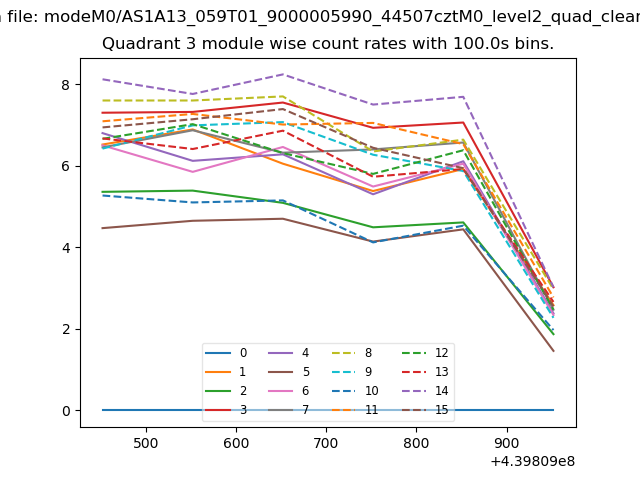
| Module-wise count rates for Quadrant A Data is divided into 100 sec bins |
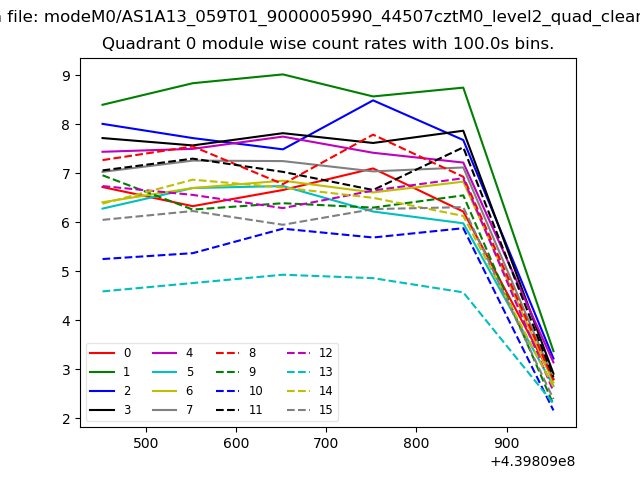 |
 |
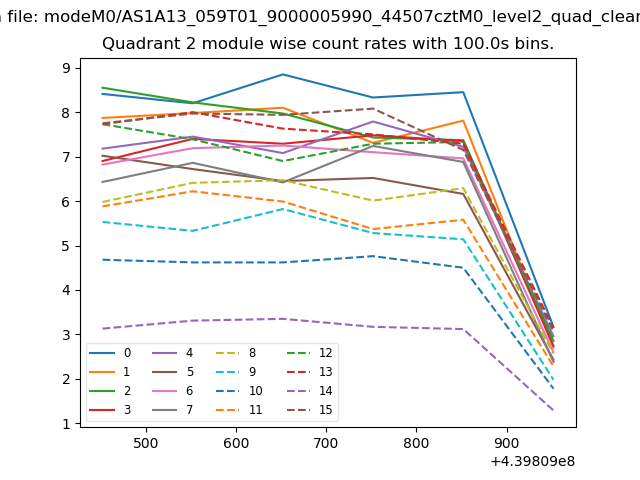
| Module-wise count rates for Quadrant B Data is divided into 100 sec bins |
 |
 |
| Module-wise count rates for Quadrant C Data is divided into 100 sec bins |
 |
 |
| Module-wise count rates for Quadrant D Data is divided into 100 sec bins |
 |
 |
| Parameter | Plot |
|---|---|
| CZT HV Monitor | 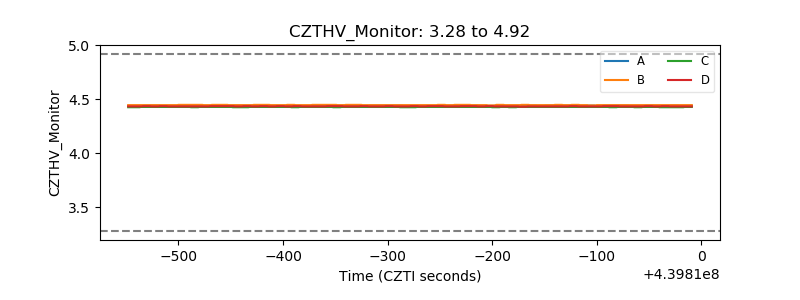 |
| D_VDD | 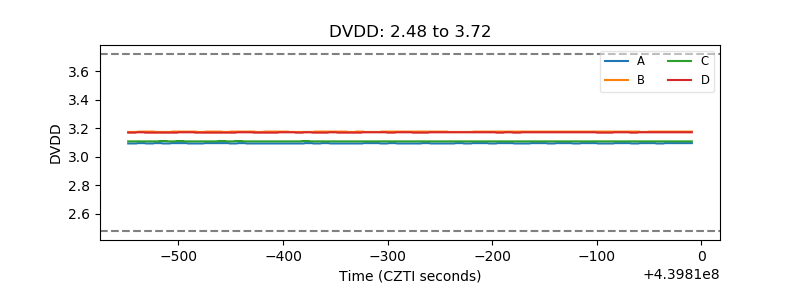 |
| Temperature 1 | 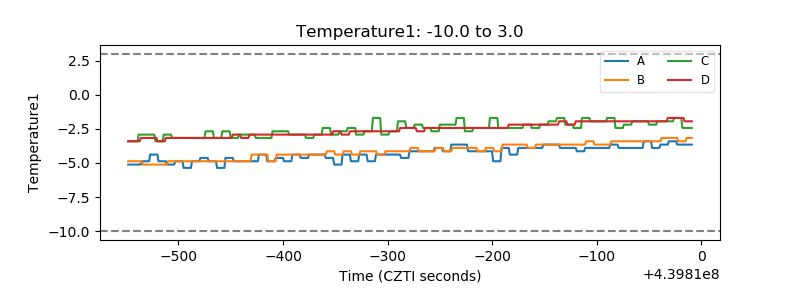 |
| Veto HV Monitor | 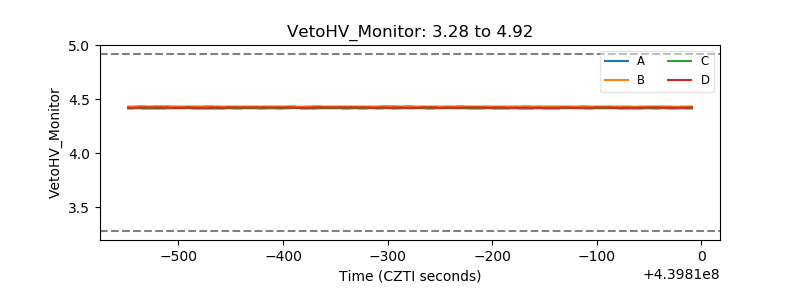 |
| Veto LLD | 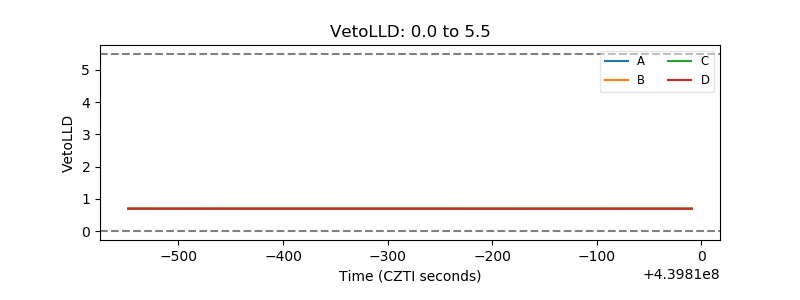 |
| Alpha Counter | 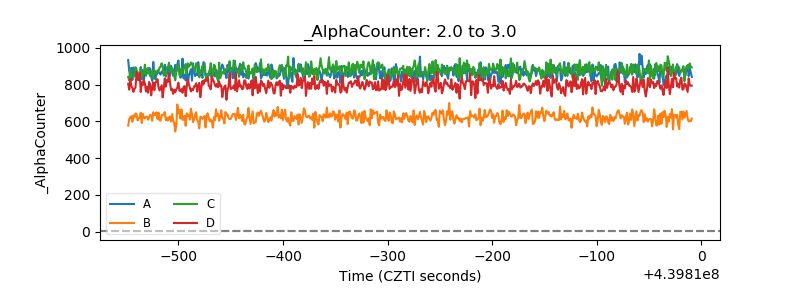 |
| _CPM_Rate | 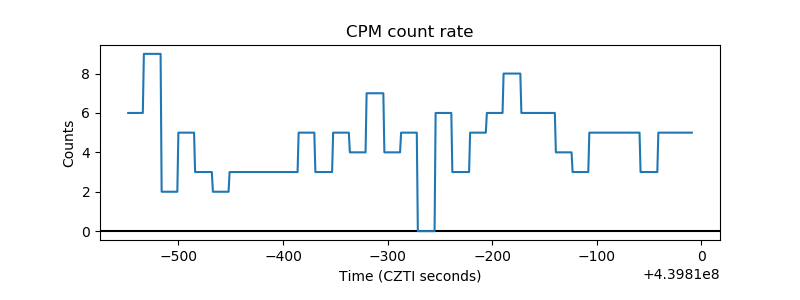 |
| CZT Counter |  |
| +2.5 Volts monitor | 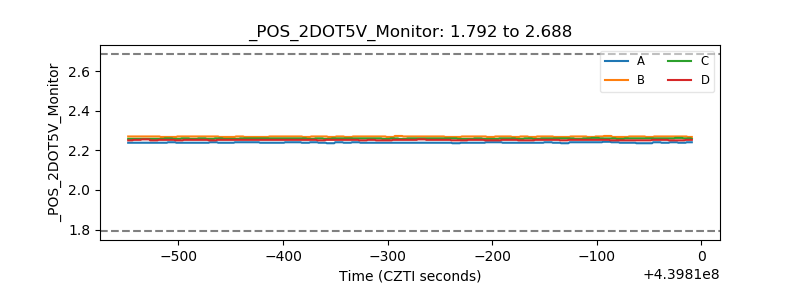 |
| +5 Volts monitor | 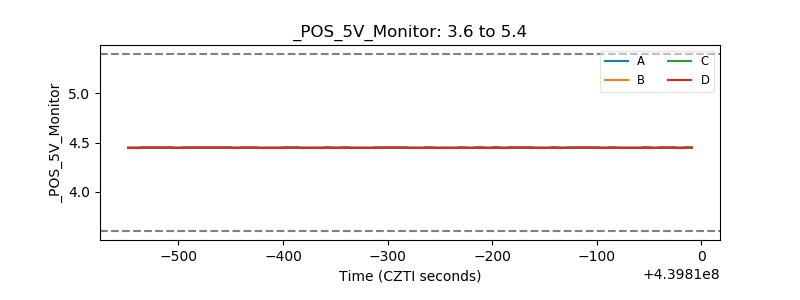 |
| _ROLL_ROT | 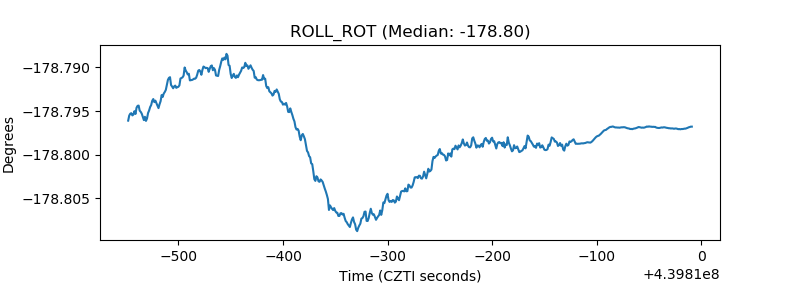 |
| _Roll_DEC | 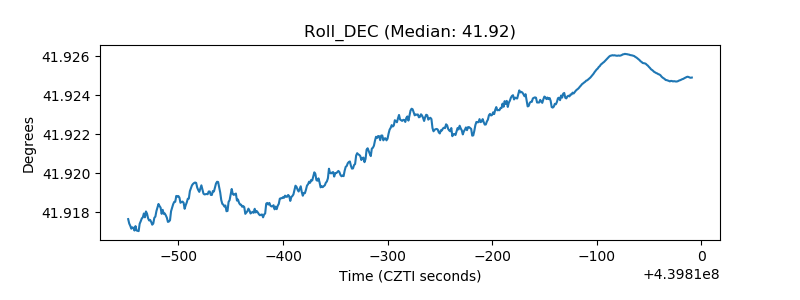 |
| _Roll_RA | 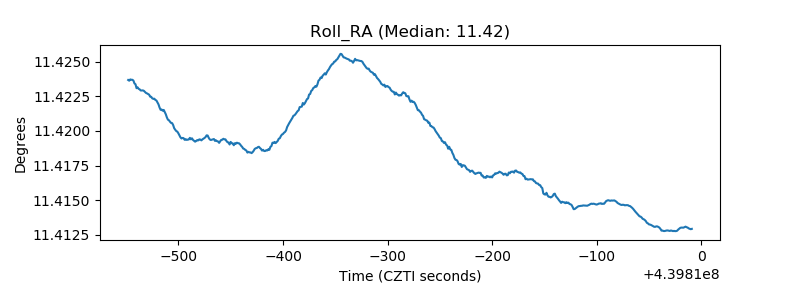 |
| Veto Counter | 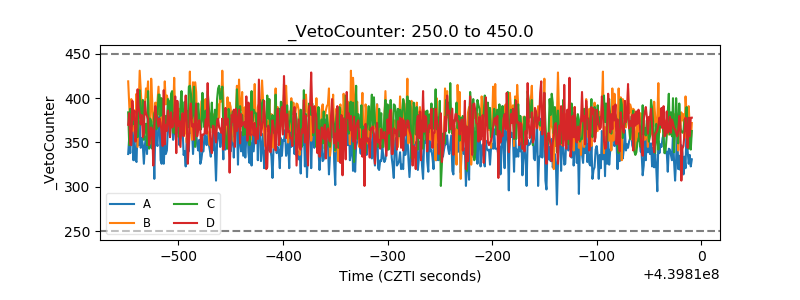 |