| Param | Original file | Final file |
|---|---|---|
| Filename | modeM0/AS1A13_004T09_9000005992_44327cztM0_level2.fits | modeM0/AS1A13_004T09_9000005992_44327cztM0_level2_quad_clean.evt |
| Size (bytes) | 163,555,200 | 38,882,880 |
| Size | 156.0 MB | 37.1 MB |
| Events in quadrant A | 1,713,894 | 261,099 |
| Events in quadrant B | 1,366,518 | 268,424 |
| Events in quadrant C | 1,134,946 | 260,740 |
| Events in quadrant D | 1,665,415 | 228,278 |
| Mode SS | |||
|---|---|---|---|
| Quadrant | BADHDUFLAG | Total packets | Discarded packets |
| A | 0 | 46 | 0 |
| B | 0 | 46 | 0 |
| C | 0 | 46 | 0 |
| D | 0 | 46 | 0 |
| Mode M9 | |||
|---|---|---|---|
| Quadrant | BADHDUFLAG | Total packets | Discarded packets |
| A | 0 | 11 | 0 |
| B | 0 | 11 | 0 |
| C | 0 | 11 | 0 |
| D | 0 | 11 | 0 |
| Mode M0 | |||
|---|---|---|---|
| Quadrant | BADHDUFLAG | Total packets | Discarded packets |
| A | 0 | 6940 | 1 |
| B | 0 | 5465 | 1 |
| C | 0 | 4753 | 1 |
| D | 0 | 6337 | 1 |
| Quadrant | Total seconds | Saturated seconds | Saturation percentage |
|---|---|---|---|
| A | 2202 | 136 | 6.176203% |
| B | 2202 | 151 | 6.857402% |
| C | 2202 | 63 | 2.861035% |
| D | 2202 | 216 | 9.809264% |
Noise dominated data is calculated using 1-second bins in cleaned event files. If a bin has >2000 counts, and if more than 50% of those come from <1% of pixels, then it is considered to be noise-dominated and hence unusable.
| Quadrant | # 1 sec bins | Bins with >0 counts | Bins with >2000 counts | High rate bins dominated by noise | Noise dominated (total time) | Noise dominated (detector-on time) | Marked lightcurve |
|---|---|---|---|---|---|---|---|
| A | 3292 | 2202 | 4 | 4 | 0.12% | 0.18% | 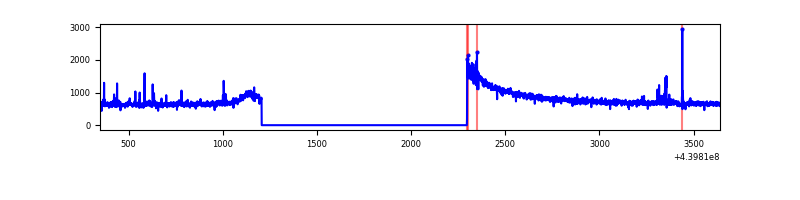 |
| B | 3292 | 2202 | 25 | 25 | 0.76% | 1.14% | 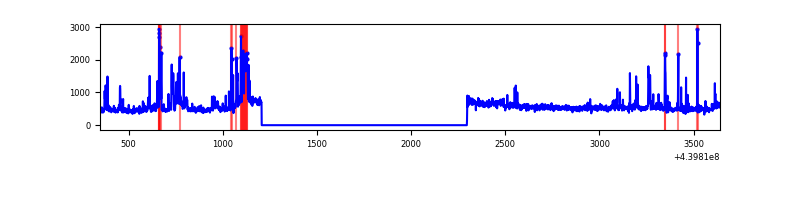 |
| C | 3292 | 2202 | 3 | 3 | 0.09% | 0.14% | 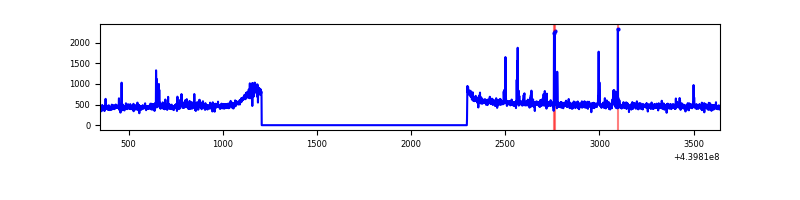 |
| D | 3292 | 2202 | 128 | 128 | 3.89% | 5.81% | 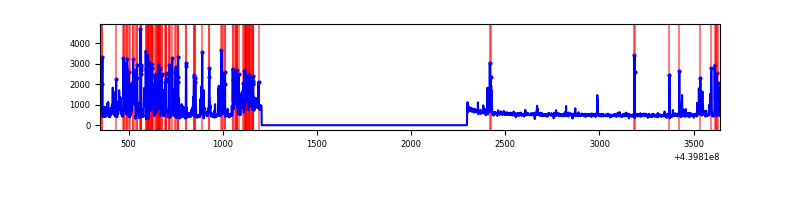 |
Top three noisy pixels from each quadrant. If the there are fewer than three noisy pixels in the level2.evt file, extra rows are filled as -1
| Pixel properties | Quadrant properties | ||||||
|---|---|---|---|---|---|---|---|
| Quadrant | DetID | PixID | Counts | Sigma | Mean | Median | Sigma |
| A | 10 | 83 | 572540 | 9520.62 | 283 | 277 | 60.1 |
| A | 7 | 3 | 37202 | 614.31 | 283 | 277 | 60.1 |
| A | 15 | 223 | 5143 | 80.95 | 283 | 277 | 60.1 |
| B | 0 | 219 | 135326 | 2382.55 | 278 | 270 | 56.7 |
| B | 7 | 221 | 83770 | 1473.04 | 278 | 270 | 56.7 |
| B | 4 | 158 | 16875 | 292.93 | 278 | 270 | 56.7 |
| C | 14 | 254 | 34051 | 507.74 | 277 | 279 | 66.5 |
| C | 1 | 3 | 14118 | 208.06 | 277 | 279 | 66.5 |
| C | 3 | 233 | 5263 | 74.93 | 277 | 279 | 66.5 |
| D | 13 | 249 | 397016 | 5820.52 | 268 | 259 | 68.2 |
| D | 2 | 153 | 123408 | 1806.63 | 268 | 259 | 68.2 |
| D | 4 | 234 | 44162 | 644.07 | 268 | 259 | 68.2 |
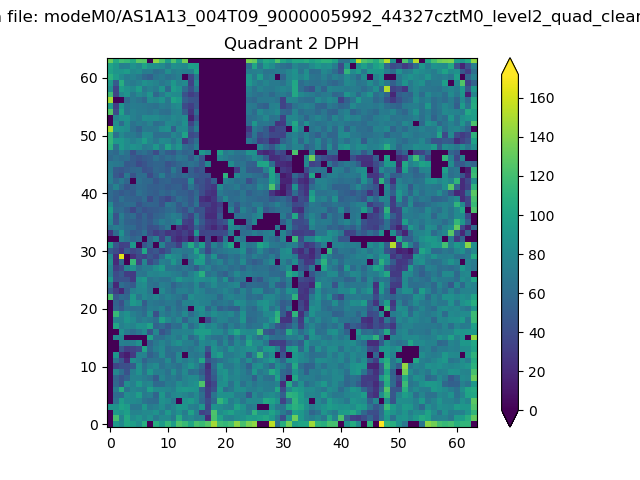
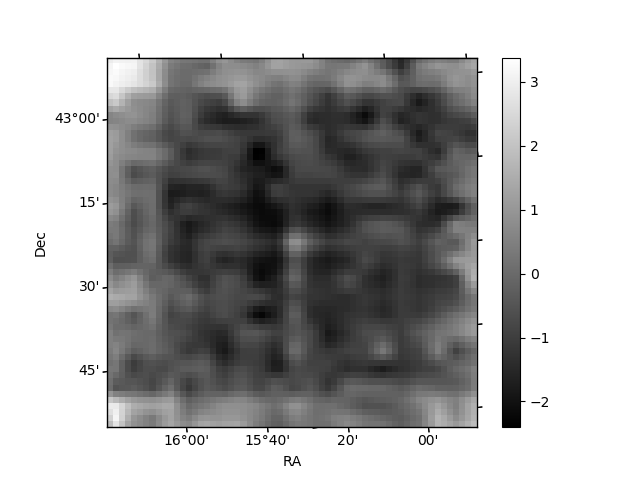
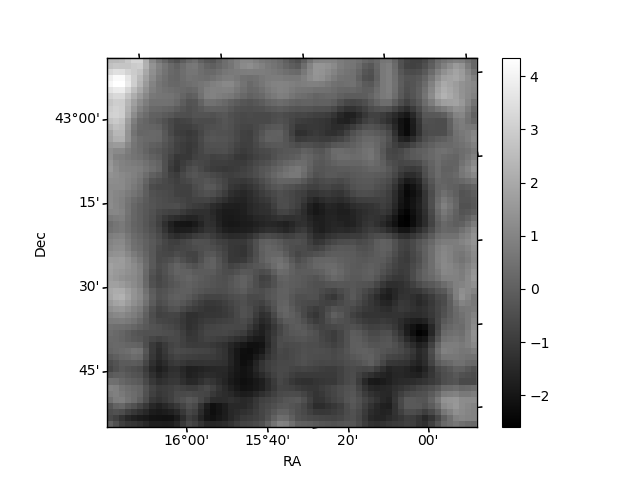
Histogram calculated using DETX and DETY for each event in the final _common_clean file
| Quadrant A |  |
 |
Quadrant B |
|---|---|---|---|
| Quadrant D | 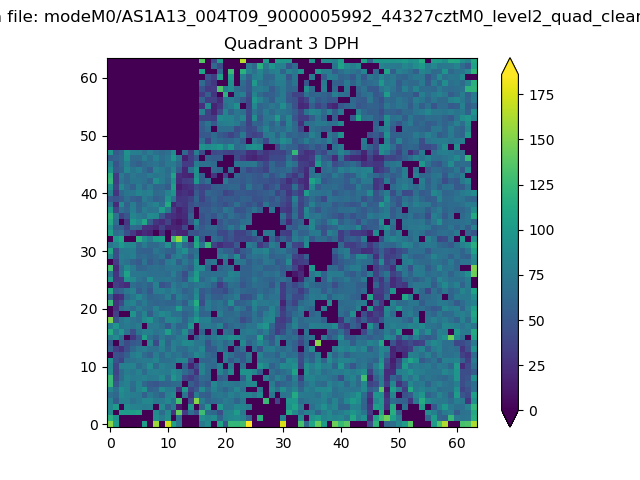 |
 |
Quadrant C |
| Plot type | Count rate plots | Images |
|---|---|---|
| Comparison with Poisson distribution Blue bars denote a histogram of data divided into 1 sec bins. Red curve is a Poisson curve with rate = median count rate of data. |
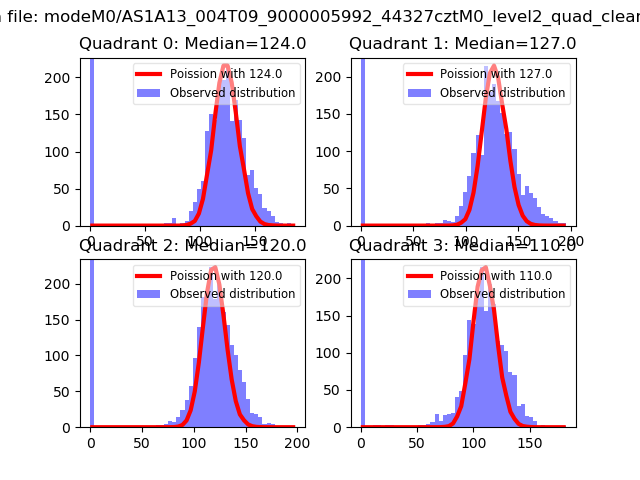 |
 |
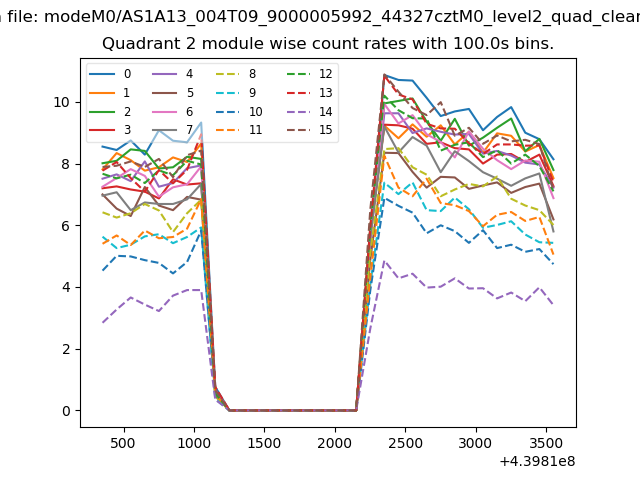
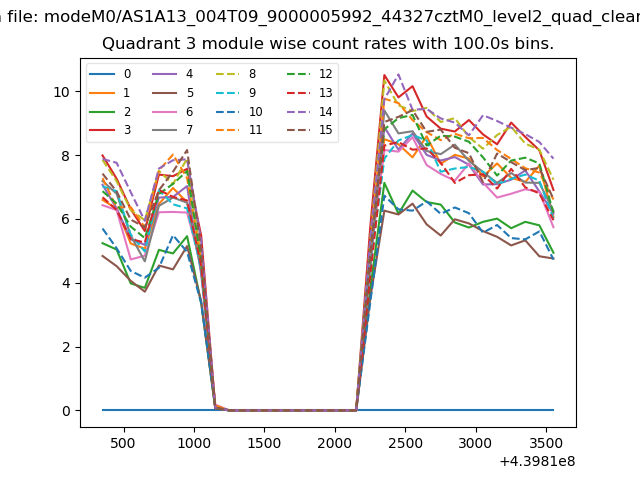
| Quadrant-wise count rates Data is divided into 100 sec bins |
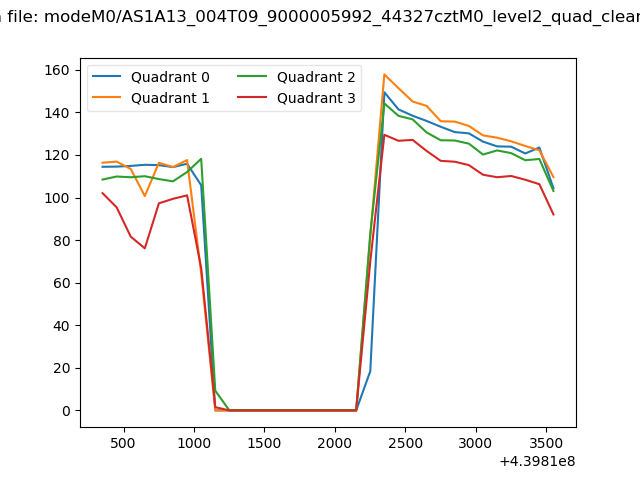 |
|
| Module-wise count rates for Quadrant A Data is divided into 100 sec bins |
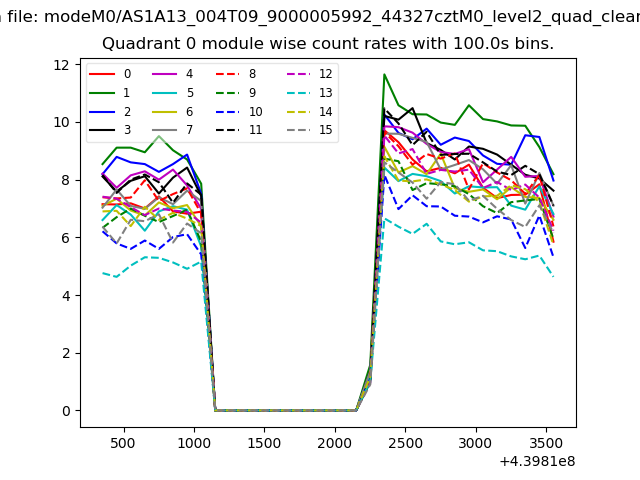 |
 |
| Module-wise count rates for Quadrant B Data is divided into 100 sec bins |
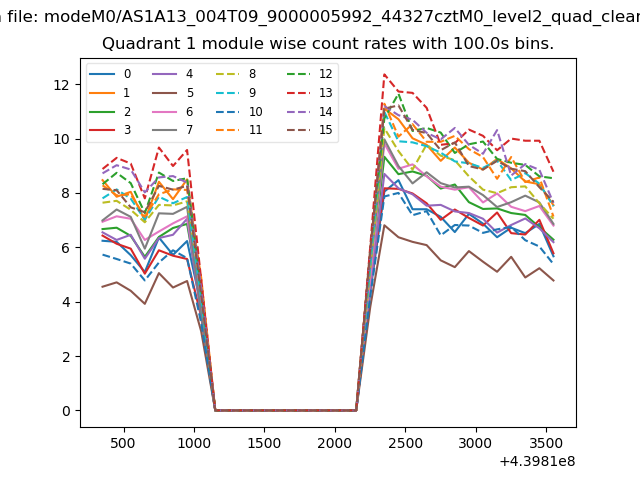 |
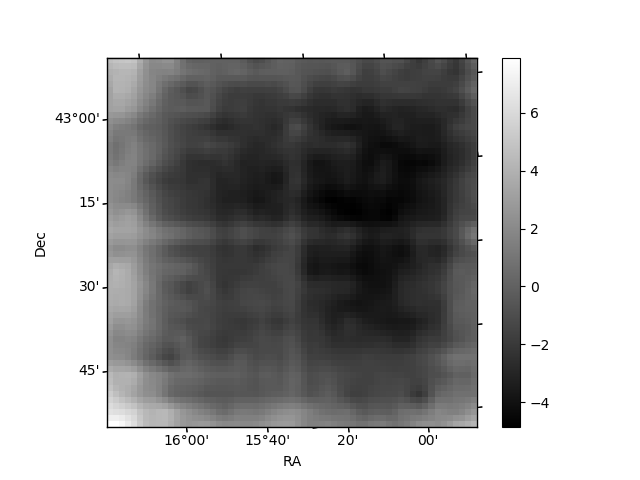 |
| Module-wise count rates for Quadrant C Data is divided into 100 sec bins |
 |
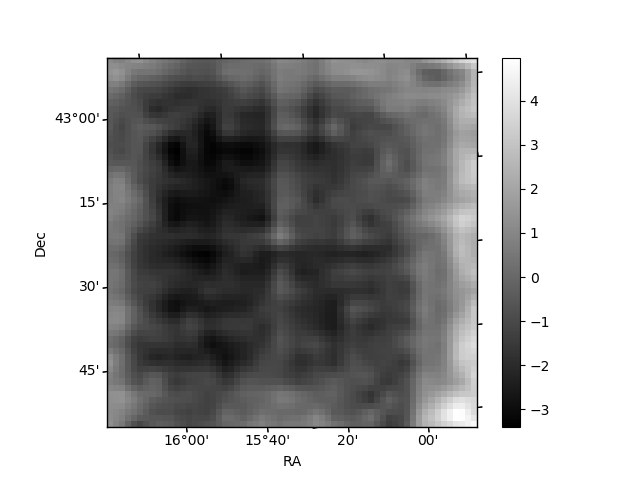 |
| Module-wise count rates for Quadrant D Data is divided into 100 sec bins |
 |
 |
| Parameter | Plot |
|---|---|
| CZT HV Monitor | 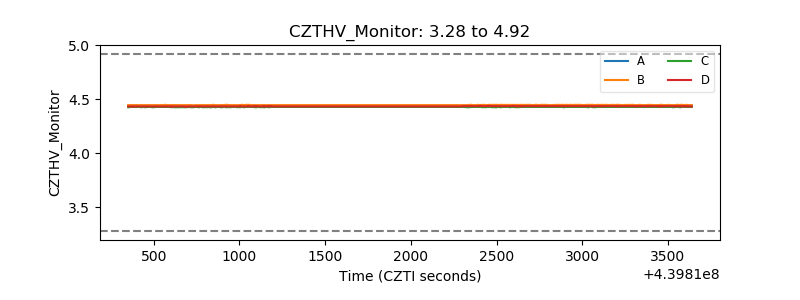 |
| D_VDD | 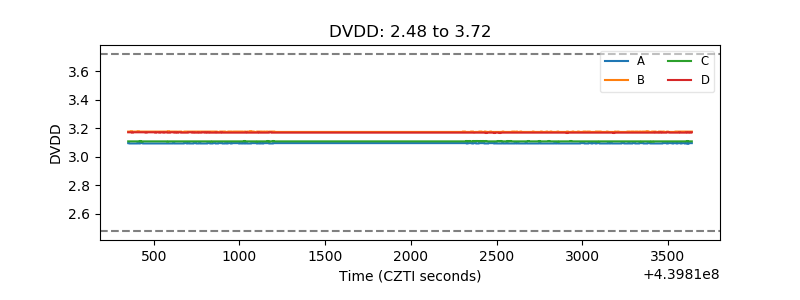 |
| Temperature 1 | 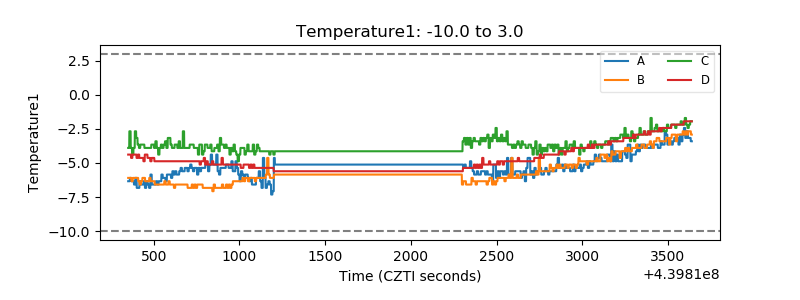 |
| Veto HV Monitor | 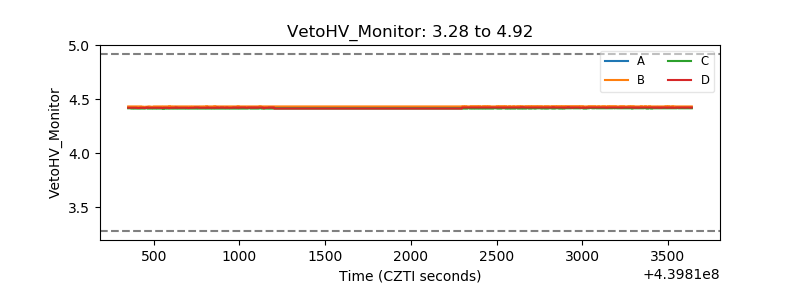 |
| Veto LLD | 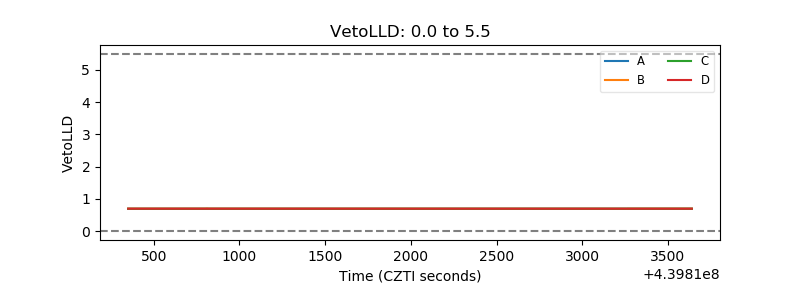 |
| Alpha Counter | 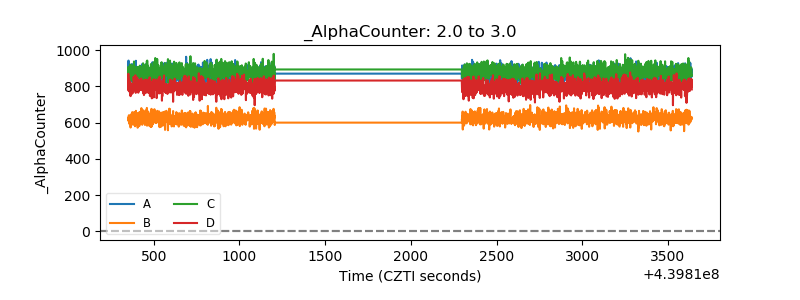 |
| _CPM_Rate |  |
| CZT Counter | 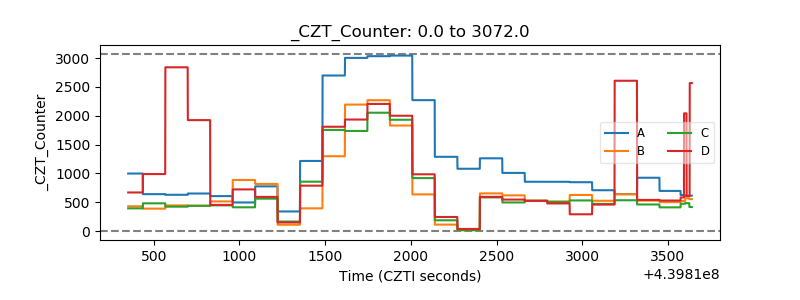 |
| +2.5 Volts monitor | 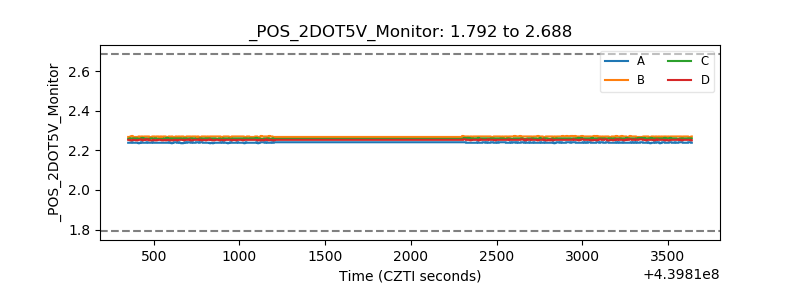 |
| +5 Volts monitor | 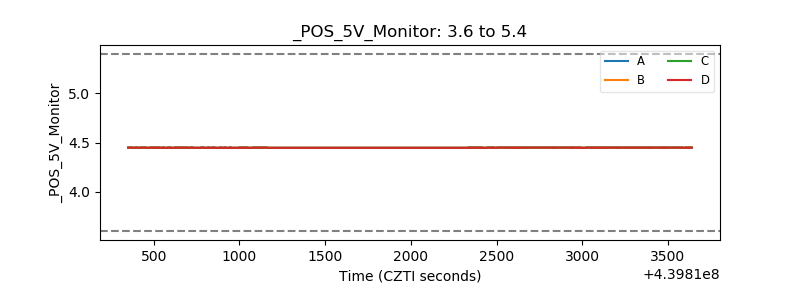 |
| _ROLL_ROT | 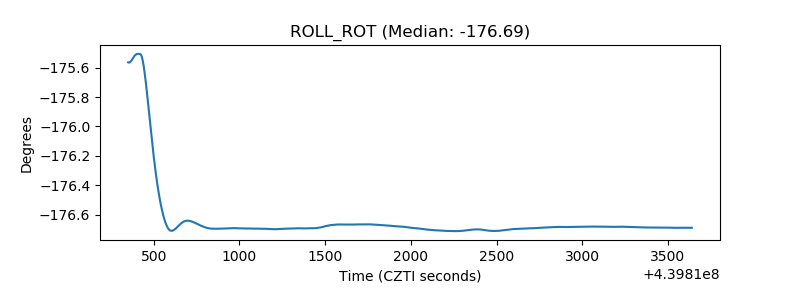 |
| _Roll_DEC | 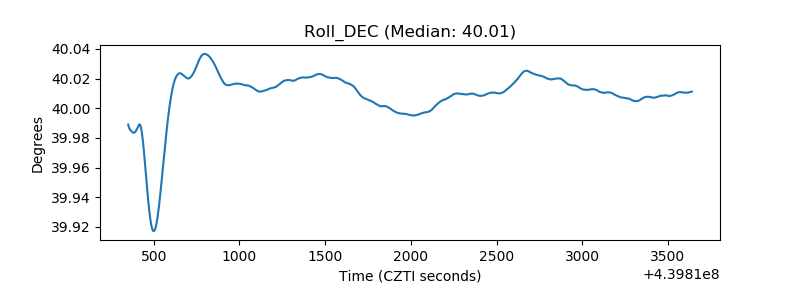 |
| _Roll_RA | 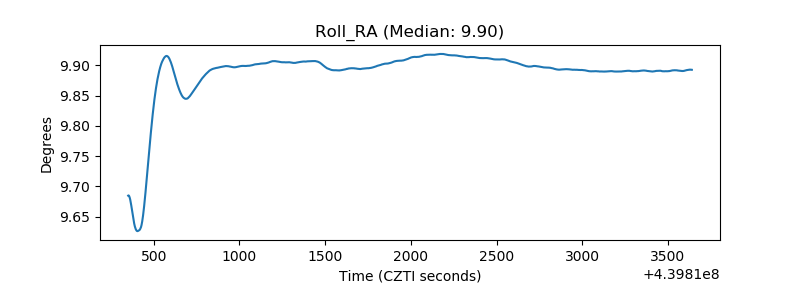 |
| Veto Counter | 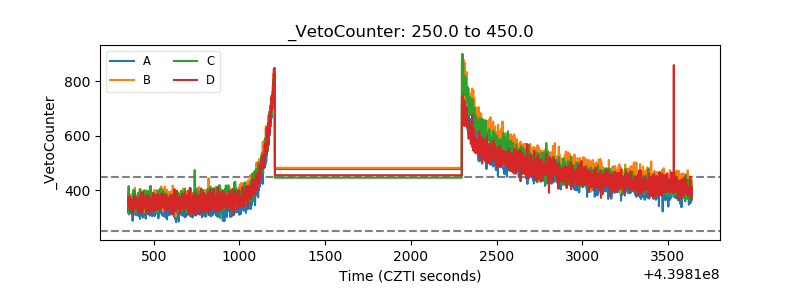 |