| Param | Original file | Final file |
|---|---|---|
| Filename | modeM0/AS1A13_004T09_9000005992_44328cztM0_level2.fits | modeM0/AS1A13_004T09_9000005992_44328cztM0_level2_quad_clean.evt |
| Size (bytes) | 449,602,560 | 103,547,520 |
| Size | 428.8 MB | 98.8 MB |
| Events in quadrant A | 4,317,172 | 713,792 |
| Events in quadrant B | 3,788,238 | 707,934 |
| Events in quadrant C | 2,867,694 | 696,442 |
| Events in quadrant D | 5,202,010 | 597,190 |
| Mode SS | |||
|---|---|---|---|
| Quadrant | BADHDUFLAG | Total packets | Discarded packets |
| A | 0 | 122 | 0 |
| B | 0 | 122 | 0 |
| C | 0 | 122 | 0 |
| D | 0 | 122 | 0 |
| Mode M9 | |||
|---|---|---|---|
| Quadrant | BADHDUFLAG | Total packets | Discarded packets |
| A | 0 | 11 | 0 |
| B | 0 | 11 | 0 |
| C | 0 | 11 | 0 |
| D | 0 | 11 | 0 |
| Mode M0 | |||
|---|---|---|---|
| Quadrant | BADHDUFLAG | Total packets | Discarded packets |
| A | 0 | 18197 | 1 |
| B | 0 | 15149 | 1 |
| C | 0 | 12594 | 1 |
| D | 0 | 19392 | 3 |
| Quadrant | Total seconds | Saturated seconds | Saturation percentage |
|---|---|---|---|
| A | 6018 | 190 | 3.157195% |
| B | 6018 | 357 | 5.932203% |
| C | 6018 | 104 | 1.728149% |
| D | 6018 | 672 | 11.166500% |
Noise dominated data is calculated using 1-second bins in cleaned event files. If a bin has >2000 counts, and if more than 50% of those come from <1% of pixels, then it is considered to be noise-dominated and hence unusable.
| Quadrant | # 1 sec bins | Bins with >0 counts | Bins with >2000 counts | High rate bins dominated by noise | Noise dominated (total time) | Noise dominated (detector-on time) | Marked lightcurve |
|---|---|---|---|---|---|---|---|
| A | 7123 | 6018 | 8 | 8 | 0.11% | 0.13% | 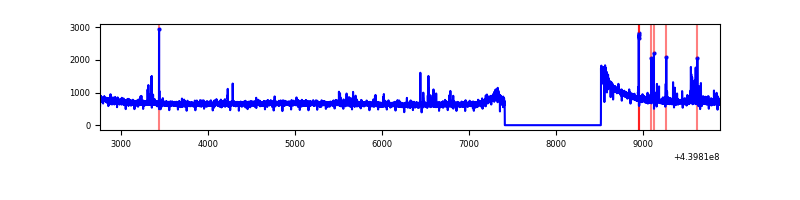 |
| B | 7123 | 6018 | 180 | 180 | 2.53% | 2.99% | 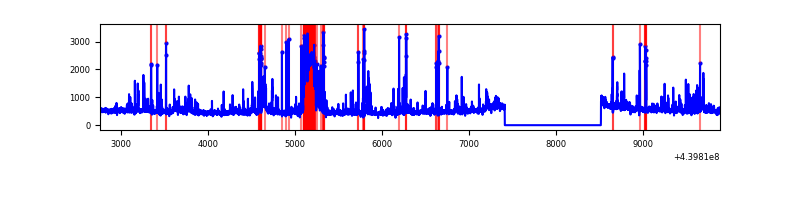 |
| C | 7123 | 6018 | 3 | 3 | 0.04% | 0.05% | 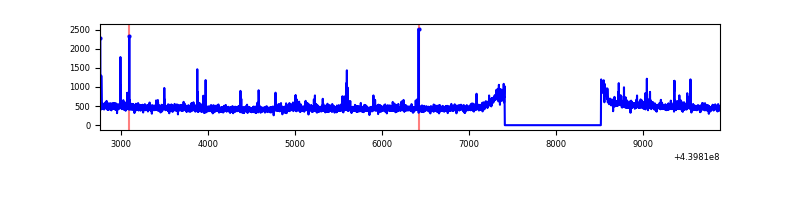 |
| D | 7124 | 6019 | 499 | 499 | 7.00% | 8.29% | 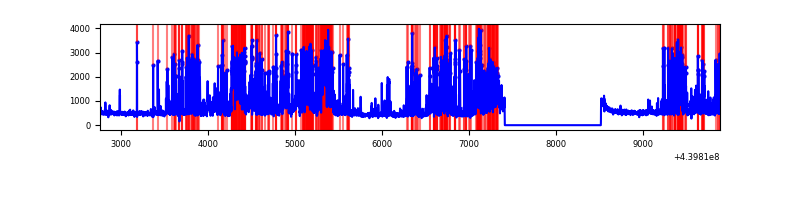 |
Top three noisy pixels from each quadrant. If the there are fewer than three noisy pixels in the level2.evt file, extra rows are filled as -1
| Pixel properties | Quadrant properties | ||||||
|---|---|---|---|---|---|---|---|
| Quadrant | DetID | PixID | Counts | Sigma | Mean | Median | Sigma |
| A | 10 | 83 | 1399910 | 9335.97 | 727 | 711 | 149.9 |
| A | 7 | 3 | 65287 | 430.87 | 727 | 711 | 149.9 |
| A | 10 | 248 | 21464 | 138.47 | 727 | 711 | 149.9 |
| B | 5 | 172 | 489052 | 3542.19 | 706 | 684 | 137.9 |
| B | 5 | 255 | 170643 | 1232.73 | 706 | 684 | 137.9 |
| B | 0 | 219 | 77998 | 560.77 | 706 | 684 | 137.9 |
| C | 14 | 254 | 71412 | 429.18 | 705 | 708 | 164.7 |
| C | 3 | 233 | 31011 | 183.94 | 705 | 708 | 164.7 |
| C | 1 | 3 | 11837 | 67.55 | 705 | 708 | 164.7 |
| D | 13 | 249 | 1331305 | 7743.18 | 687 | 666 | 171.8 |
| D | 1 | 20 | 289878 | 1682.97 | 687 | 666 | 171.8 |
| D | 5 | 222 | 275302 | 1598.15 | 687 | 666 | 171.8 |
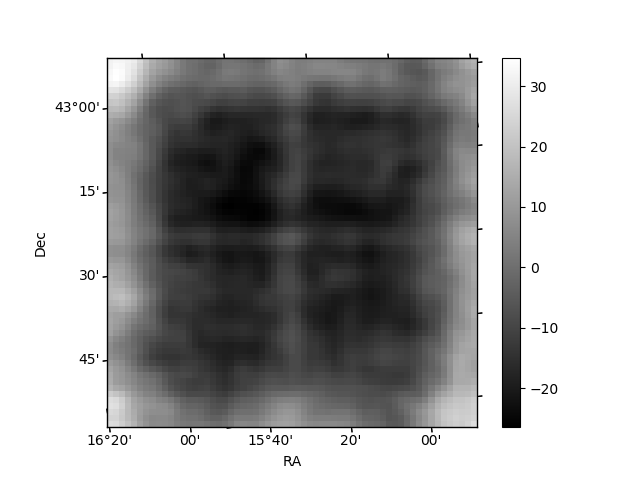
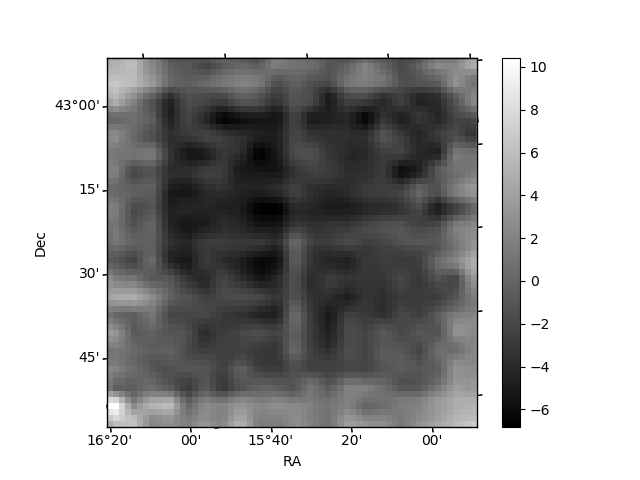
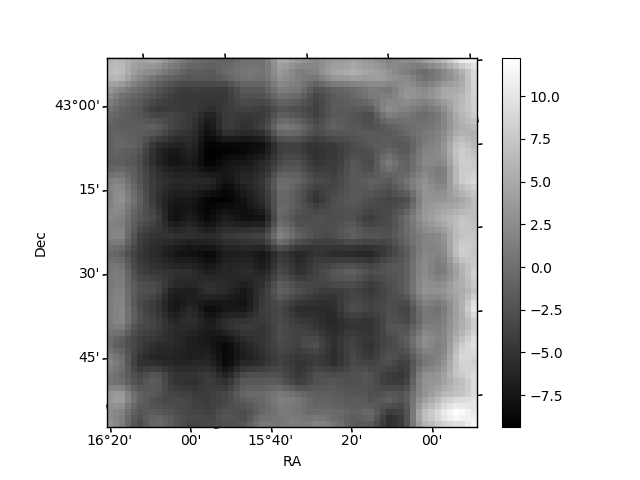
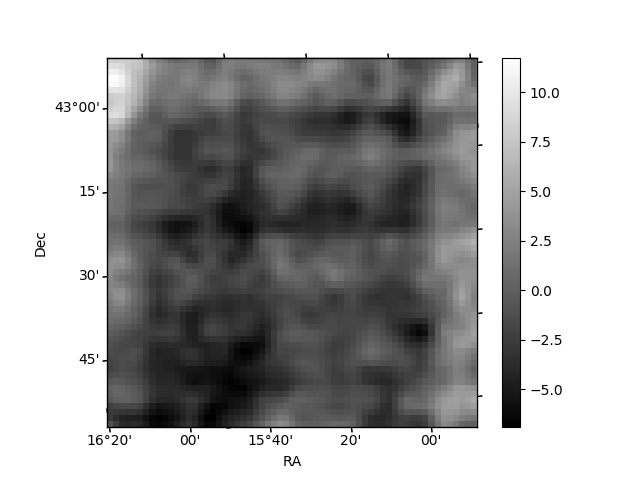
Histogram calculated using DETX and DETY for each event in the final _common_clean file
| Quadrant A | 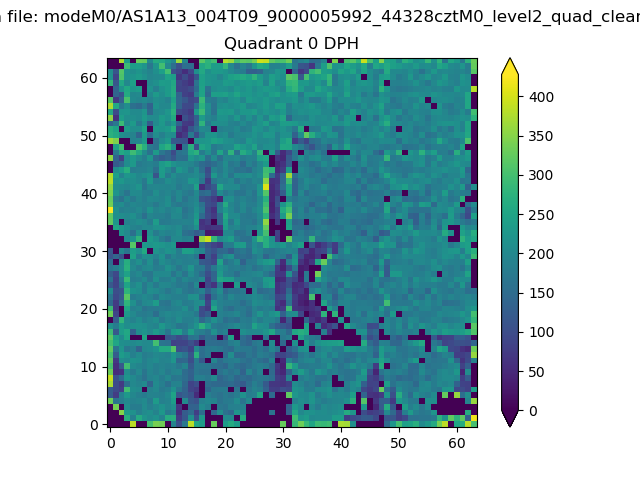 |
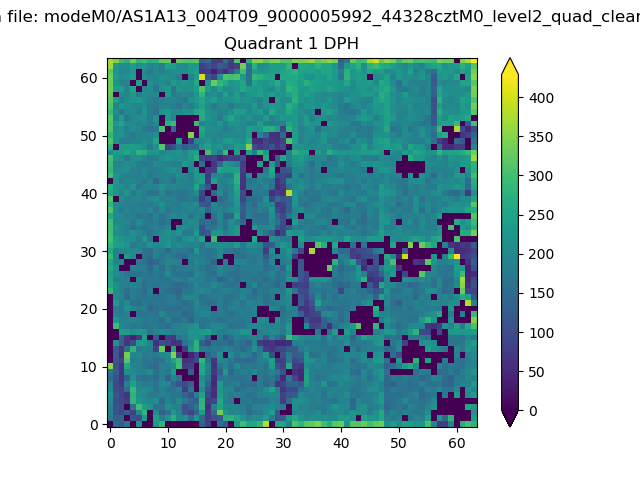 |
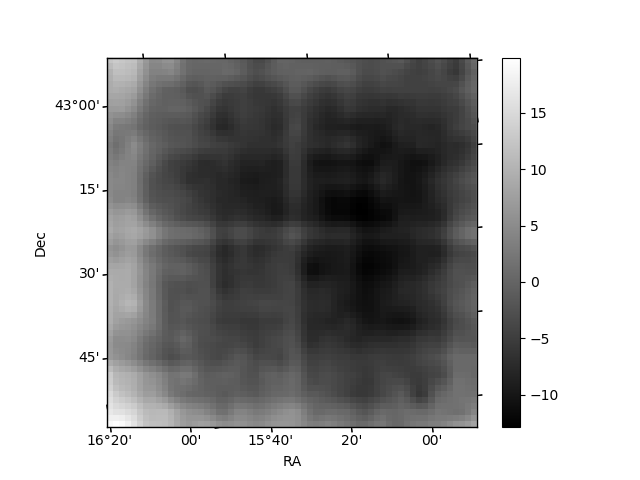
Quadrant B |
|---|---|---|---|
| Quadrant D | 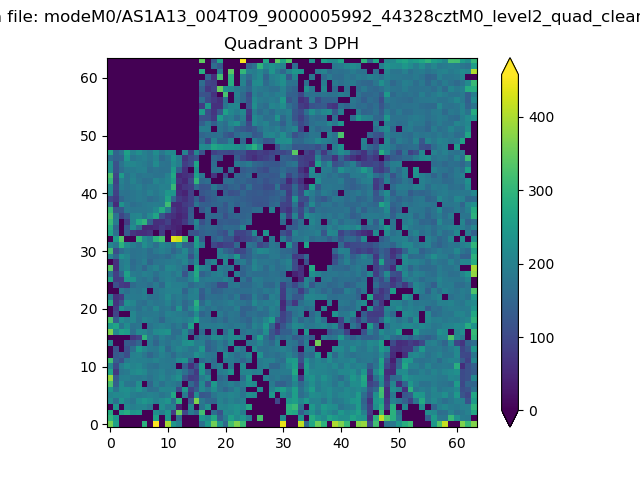 |
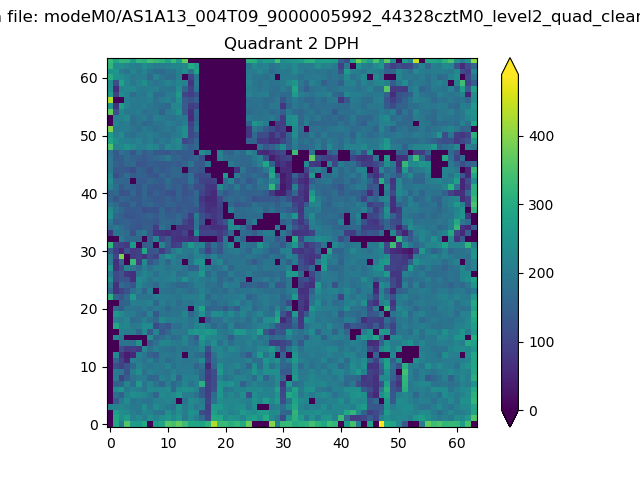 |
Quadrant C |
| Plot type | Count rate plots | Images |
|---|---|---|
| Comparison with Poisson distribution Blue bars denote a histogram of data divided into 1 sec bins. Red curve is a Poisson curve with rate = median count rate of data. |
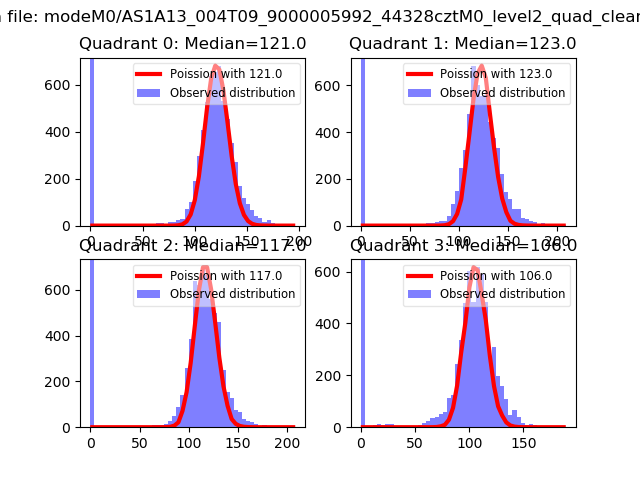 |
 |
| Quadrant-wise count rates Data is divided into 100 sec bins |
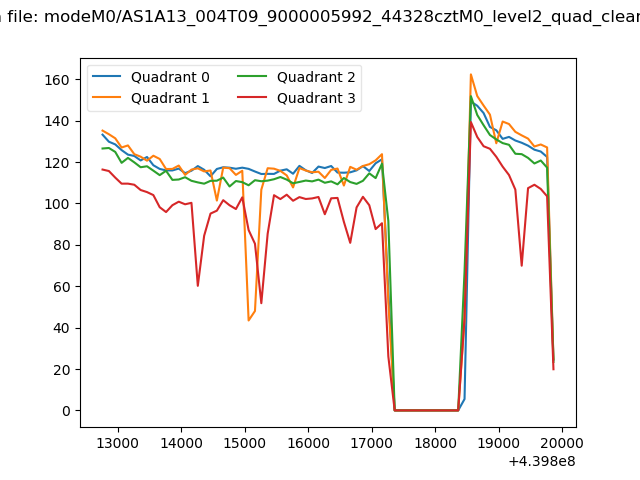 |
|
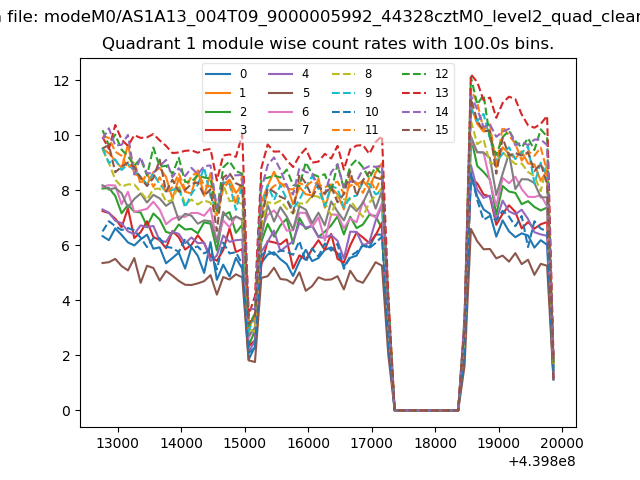
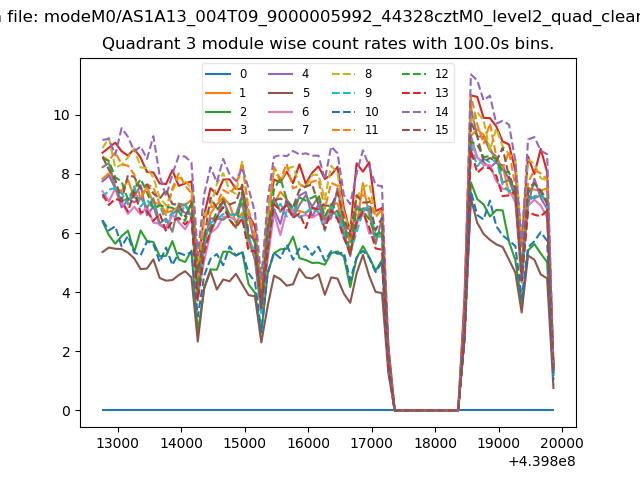
| Module-wise count rates for Quadrant A Data is divided into 100 sec bins |
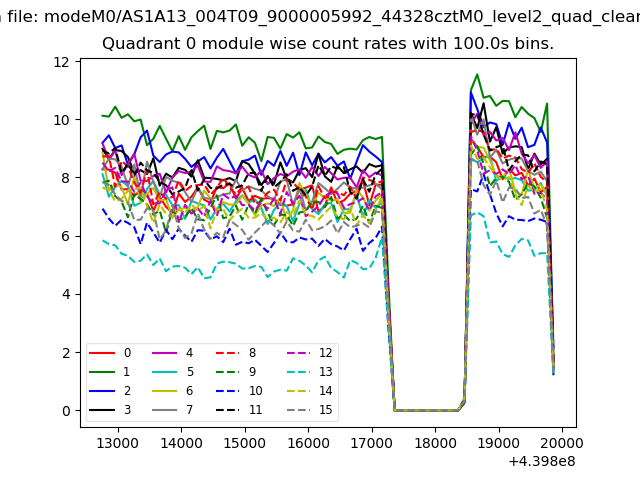 |
 |
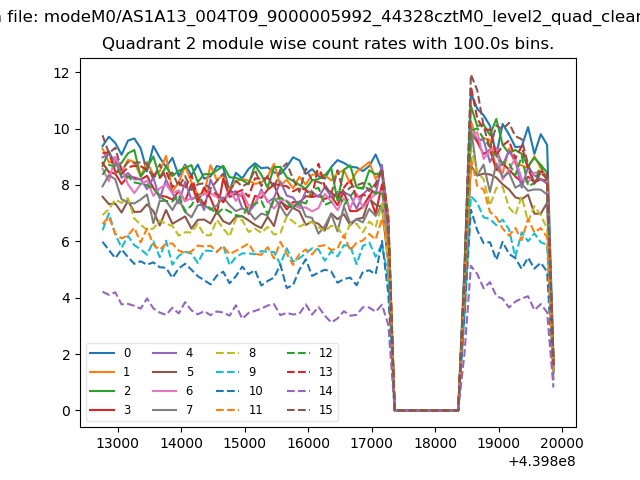
| Module-wise count rates for Quadrant B Data is divided into 100 sec bins |
 |
 |
| Module-wise count rates for Quadrant C Data is divided into 100 sec bins |
 |
 |
| Module-wise count rates for Quadrant D Data is divided into 100 sec bins |
 |
 |
| Parameter | Plot |
|---|---|
| CZT HV Monitor | 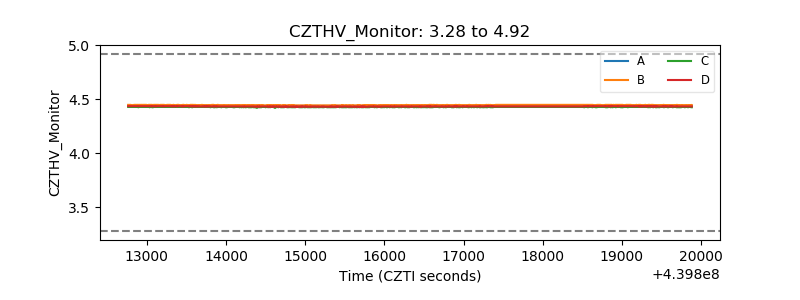 |
| D_VDD | 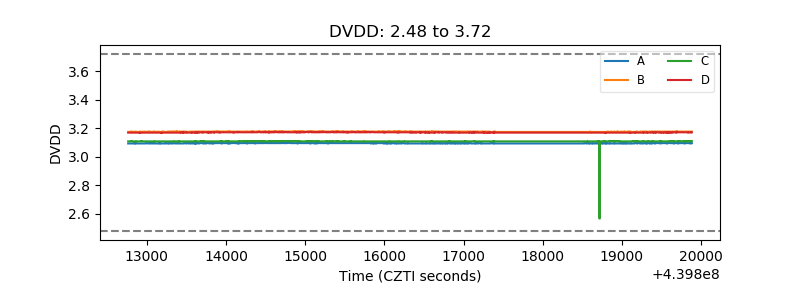 |
| Temperature 1 | 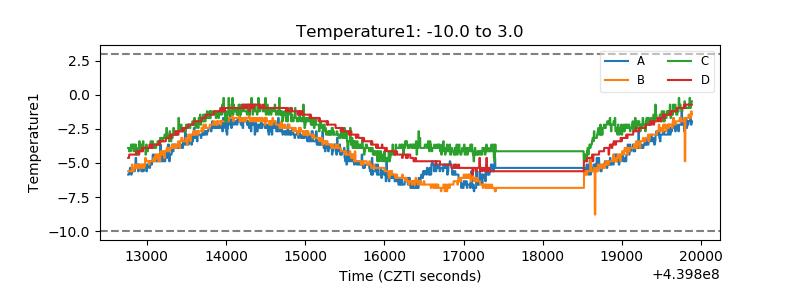 |
| Veto HV Monitor | 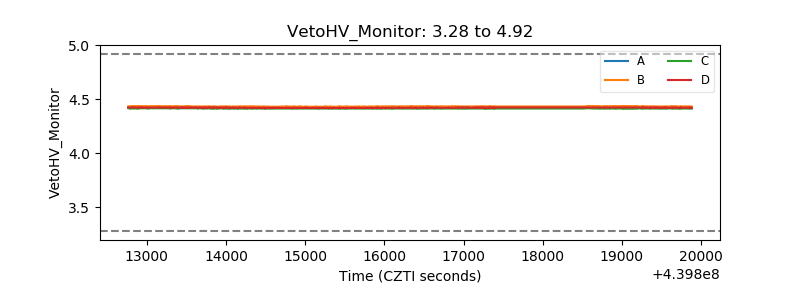 |
| Veto LLD | 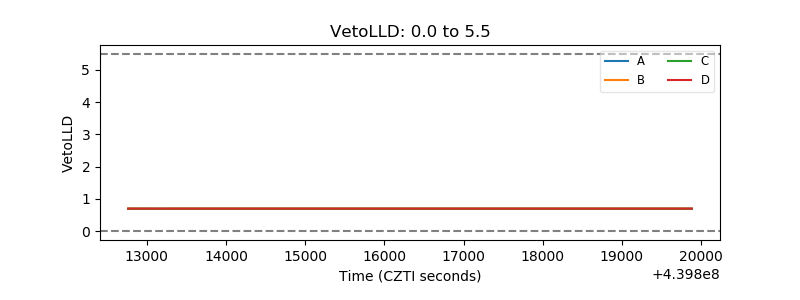 |
| Alpha Counter | 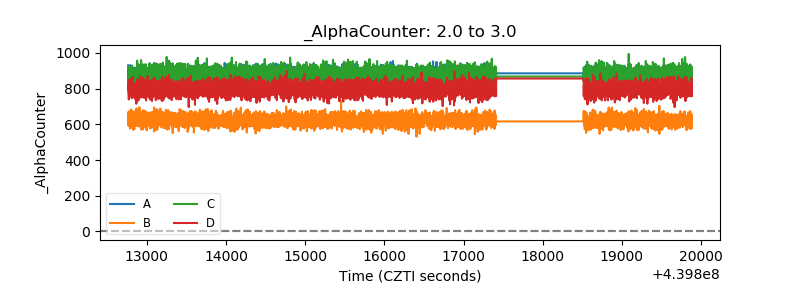 |
| _CPM_Rate |  |
| CZT Counter | 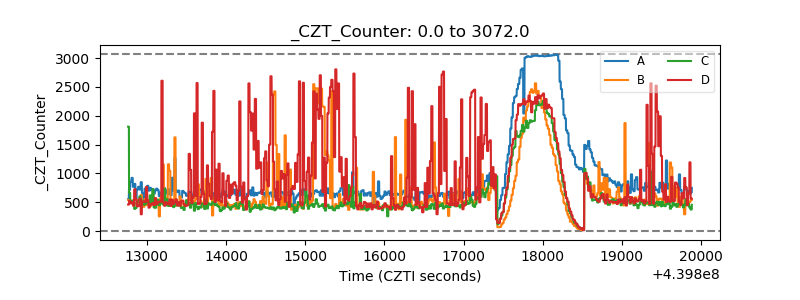 |
| +2.5 Volts monitor | 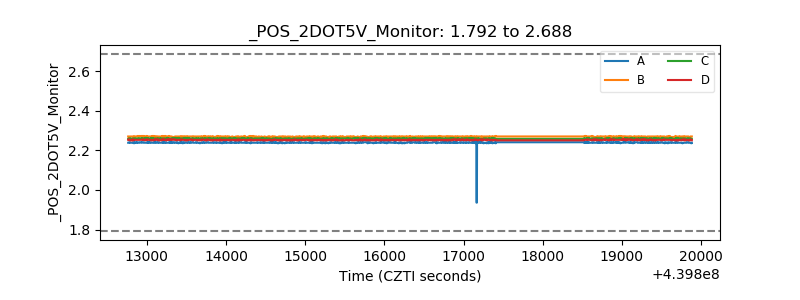 |
| +5 Volts monitor | 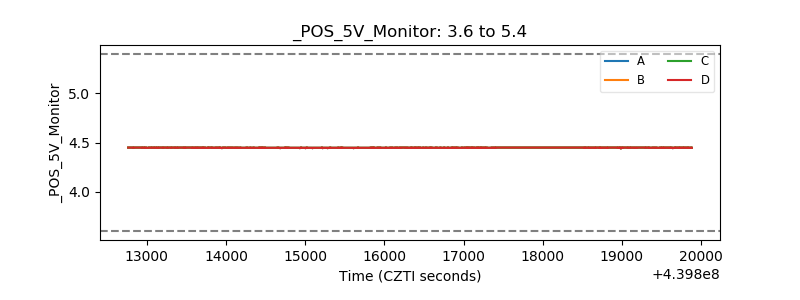 |
| _ROLL_ROT | 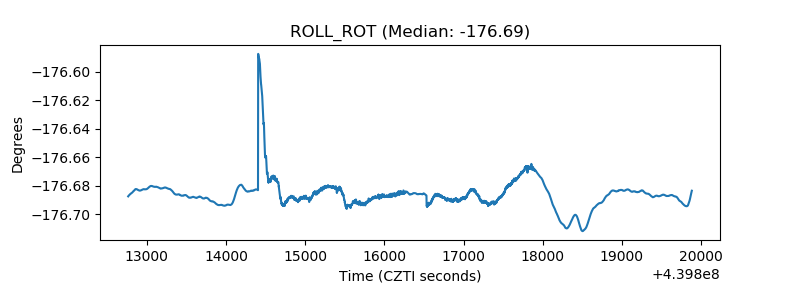 |
| _Roll_DEC | 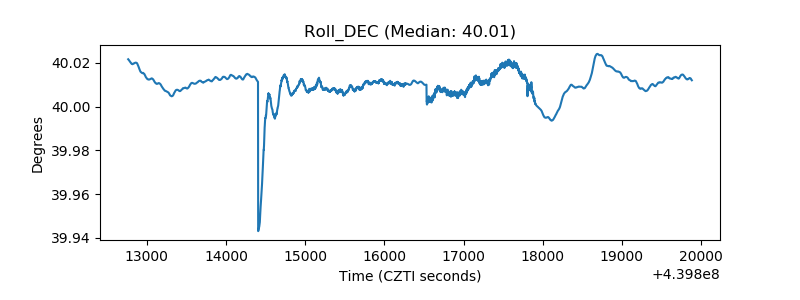 |
| _Roll_RA | 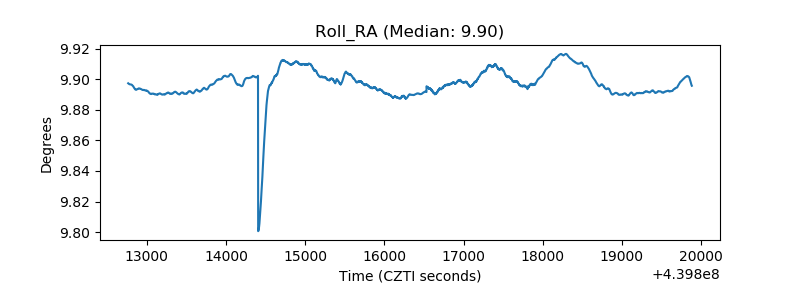 |
| Veto Counter | 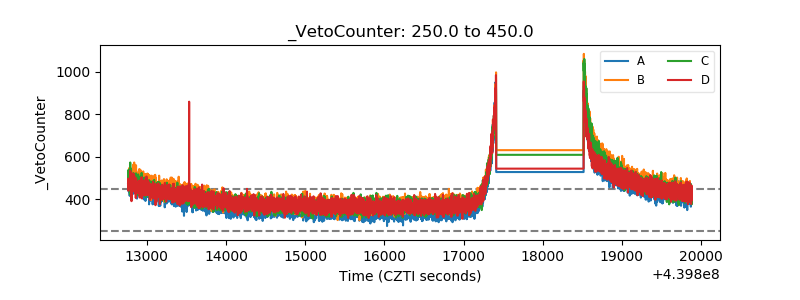 |