| Param | Original file | Final file |
|---|---|---|
| Filename | modeM0/AS1A13_004T09_9000005992_44329cztM0_level2.fits | modeM0/AS1A13_004T09_9000005992_44329cztM0_level2_quad_clean.evt |
| Size (bytes) | 441,184,320 | 102,755,520 |
| Size | 420.7 MB | 98.0 MB |
| Events in quadrant A | 4,316,429 | 712,635 |
| Events in quadrant B | 3,643,839 | 701,100 |
| Events in quadrant C | 2,793,233 | 686,757 |
| Events in quadrant D | 5,119,803 | 599,326 |
| Mode SS | |||
|---|---|---|---|
| Quadrant | BADHDUFLAG | Total packets | Discarded packets |
| A | 0 | 120 | 0 |
| B | 0 | 120 | 0 |
| C | 0 | 120 | 0 |
| D | 0 | 120 | 0 |
| Mode M9 | |||
|---|---|---|---|
| Quadrant | BADHDUFLAG | Total packets | Discarded packets |
| A | 0 | 12 | 0 |
| B | 0 | 12 | 0 |
| C | 0 | 12 | 0 |
| D | 0 | 12 | 0 |
| Mode M0 | |||
|---|---|---|---|
| Quadrant | BADHDUFLAG | Total packets | Discarded packets |
| A | 0 | 17946 | 1 |
| B | 0 | 14618 | 1 |
| C | 0 | 12295 | 1 |
| D | 0 | 19132 | 1 |
| Quadrant | Total seconds | Saturated seconds | Saturation percentage |
|---|---|---|---|
| A | 5891 | 148 | 2.512307% |
| B | 5892 | 324 | 5.498982% |
| C | 5892 | 56 | 0.950441% |
| D | 5892 | 558 | 9.470468% |
Noise dominated data is calculated using 1-second bins in cleaned event files. If a bin has >2000 counts, and if more than 50% of those come from <1% of pixels, then it is considered to be noise-dominated and hence unusable.
| Quadrant | # 1 sec bins | Bins with >0 counts | Bins with >2000 counts | High rate bins dominated by noise | Noise dominated (total time) | Noise dominated (detector-on time) | Marked lightcurve |
|---|---|---|---|---|---|---|---|
| A | 7106 | 5891 | 7 | 7 | 0.10% | 0.12% | 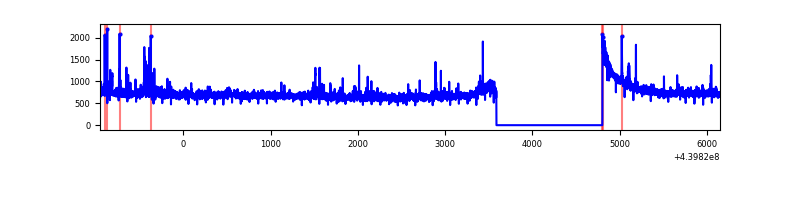 |
| B | 7107 | 5892 | 193 | 193 | 2.72% | 3.28% | 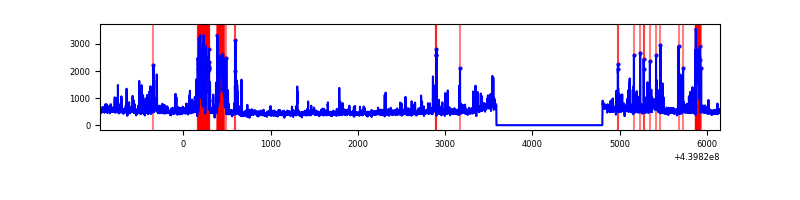 |
| C | 7107 | 5892 | 5 | 5 | 0.07% | 0.08% | 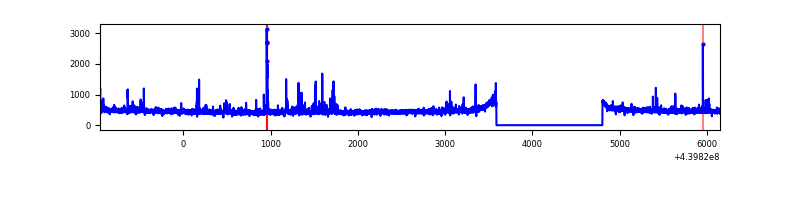 |
| D | 7107 | 5892 | 436 | 436 | 6.13% | 7.40% | 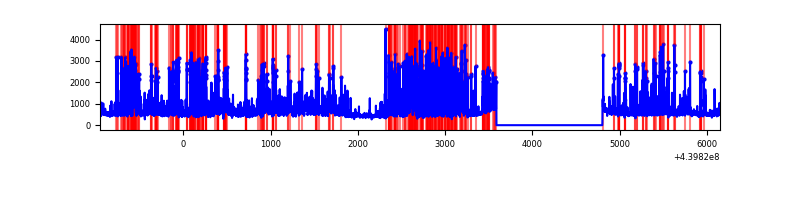 |
Top three noisy pixels from each quadrant. If the there are fewer than three noisy pixels in the level2.evt file, extra rows are filled as -1
| Pixel properties | Quadrant properties | ||||||
|---|---|---|---|---|---|---|---|
| Quadrant | DetID | PixID | Counts | Sigma | Mean | Median | Sigma |
| A | 10 | 83 | 1445959 | 9979.9 | 707 | 695 | 144.8 |
| A | 7 | 3 | 59404 | 405.4 | 707 | 695 | 144.8 |
| A | 10 | 248 | 36151 | 244.83 | 707 | 695 | 144.8 |
| B | 5 | 172 | 584577 | 4395.63 | 683 | 663 | 132.8 |
| B | 5 | 255 | 176567 | 1324.18 | 683 | 663 | 132.8 |
| B | 0 | 199 | 58091 | 432.31 | 683 | 663 | 132.8 |
| C | 14 | 254 | 111732 | 701.69 | 681 | 686 | 158.3 |
| C | 1 | 3 | 11028 | 65.35 | 681 | 686 | 158.3 |
| C | 3 | 233 | 9250 | 54.11 | 681 | 686 | 158.3 |
| D | 13 | 249 | 1421565 | 8480.46 | 667 | 647 | 167.6 |
| D | 2 | 153 | 509197 | 3035.18 | 667 | 647 | 167.6 |
| D | 5 | 171 | 168711 | 1003.06 | 667 | 647 | 167.6 |
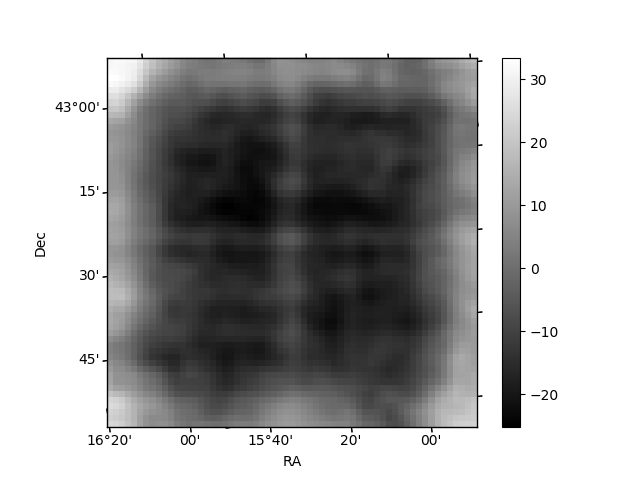
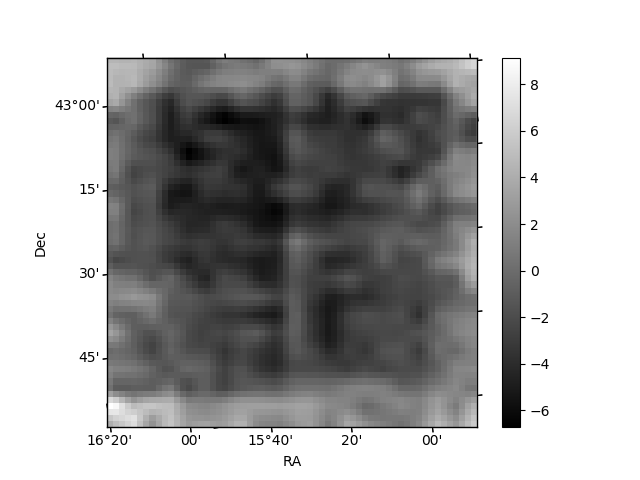
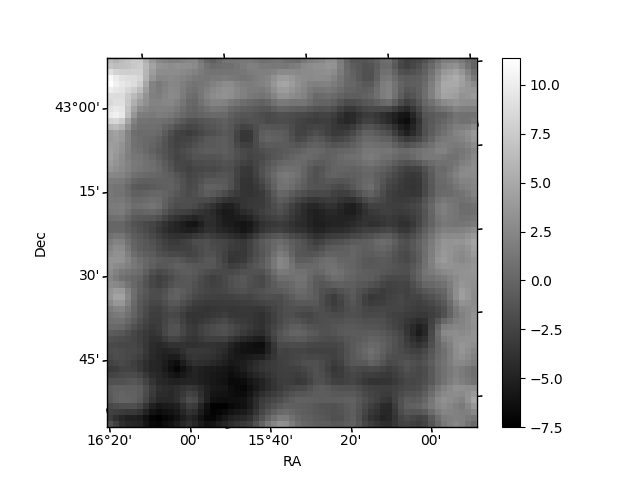
Histogram calculated using DETX and DETY for each event in the final _common_clean file
| Quadrant A | 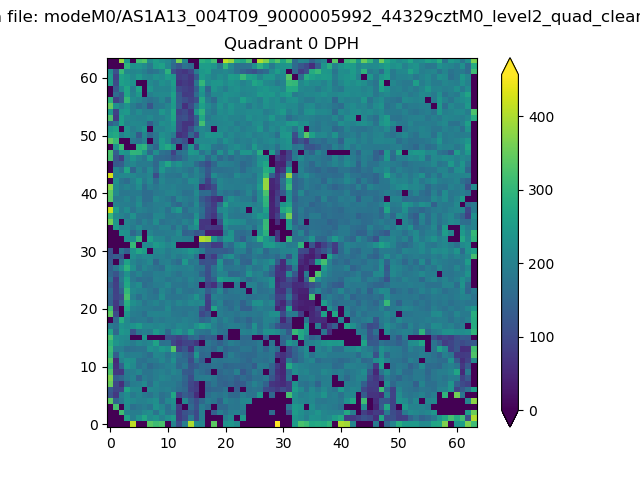 |
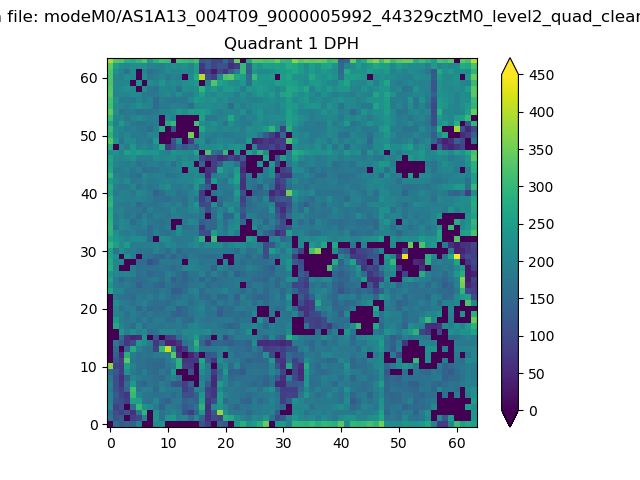 |
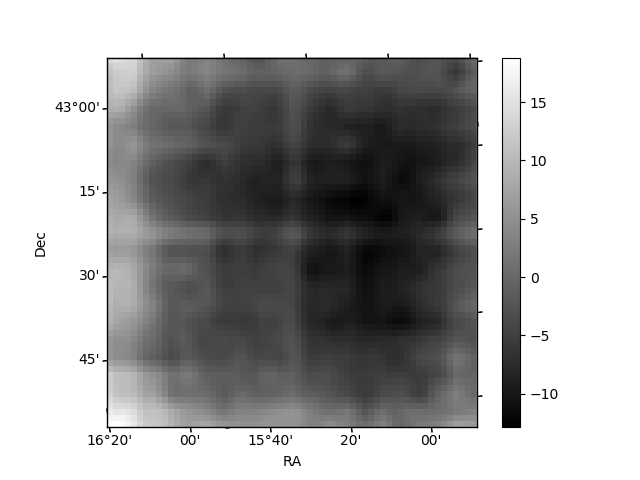
Quadrant B |
|---|---|---|---|
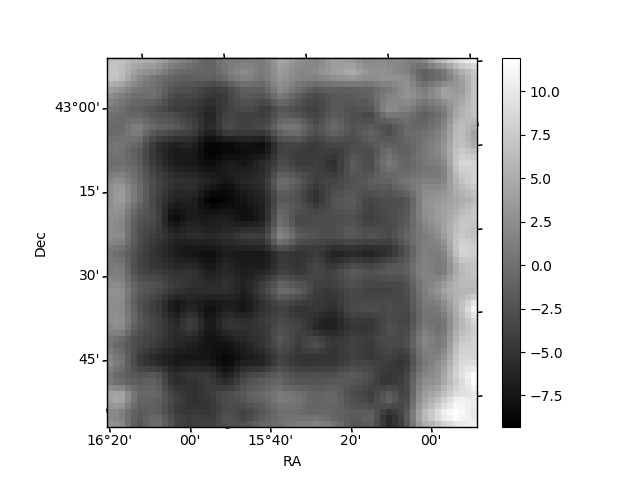
| Quadrant D | 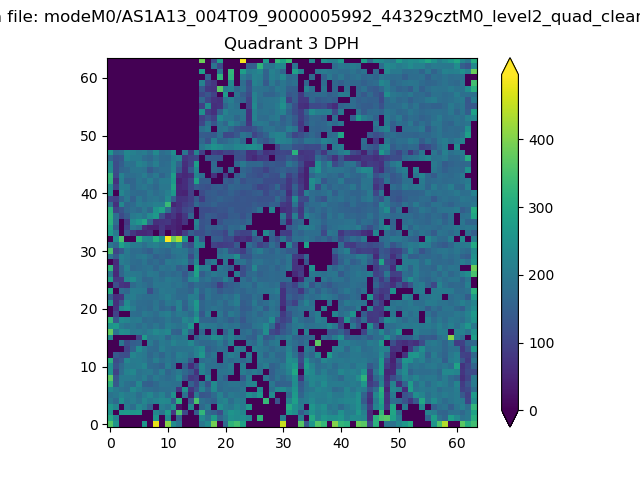 |
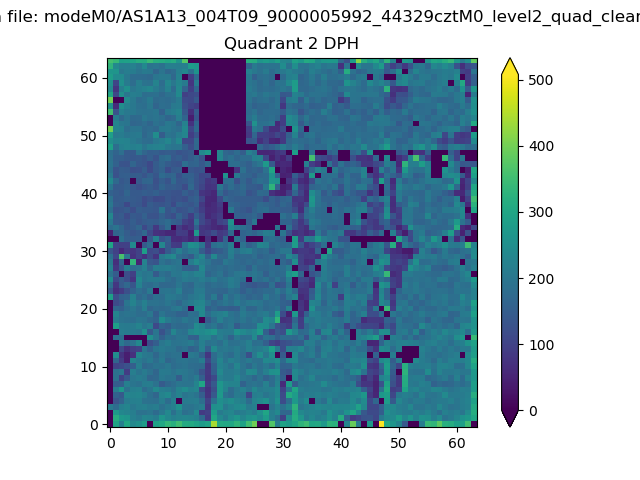 |
Quadrant C |
| Plot type | Count rate plots | Images |
|---|---|---|
| Comparison with Poisson distribution Blue bars denote a histogram of data divided into 1 sec bins. Red curve is a Poisson curve with rate = median count rate of data. |
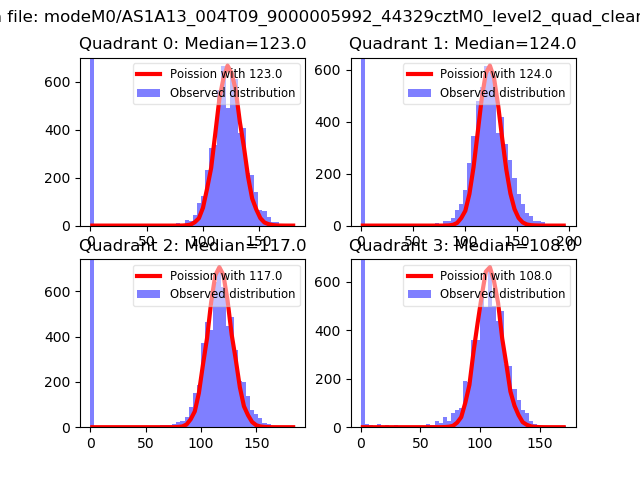 |
 |
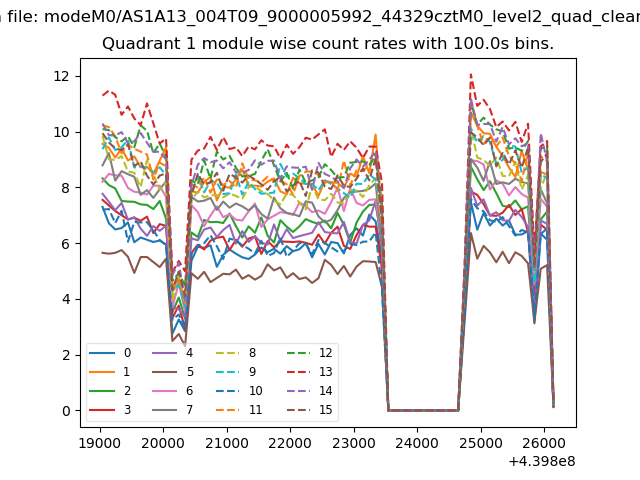
| Quadrant-wise count rates Data is divided into 100 sec bins |
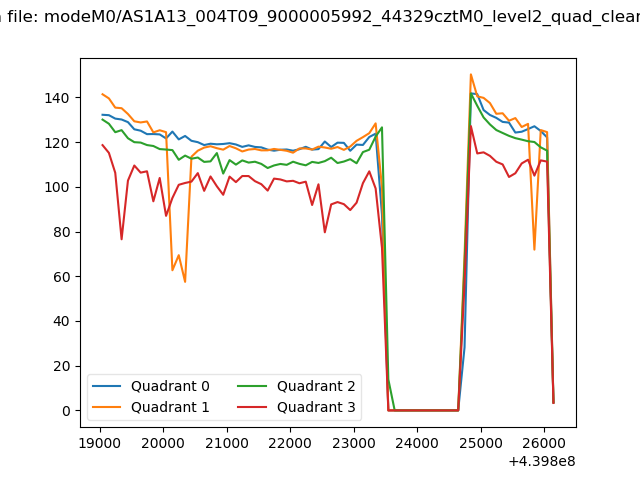 |
|
| Module-wise count rates for Quadrant A Data is divided into 100 sec bins |
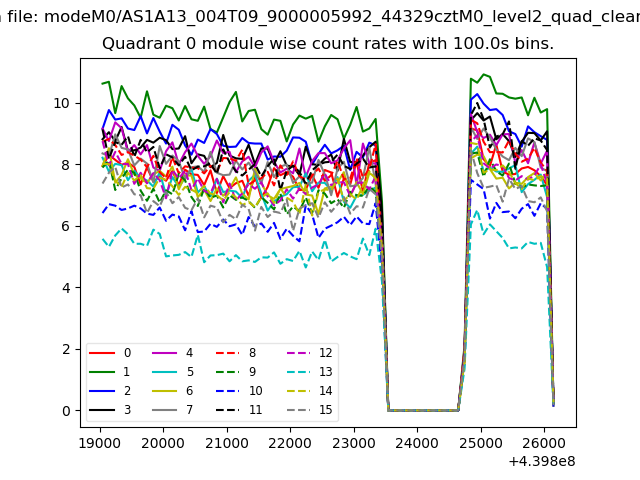 |
 |
| Module-wise count rates for Quadrant B Data is divided into 100 sec bins |
 |
 |
| Module-wise count rates for Quadrant C Data is divided into 100 sec bins |
 |
 |
| Module-wise count rates for Quadrant D Data is divided into 100 sec bins |
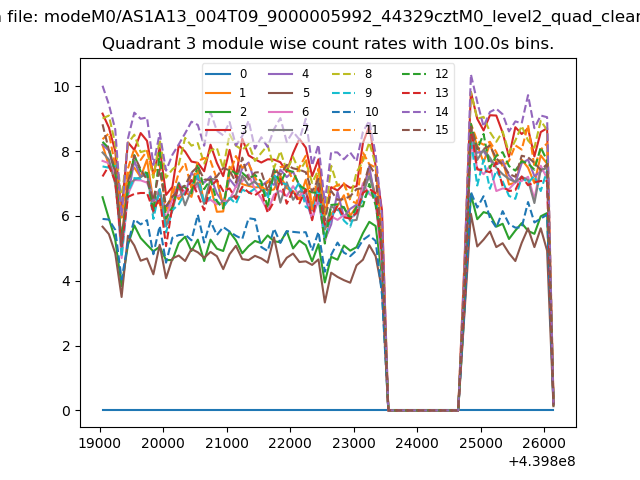 |
 |
| Parameter | Plot |
|---|---|
| CZT HV Monitor | 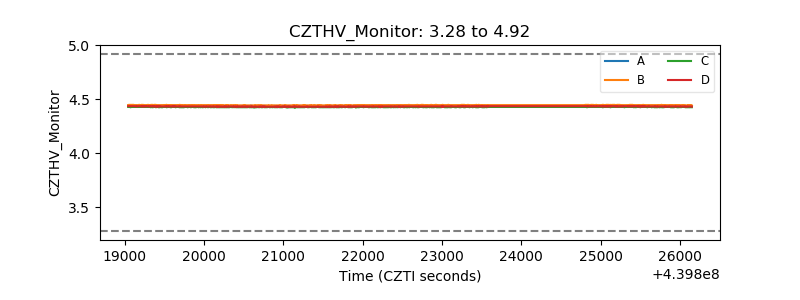 |
| D_VDD | 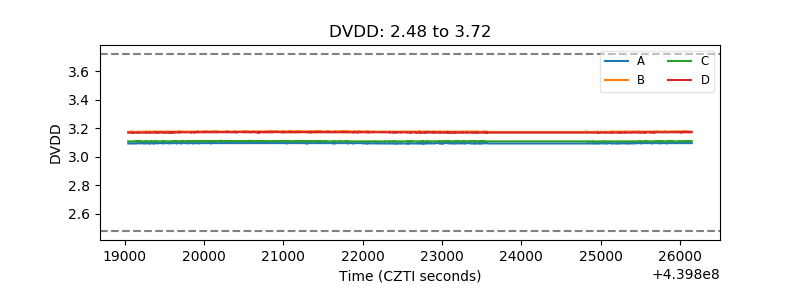 |
| Temperature 1 | 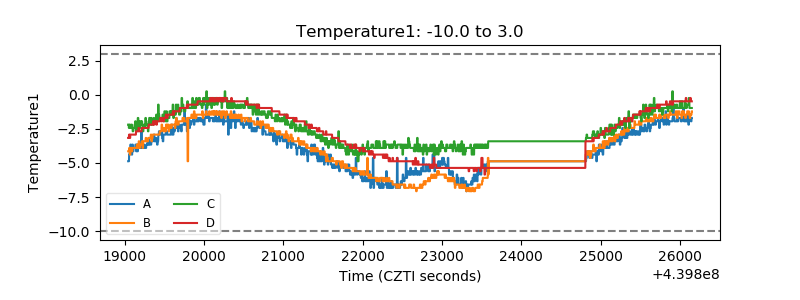 |
| Veto HV Monitor | 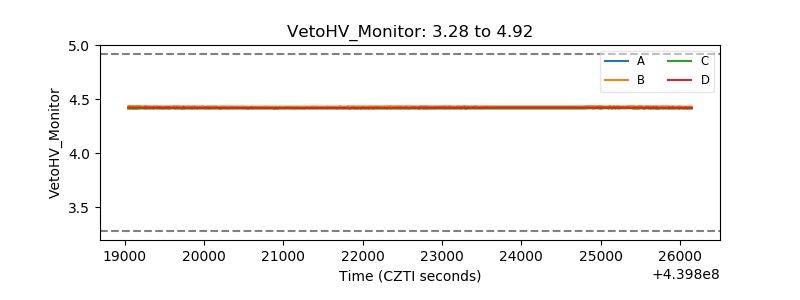 |
| Veto LLD | 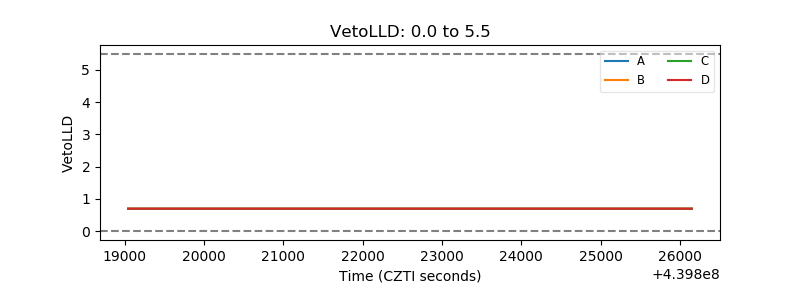 |
| Alpha Counter | 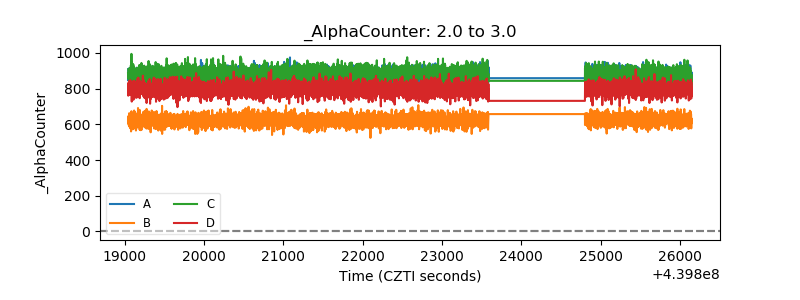 |
| _CPM_Rate | 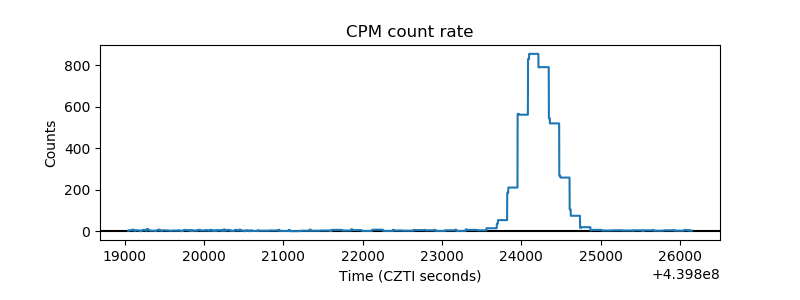 |
| CZT Counter | 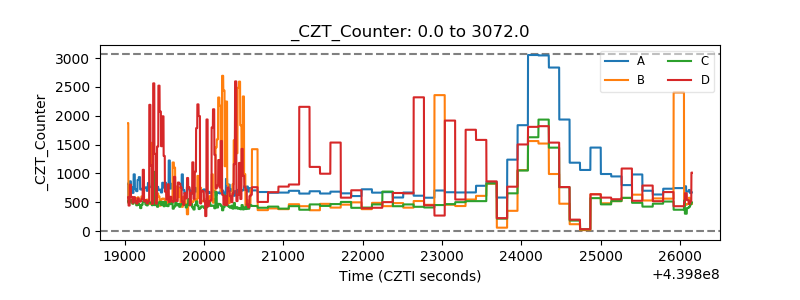 |
| +2.5 Volts monitor | 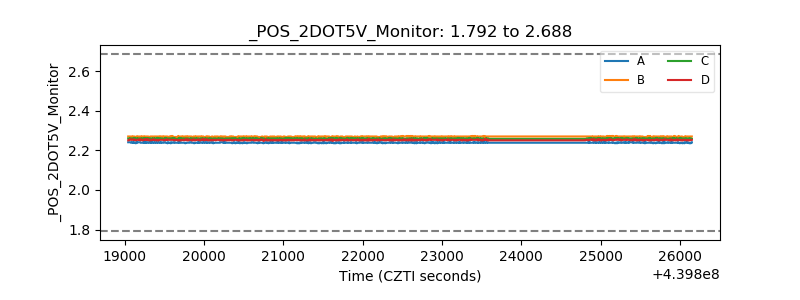 |
| +5 Volts monitor | 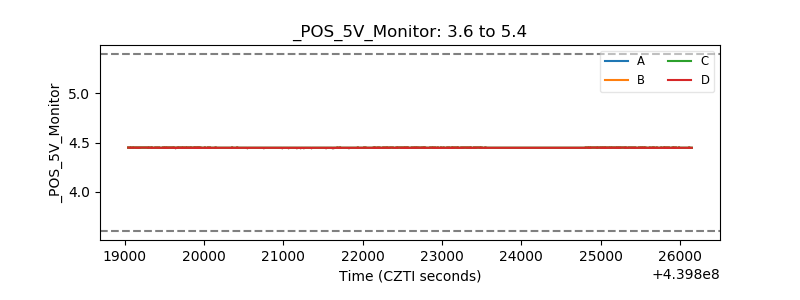 |
| _ROLL_ROT | 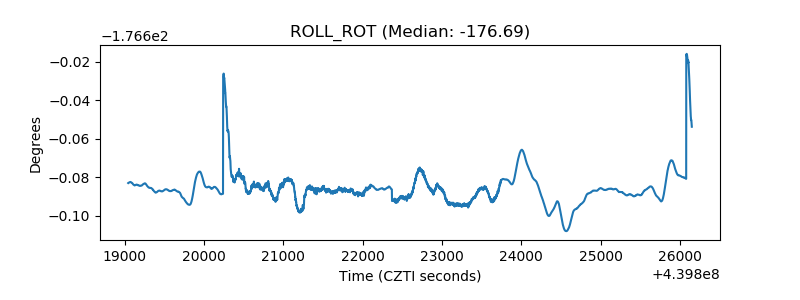 |
| _Roll_DEC | 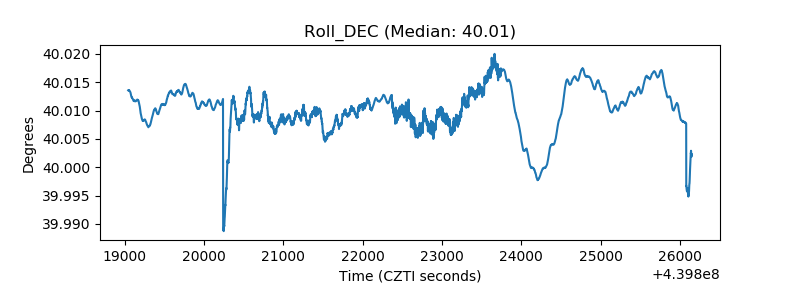 |
| _Roll_RA | 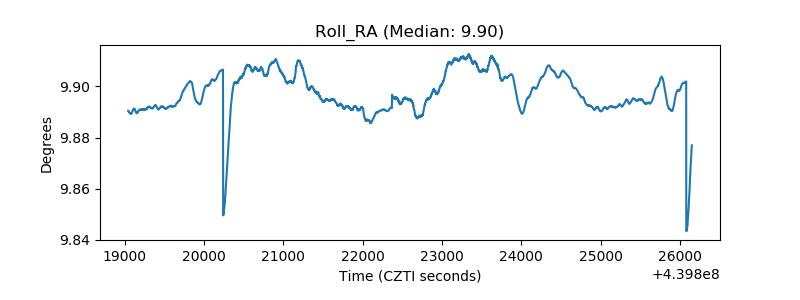 |
| Veto Counter | 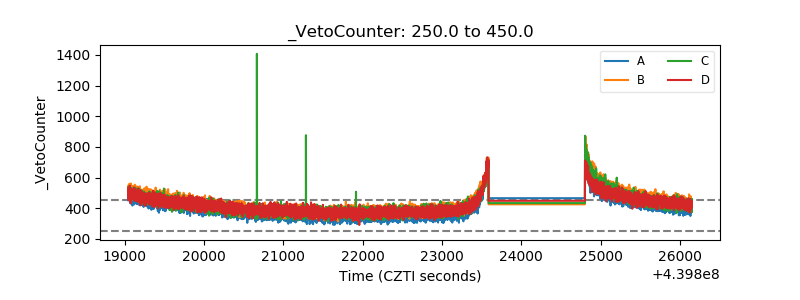 |