| Param | Original file | Final file |
|---|---|---|
| Filename | modeM0/AS1A13_004T09_9000005992_44331cztM0_level2.fits | modeM0/AS1A13_004T09_9000005992_44331cztM0_level2_quad_clean.evt |
| Size (bytes) | 461,689,920 | 108,864,000 |
| Size | 440.3 MB | 103.8 MB |
| Events in quadrant A | 4,618,339 | 737,700 |
| Events in quadrant B | 3,422,487 | 752,563 |
| Events in quadrant C | 3,030,533 | 722,775 |
| Events in quadrant D | 5,511,752 | 628,078 |
| Mode SS | |||
|---|---|---|---|
| Quadrant | BADHDUFLAG | Total packets | Discarded packets |
| A | 0 | 132 | 0 |
| B | 0 | 132 | 0 |
| C | 0 | 132 | 0 |
| D | 0 | 132 | 0 |
| Mode M9 | |||
|---|---|---|---|
| Quadrant | BADHDUFLAG | Total packets | Discarded packets |
| A | 0 | 10 | 0 |
| B | 0 | 10 | 0 |
| C | 0 | 10 | 0 |
| D | 0 | 10 | 0 |
| Mode M0 | |||
|---|---|---|---|
| Quadrant | BADHDUFLAG | Total packets | Discarded packets |
| A | 0 | 19196 | 1 |
| B | 0 | 14589 | 1 |
| C | 0 | 13726 | 1 |
| D | 0 | 20830 | 1 |
| Quadrant | Total seconds | Saturated seconds | Saturation percentage |
|---|---|---|---|
| A | 6527 | 154 | 2.359430% |
| B | 6528 | 142 | 2.175245% |
| C | 6528 | 59 | 0.903799% |
| D | 6528 | 597 | 9.145221% |
Noise dominated data is calculated using 1-second bins in cleaned event files. If a bin has >2000 counts, and if more than 50% of those come from <1% of pixels, then it is considered to be noise-dominated and hence unusable.
| Quadrant | # 1 sec bins | Bins with >0 counts | Bins with >2000 counts | High rate bins dominated by noise | Noise dominated (total time) | Noise dominated (detector-on time) | Marked lightcurve |
|---|---|---|---|---|---|---|---|
| A | 7497 | 6527 | 6 | 6 | 0.08% | 0.09% | 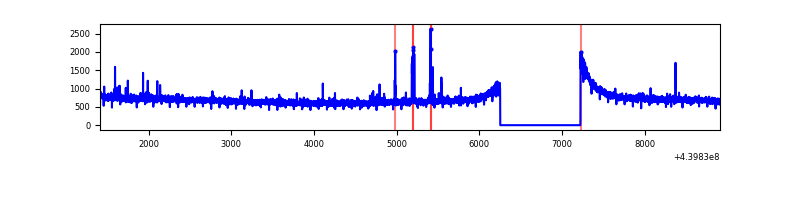 |
| B | 7498 | 6528 | 37 | 37 | 0.49% | 0.57% | 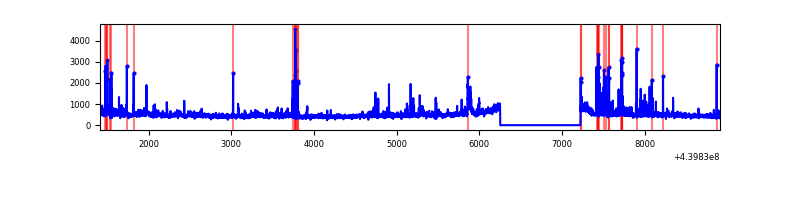 |
| C | 7498 | 6529 | 11 | 11 | 0.15% | 0.17% | 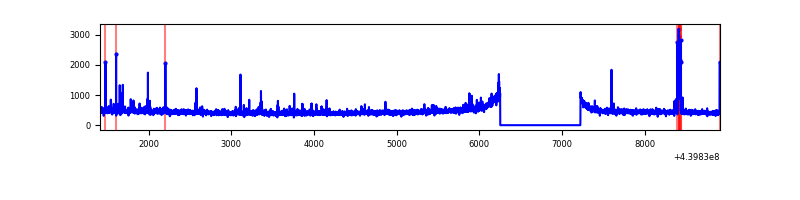 |
| D | 7498 | 6528 | 493 | 493 | 6.58% | 7.55% | 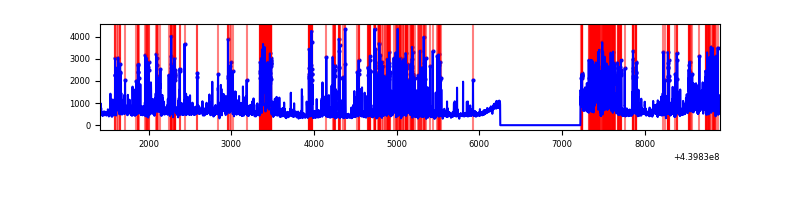 |
Top three noisy pixels from each quadrant. If the there are fewer than three noisy pixels in the level2.evt file, extra rows are filled as -1
| Pixel properties | Quadrant properties | ||||||
|---|---|---|---|---|---|---|---|
| Quadrant | DetID | PixID | Counts | Sigma | Mean | Median | Sigma |
| A | 10 | 83 | 1622536 | 10454.07 | 752 | 734 | 155.1 |
| A | 15 | 223 | 32514 | 204.85 | 752 | 734 | 155.1 |
| A | 7 | 3 | 31813 | 200.33 | 752 | 734 | 155.1 |
| B | 5 | 172 | 190514 | 1302.31 | 742 | 720 | 145.7 |
| B | 0 | 219 | 66453 | 451.04 | 742 | 720 | 145.7 |
| B | 0 | 199 | 53646 | 363.16 | 742 | 720 | 145.7 |
| C | 14 | 254 | 128074 | 731.55 | 738 | 742 | 174.1 |
| C | 3 | 233 | 17820 | 98.12 | 738 | 742 | 174.1 |
| C | 1 | 3 | 11126 | 59.66 | 738 | 742 | 174.1 |
| D | 13 | 249 | 1054496 | 5848.67 | 721 | 699 | 180.2 |
| D | 2 | 153 | 364859 | 2021.12 | 721 | 699 | 180.2 |
| D | 5 | 171 | 268557 | 1486.64 | 721 | 699 | 180.2 |
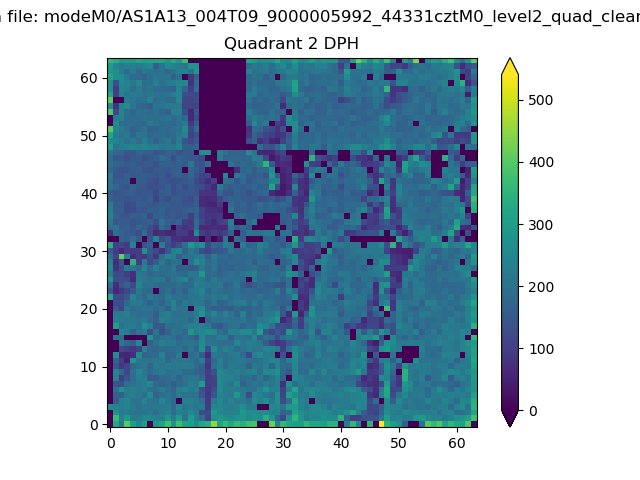
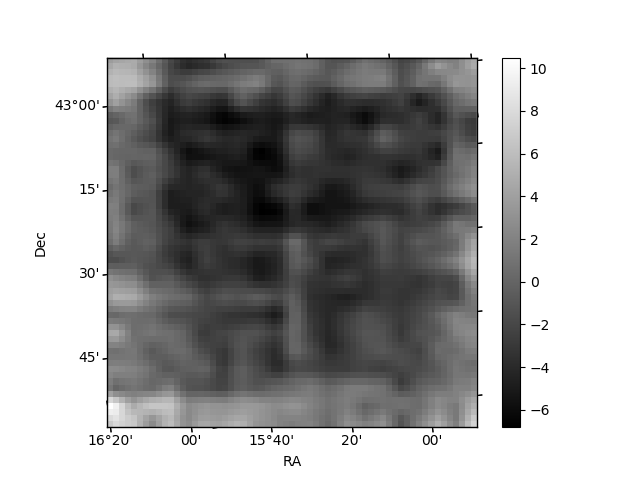
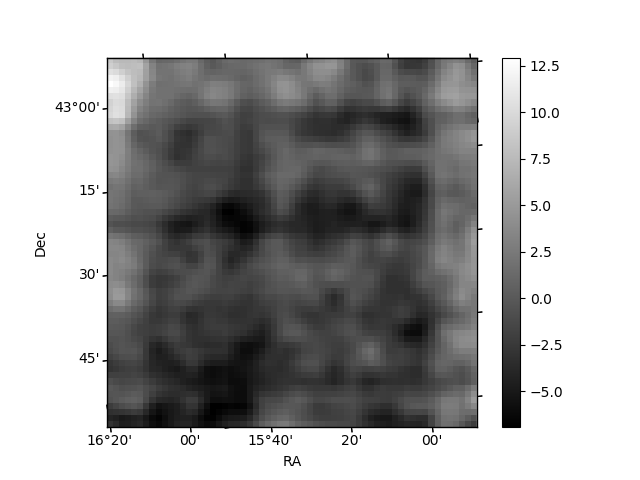
Histogram calculated using DETX and DETY for each event in the final _common_clean file
| Quadrant A |  |
 |
Quadrant B |
|---|---|---|---|
| Quadrant D | 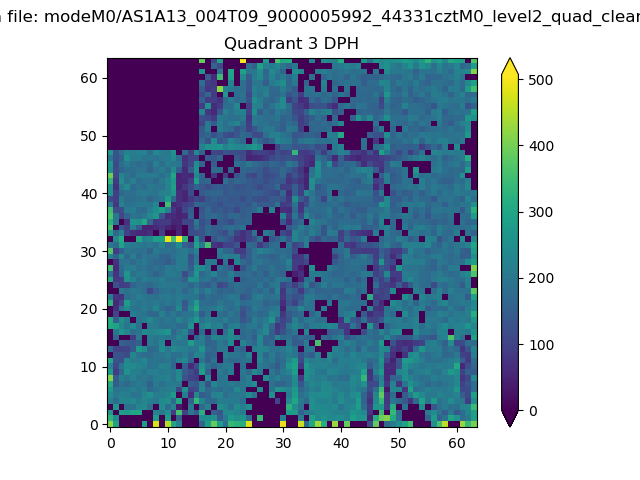 |
 |
Quadrant C |
| Plot type | Count rate plots | Images |
|---|---|---|
| Comparison with Poisson distribution Blue bars denote a histogram of data divided into 1 sec bins. Red curve is a Poisson curve with rate = median count rate of data. |
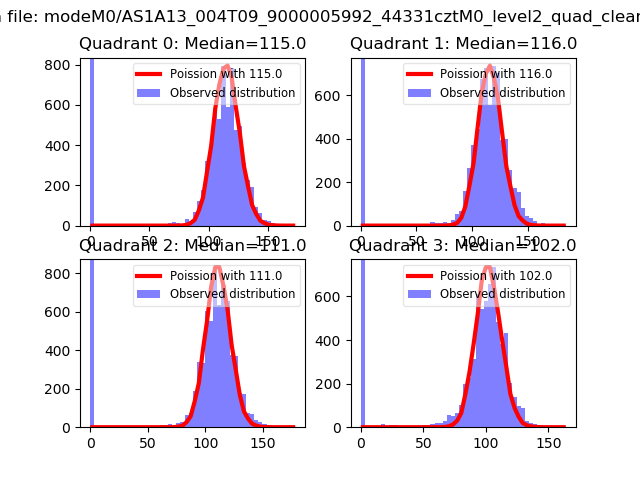 |
 |
| Quadrant-wise count rates Data is divided into 100 sec bins |
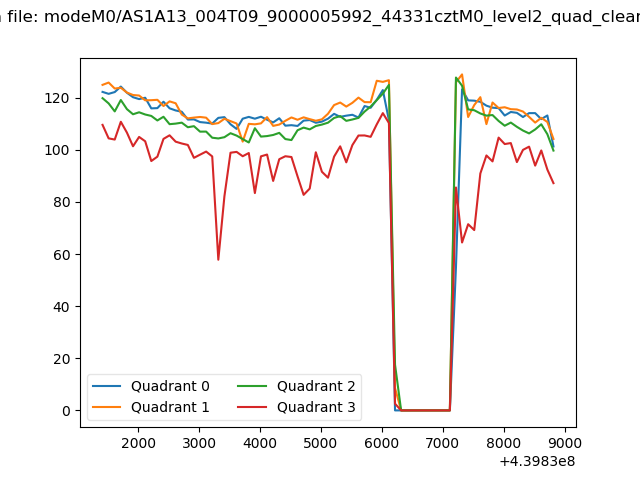 |
|
| Module-wise count rates for Quadrant A Data is divided into 100 sec bins |
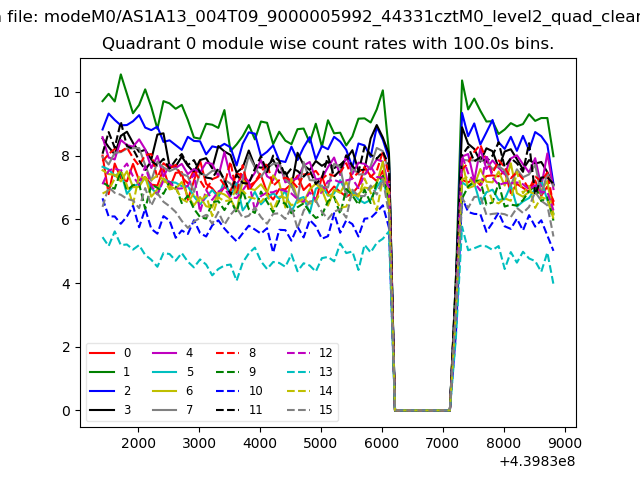 |
 |
| Module-wise count rates for Quadrant B Data is divided into 100 sec bins |
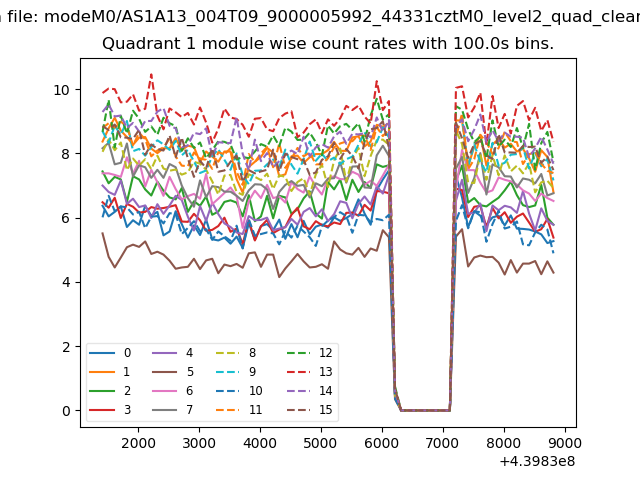 |
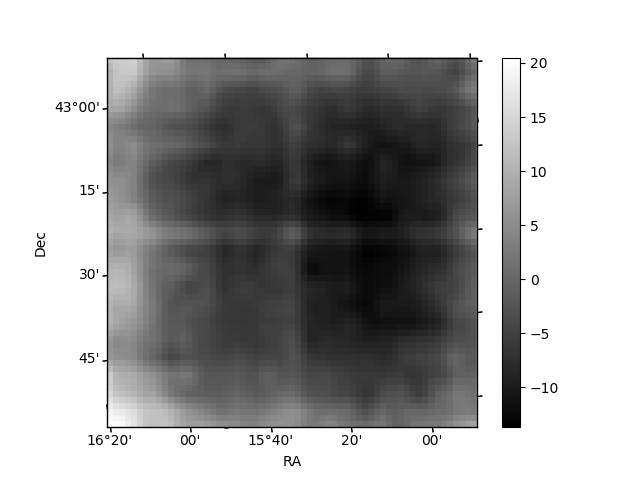 |
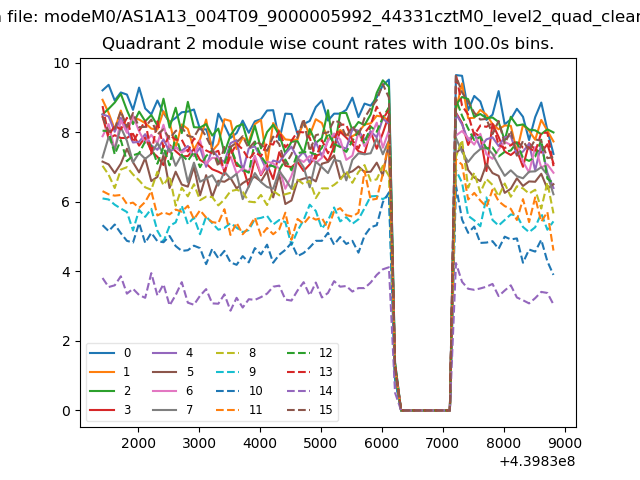
| Module-wise count rates for Quadrant C Data is divided into 100 sec bins |
 |
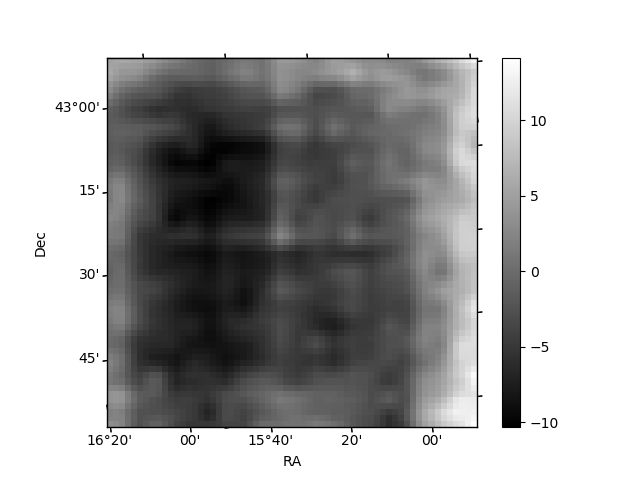 |
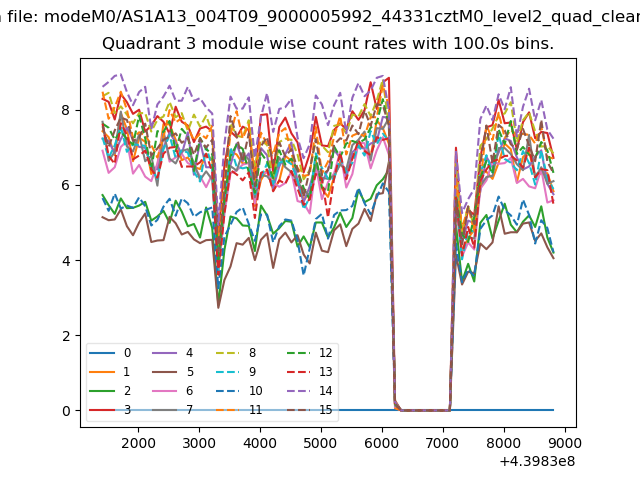
| Module-wise count rates for Quadrant D Data is divided into 100 sec bins |
 |
 |
| Parameter | Plot |
|---|---|
| CZT HV Monitor | 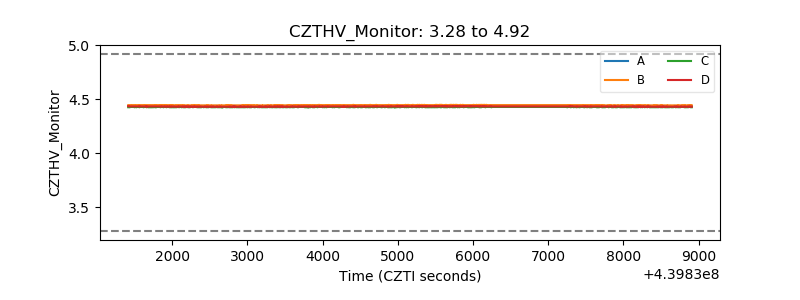 |
| D_VDD | 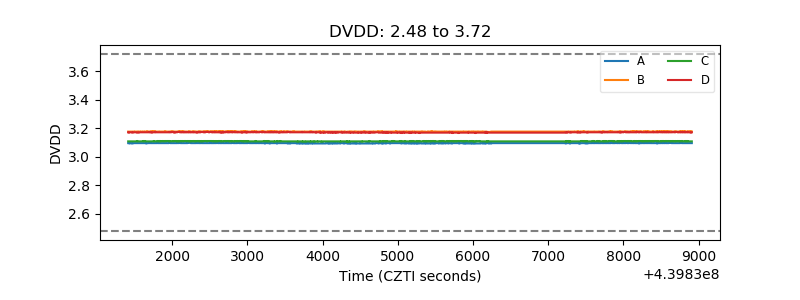 |
| Temperature 1 | 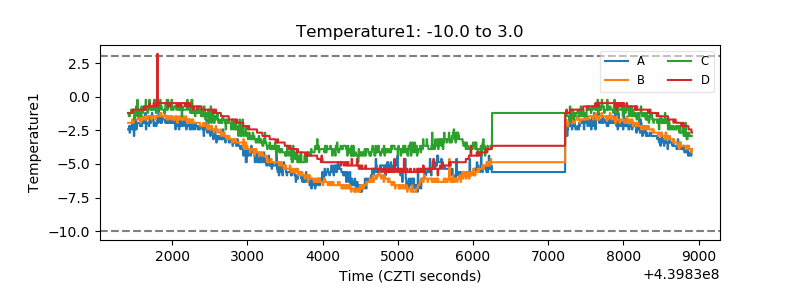 |
| Veto HV Monitor | 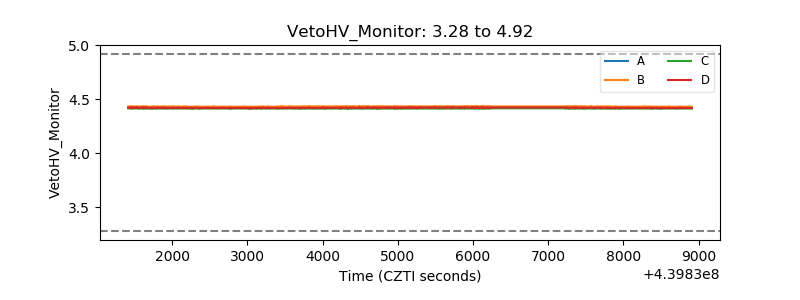 |
| Veto LLD | 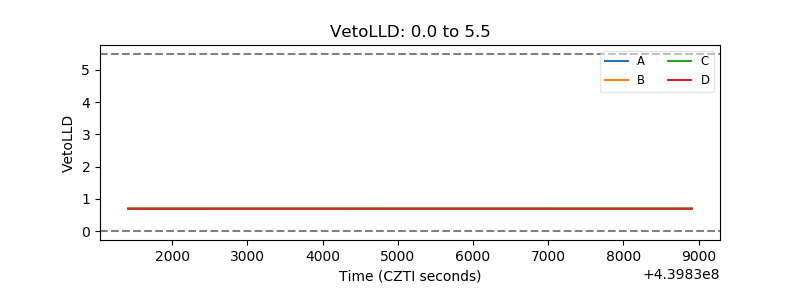 |
| Alpha Counter | 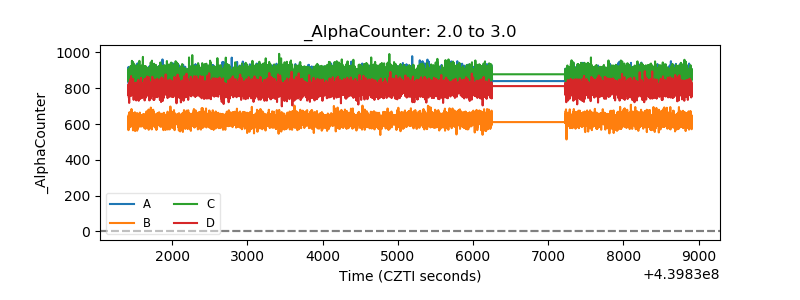 |
| _CPM_Rate | 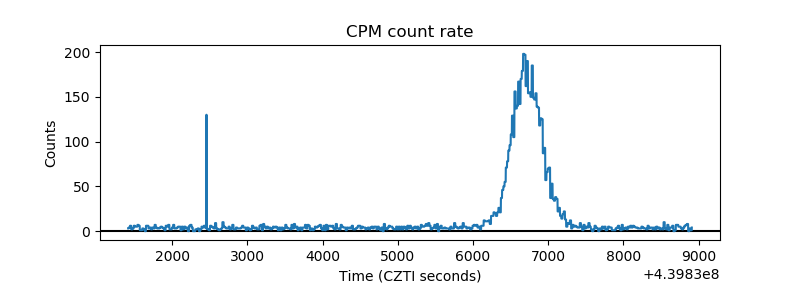 |
| CZT Counter | 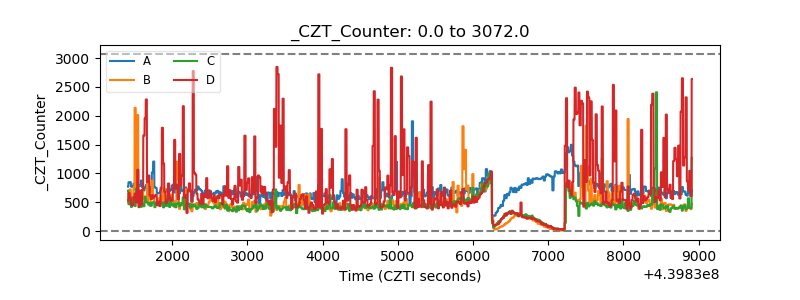 |
| +2.5 Volts monitor | 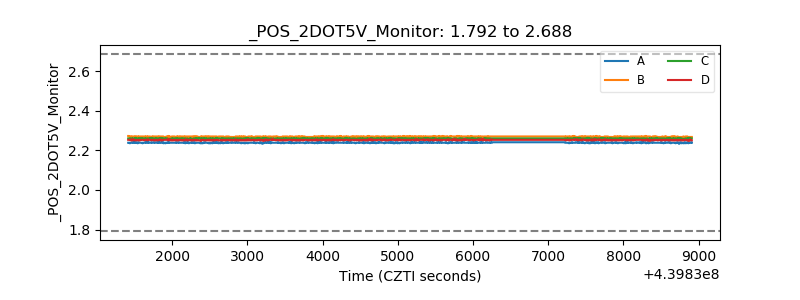 |
| +5 Volts monitor | 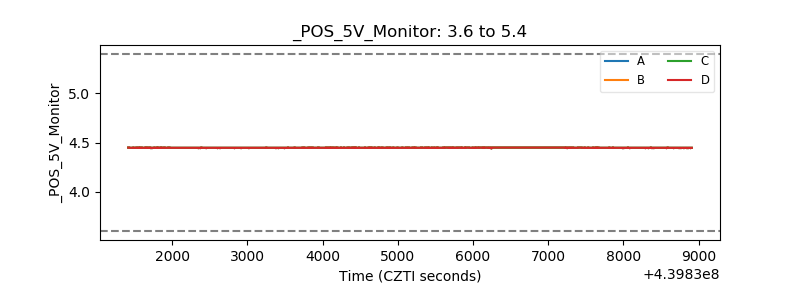 |
| _ROLL_ROT | 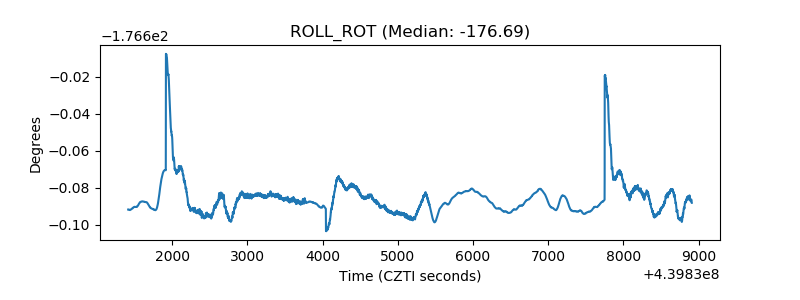 |
| _Roll_DEC | 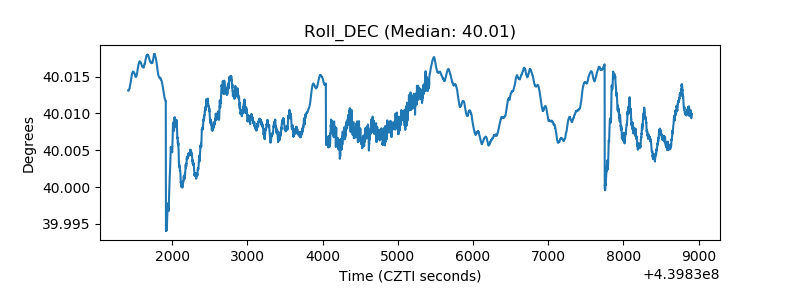 |
| _Roll_RA | 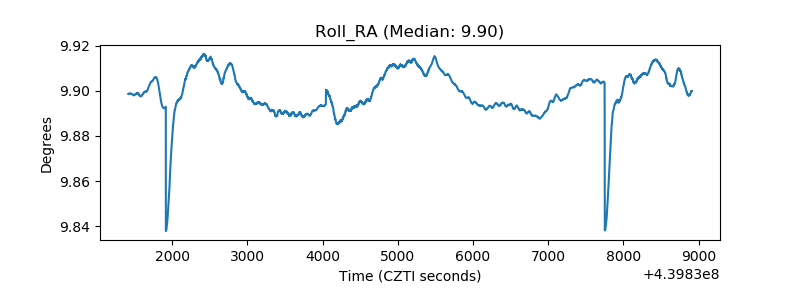 |
| Veto Counter | 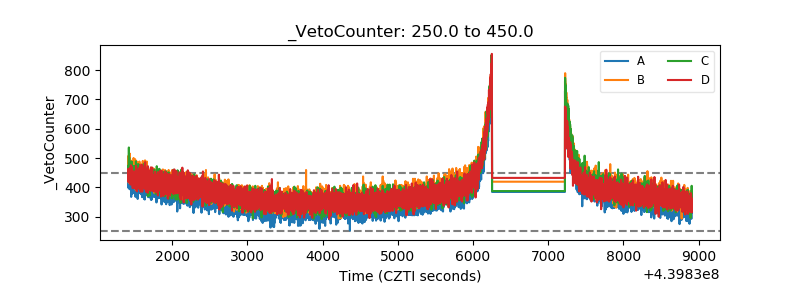 |