| Param | Original file | Final file |
|---|---|---|
| Filename | modeM0/AS1A13_004T09_9000005992_44335cztM0_level2.fits | modeM0/AS1A13_004T09_9000005992_44335cztM0_level2_quad_clean.evt |
| Size (bytes) | 299,021,760 | 70,888,320 |
| Size | 285.2 MB | 67.6 MB |
| Events in quadrant A | 2,964,388 | 476,541 |
| Events in quadrant B | 2,305,383 | 485,331 |
| Events in quadrant C | 2,098,749 | 473,264 |
| Events in quadrant D | 3,359,543 | 403,367 |
| Mode SS | |||
|---|---|---|---|
| Quadrant | BADHDUFLAG | Total packets | Discarded packets |
| A | 0 | 92 | 2 |
| B | 0 | 94 | 2 |
| C | 0 | 93 | 1 |
| D | 0 | 94 | 4 |
| Mode M9 | |||
|---|---|---|---|
| Quadrant | BADHDUFLAG | Total packets | Discarded packets |
| A | 0 | 1 | 0 |
| B | 0 | 2 | 1 |
| C | 0 | 1 | 0 |
| D | 0 | 1 | 0 |
| Mode M0 | |||
|---|---|---|---|
| Quadrant | BADHDUFLAG | Total packets | Discarded packets |
| A | 0 | 12660 | 299 |
| B | 0 | 9994 | 232 |
| C | 0 | 9504 | 203 |
| D | 0 | 13303 | 264 |
| Quadrant | Total seconds | Saturated seconds | Saturation percentage |
|---|---|---|---|
| A | 4367 | 110 | 2.518892% |
| B | 4369 | 113 | 2.586404% |
| C | 4371 | 31 | 0.709220% |
| D | 4364 | 386 | 8.845096% |
Noise dominated data is calculated using 1-second bins in cleaned event files. If a bin has >2000 counts, and if more than 50% of those come from <1% of pixels, then it is considered to be noise-dominated and hence unusable.
| Quadrant | # 1 sec bins | Bins with >0 counts | Bins with >2000 counts | High rate bins dominated by noise | Noise dominated (total time) | Noise dominated (detector-on time) | Marked lightcurve |
|---|---|---|---|---|---|---|---|
| A | 4835 | 4387 | 0 | 0 | 0.00% | 0.00% |  |
| B | 4826 | 4387 | 18 | 18 | 0.37% | 0.41% |  |
| C | 4834 | 4393 | 10 | 10 | 0.21% | 0.23% |  |
| D | 4826 | 4389 | 219 | 219 | 4.54% | 4.99% |  |
Top three noisy pixels from each quadrant. If the there are fewer than three noisy pixels in the level2.evt file, extra rows are filled as -1
| Pixel properties | Quadrant properties | ||||||
|---|---|---|---|---|---|---|---|
| Quadrant | DetID | PixID | Counts | Sigma | Mean | Median | Sigma |
| A | 10 | 83 | 953161 | 8743.82 | 516 | 504 | 109.0 |
| A | 0 | 243 | 8173 | 70.39 | 516 | 504 | 109.0 |
| A | 3 | 137 | 6105 | 51.41 | 516 | 504 | 109.0 |
| B | 0 | 219 | 134828 | 1300.75 | 511 | 495 | 103.3 |
| B | 5 | 32 | 39097 | 373.78 | 511 | 495 | 103.3 |
| B | 0 | 190 | 27298 | 259.53 | 511 | 495 | 103.3 |
| C | 14 | 254 | 98090 | 807.71 | 506 | 509 | 120.8 |
| C | 3 | 233 | 10536 | 83.0 | 506 | 509 | 120.8 |
| C | 0 | 207 | 8131 | 63.09 | 506 | 509 | 120.8 |
| D | 13 | 249 | 463041 | 3756.38 | 491 | 476 | 123.1 |
| D | 12 | 233 | 370310 | 3003.33 | 491 | 476 | 123.1 |
| D | 13 | 138 | 134984 | 1092.31 | 491 | 476 | 123.1 |
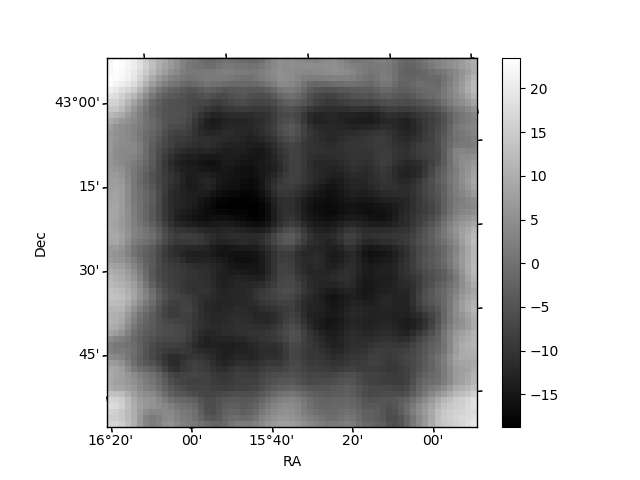
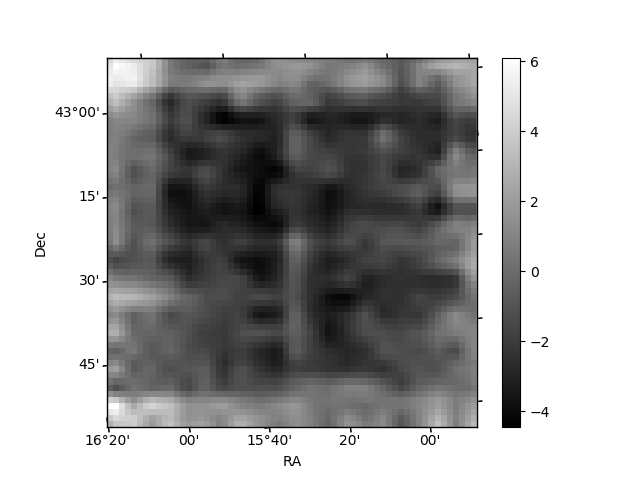
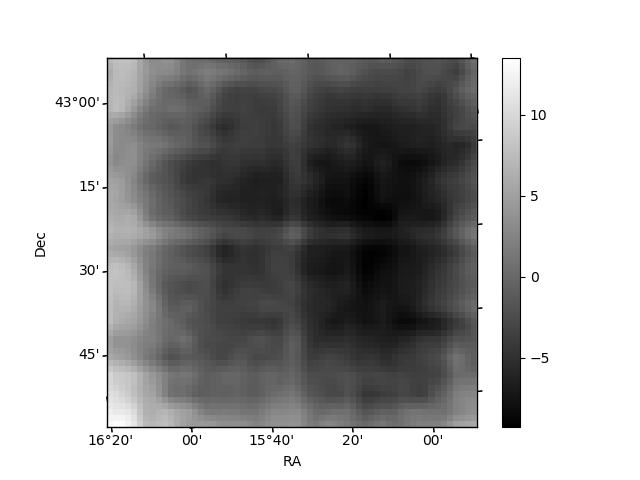
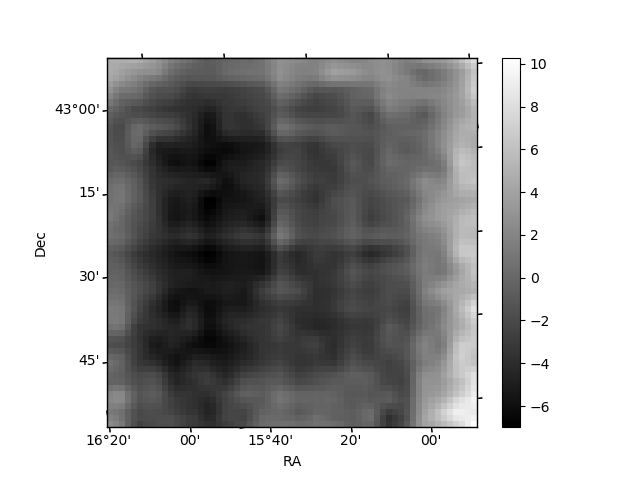
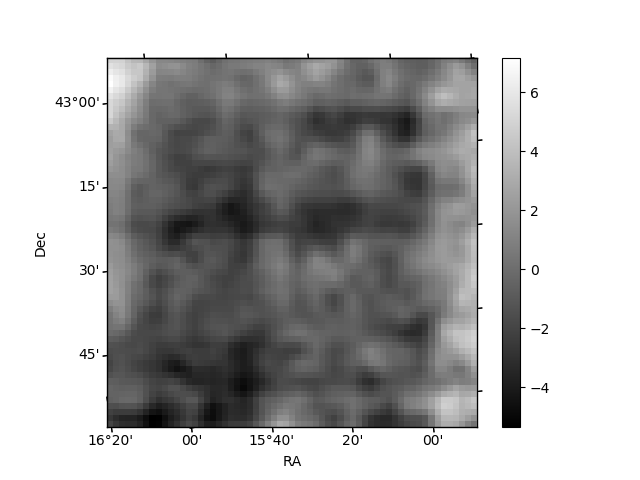
Histogram calculated using DETX and DETY for each event in the final _common_clean file
| Quadrant A | 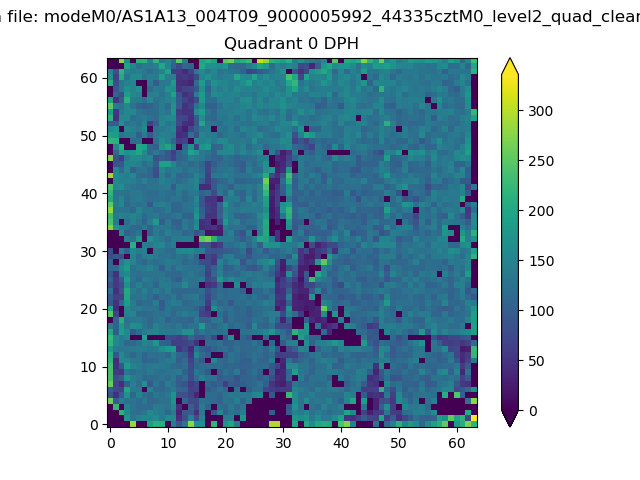 |
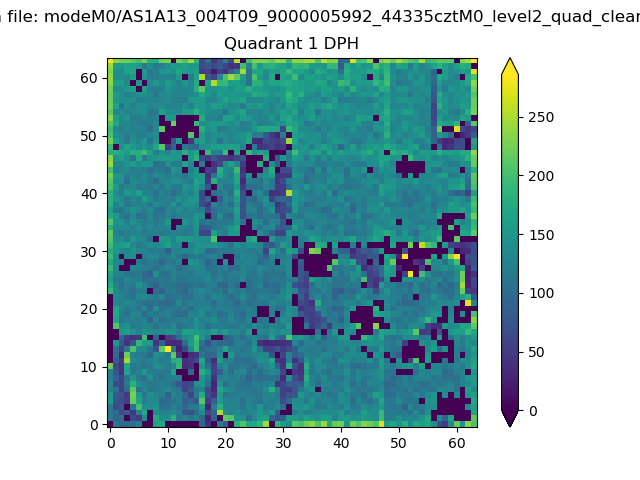 |
Quadrant B |
|---|---|---|---|
| Quadrant D | 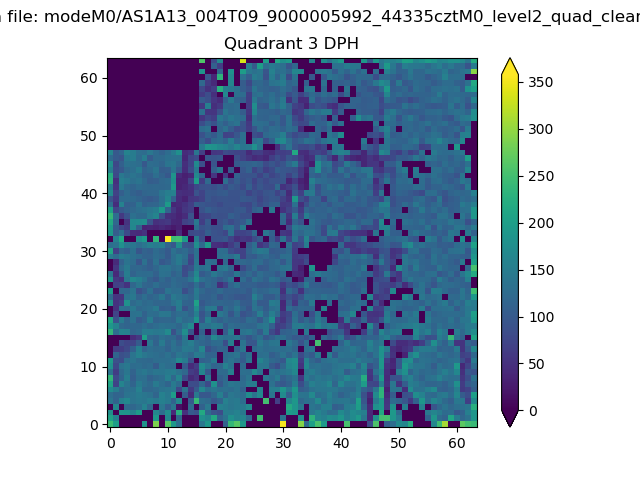 |
 |
Quadrant C |
| Plot type | Count rate plots | Images |
|---|---|---|
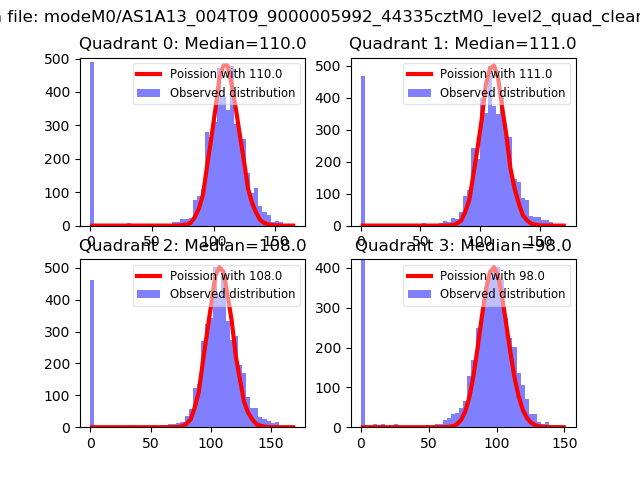
| Comparison with Poisson distribution Blue bars denote a histogram of data divided into 1 sec bins. Red curve is a Poisson curve with rate = median count rate of data. |
 |
 |
| Quadrant-wise count rates Data is divided into 100 sec bins |
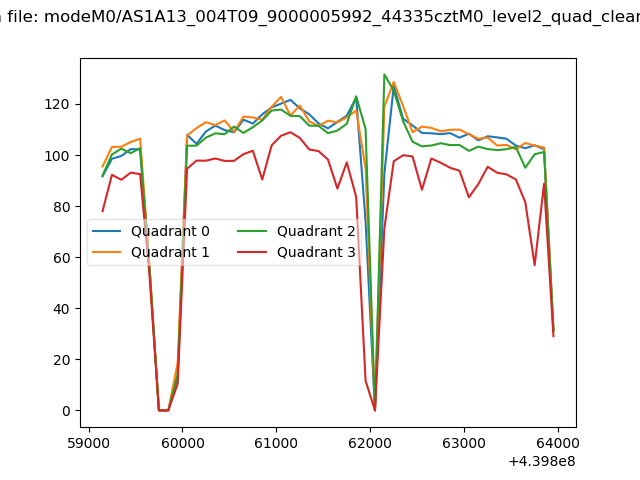 |
|
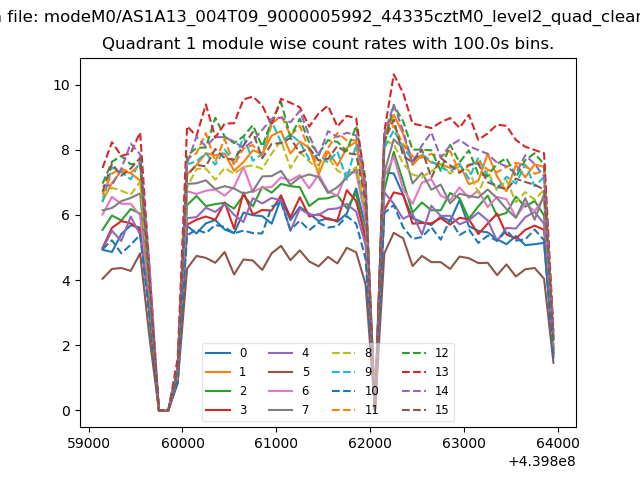
| Module-wise count rates for Quadrant A Data is divided into 100 sec bins |
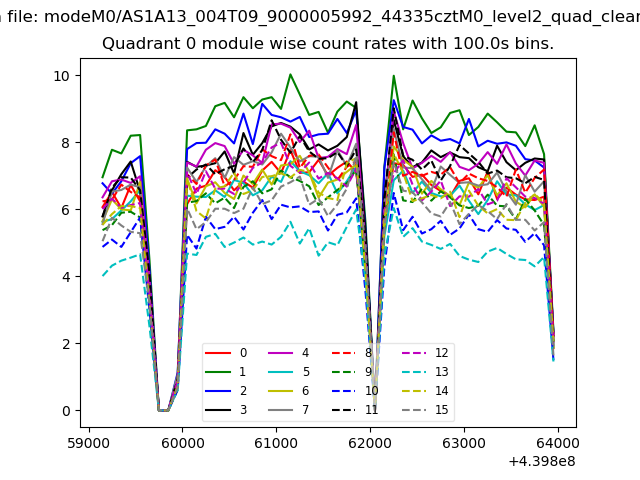 |
 |
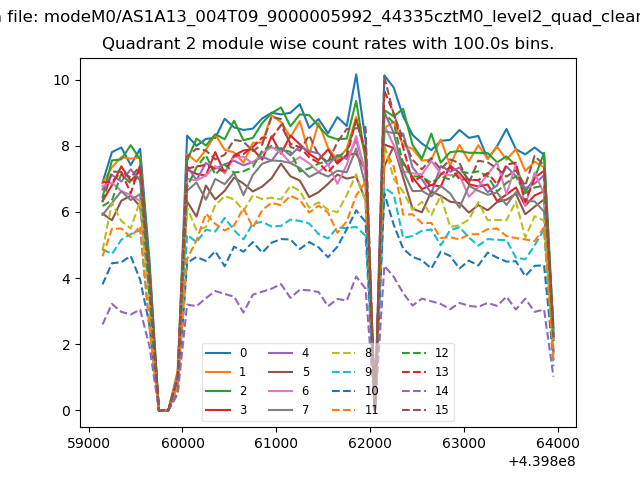
| Module-wise count rates for Quadrant B Data is divided into 100 sec bins |
 |
 |
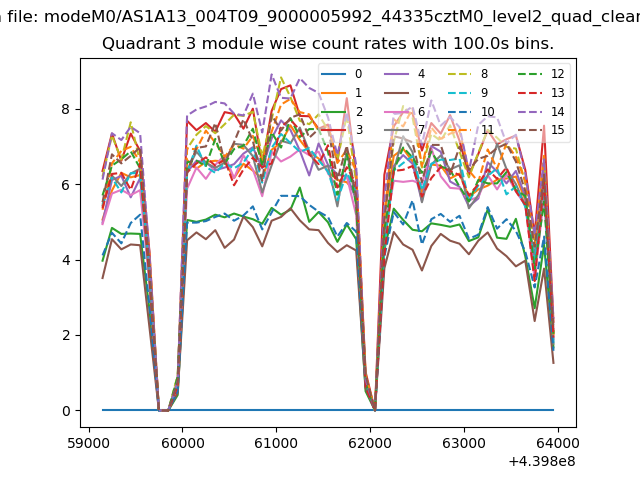
| Module-wise count rates for Quadrant C Data is divided into 100 sec bins |
 |
 |
| Module-wise count rates for Quadrant D Data is divided into 100 sec bins |
 |
 |
| Parameter | Plot |
|---|---|
| CZT HV Monitor | 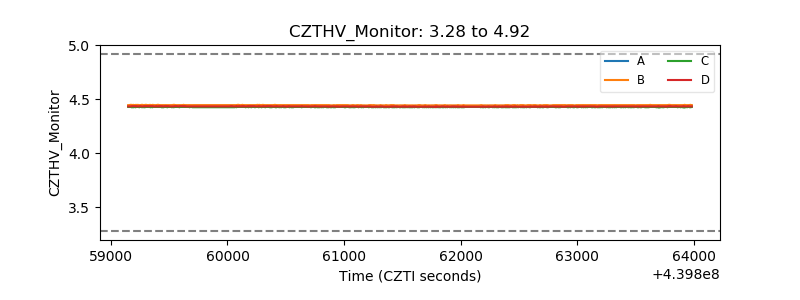 |
| D_VDD | 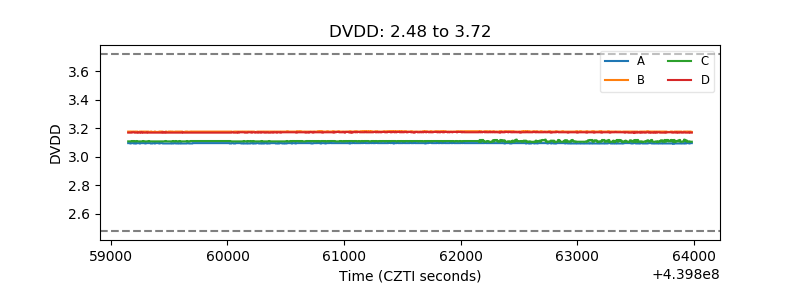 |
| Temperature 1 | 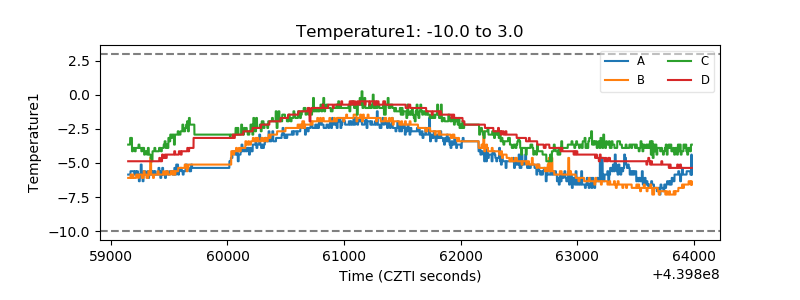 |
| Veto HV Monitor | 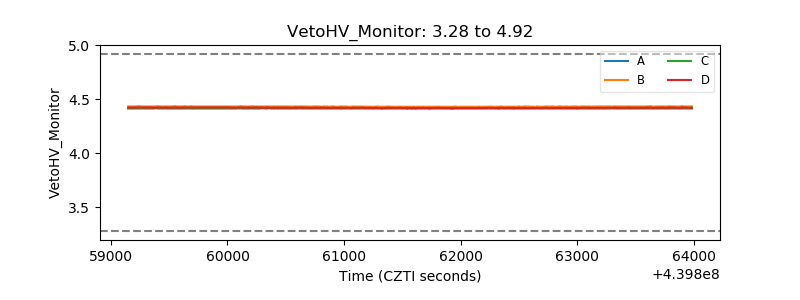 |
| Veto LLD | 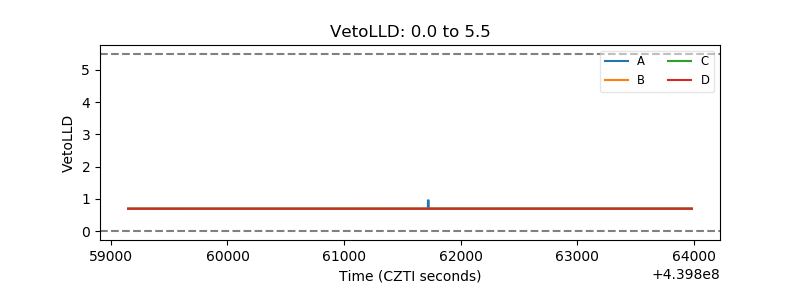 |
| Alpha Counter | 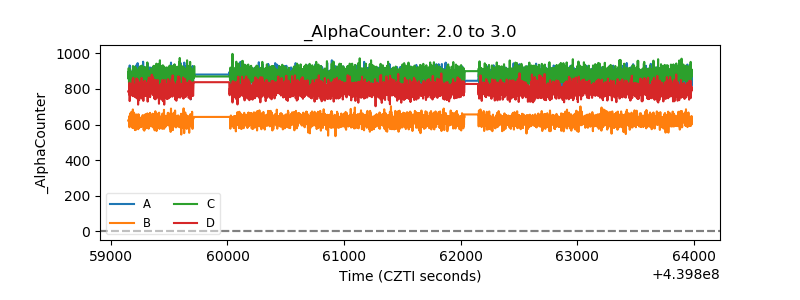 |
| _CPM_Rate | 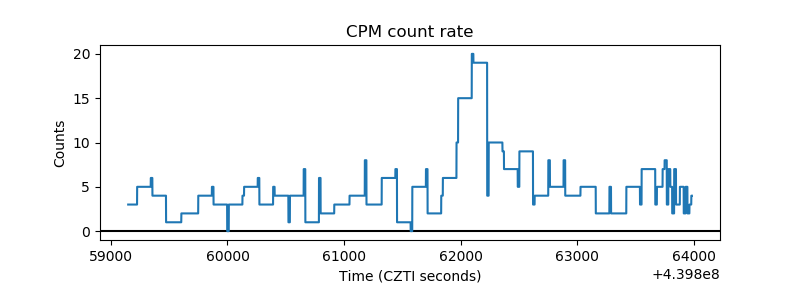 |
| CZT Counter | 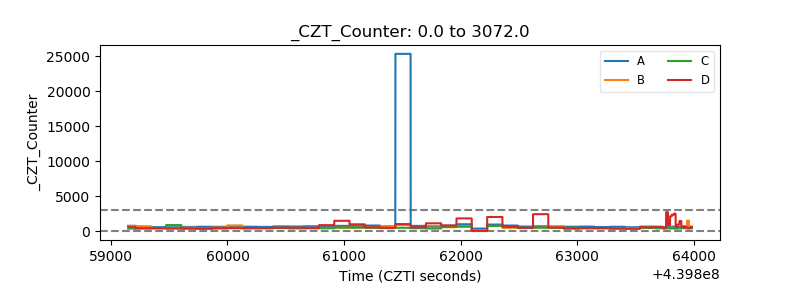 |
| +2.5 Volts monitor | 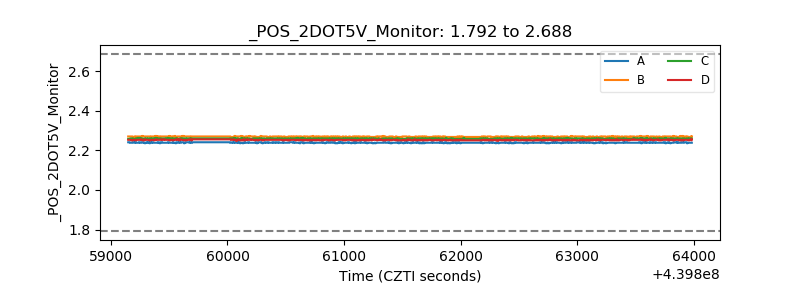 |
| +5 Volts monitor | 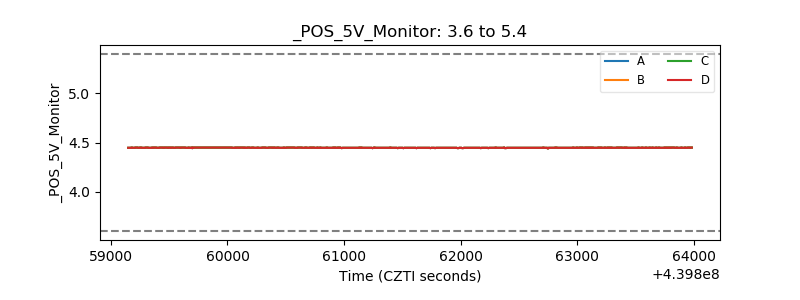 |
| _ROLL_ROT | 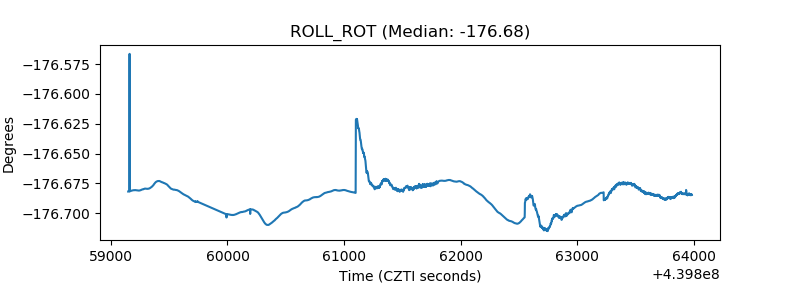 |
| _Roll_DEC | 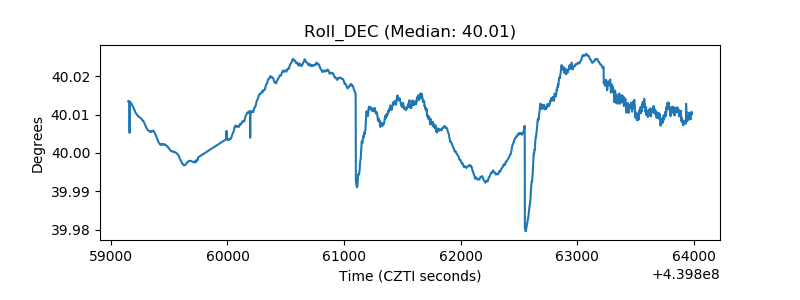 |
| _Roll_RA | 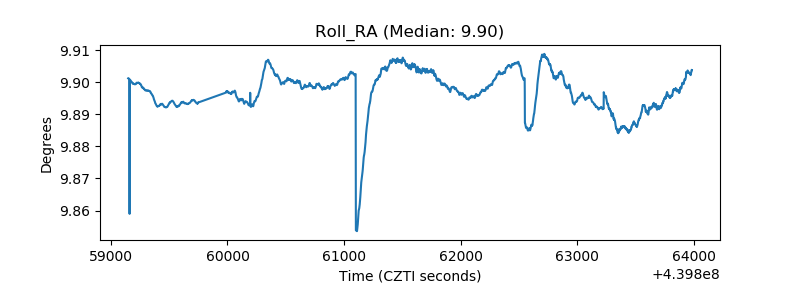 |
| Veto Counter | 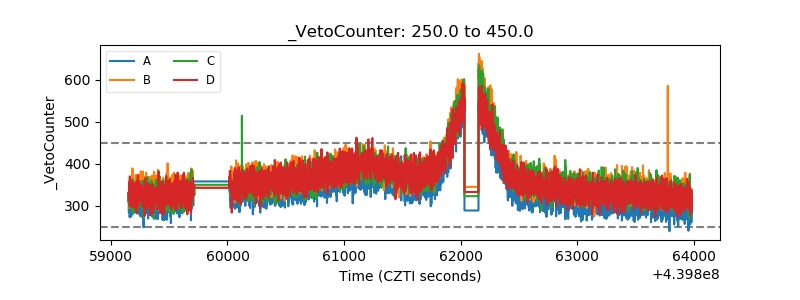 |