| Param | Original file | Final file |
|---|---|---|
| Filename | modeM0/AS1A13_004T09_9000005992_44338cztM0_level2.fits | modeM0/AS1A13_004T09_9000005992_44338cztM0_level2_quad_clean.evt |
| Size (bytes) | 1,966,818,240 | 491,402,880 |
| Size | 1.8 GB | 468.6 MB |
| Events in quadrant A | 21,303,072 | 3,246,698 |
| Events in quadrant B | 15,991,253 | 3,331,002 |
| Events in quadrant C | 14,206,555 | 3,250,965 |
| Events in quadrant D | 18,920,537 | 2,930,182 |
| Mode SS | |||
|---|---|---|---|
| Quadrant | BADHDUFLAG | Total packets | Discarded packets |
| A | 0 | 624 | 0 |
| B | 0 | 624 | 0 |
| C | 0 | 624 | 0 |
| D | 0 | 624 | 0 |
| Mode M9 | |||
|---|---|---|---|
| Quadrant | BADHDUFLAG | Total packets | Discarded packets |
| A | 0 | 20 | 0 |
| B | 0 | 20 | 0 |
| C | 0 | 20 | 0 |
| D | 0 | 20 | 0 |
| Mode M0 | |||
|---|---|---|---|
| Quadrant | BADHDUFLAG | Total packets | Discarded packets |
| A | 0 | 87979 | 7 |
| B | 0 | 68560 | 4 |
| C | 0 | 64735 | 4 |
| D | 0 | 78270 | 4 |
| Quadrant | Total seconds | Saturated seconds | Saturation percentage |
|---|---|---|---|
| A | 30831 | 663 | 2.150433% |
| B | 30833 | 611 | 1.981643% |
| C | 30834 | 174 | 0.564312% |
| D | 30833 | 976 | 3.165440% |
Noise dominated data is calculated using 1-second bins in cleaned event files. If a bin has >2000 counts, and if more than 50% of those come from <1% of pixels, then it is considered to be noise-dominated and hence unusable.
| Quadrant | # 1 sec bins | Bins with >0 counts | Bins with >2000 counts | High rate bins dominated by noise | Noise dominated (total time) | Noise dominated (detector-on time) | Marked lightcurve |
|---|---|---|---|---|---|---|---|
| A | 32833 | 30834 | 201 | 201 | 0.61% | 0.65% | 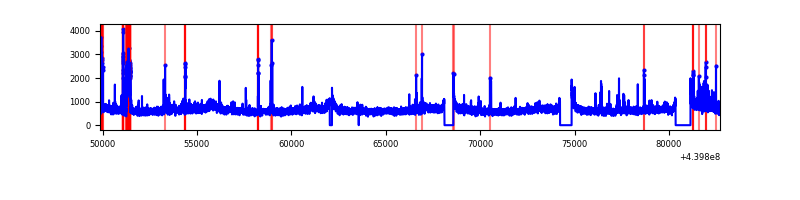 |
| B | 32833 | 30837 | 287 | 287 | 0.87% | 0.93% | 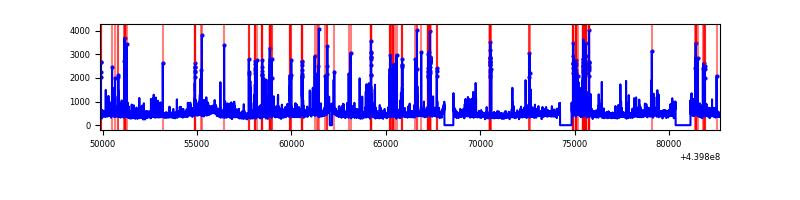 |
| C | 32834 | 30838 | 79 | 79 | 0.24% | 0.26% | 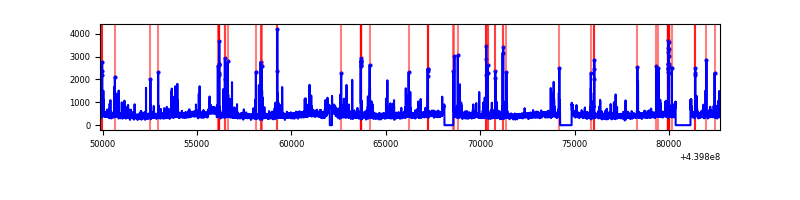 |
| D | 32833 | 30836 | 690 | 690 | 2.10% | 2.24% | 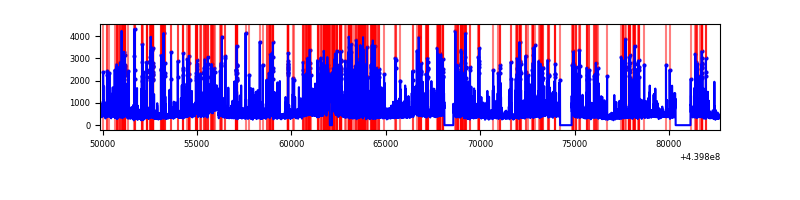 |
Top three noisy pixels from each quadrant. If the there are fewer than three noisy pixels in the level2.evt file, extra rows are filled as -1
| Pixel properties | Quadrant properties | ||||||
|---|---|---|---|---|---|---|---|
| Quadrant | DetID | PixID | Counts | Sigma | Mean | Median | Sigma |
| A | 10 | 83 | 6811651 | 9585.05 | 3439 | 3359 | 710.3 |
| A | 15 | 223 | 803198 | 1126.05 | 3439 | 3359 | 710.3 |
| A | 10 | 248 | 139952 | 192.3 | 3439 | 3359 | 710.3 |
| B | 0 | 219 | 1318559 | 1967.39 | 3427 | 3325 | 668.5 |
| B | 5 | 255 | 286390 | 423.42 | 3427 | 3325 | 668.5 |
| B | 0 | 190 | 163523 | 239.63 | 3427 | 3325 | 668.5 |
| C | 14 | 254 | 621105 | 774.58 | 3399 | 3417 | 797.5 |
| C | 14 | 96 | 127989 | 156.21 | 3399 | 3417 | 797.5 |
| C | 3 | 233 | 64334 | 76.39 | 3399 | 3417 | 797.5 |
| D | 13 | 249 | 1586412 | 1876.54 | 3366 | 3268 | 843.6 |
| D | 2 | 153 | 569523 | 671.2 | 3366 | 3268 | 843.6 |
| D | 12 | 233 | 549924 | 647.96 | 3366 | 3268 | 843.6 |
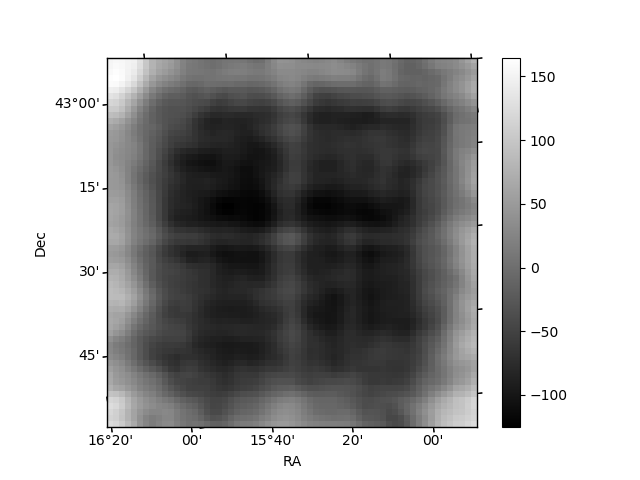
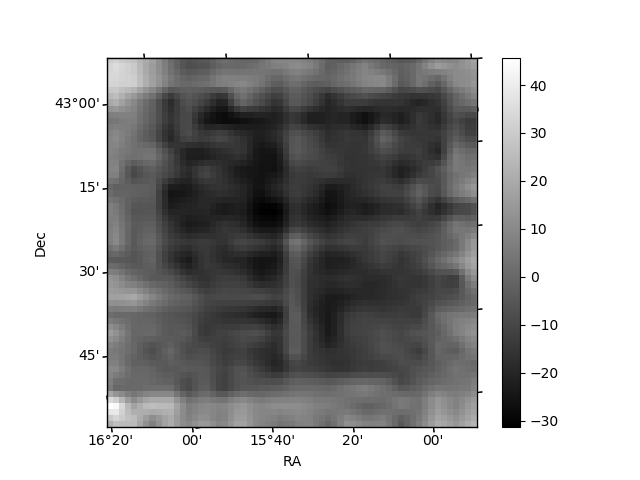
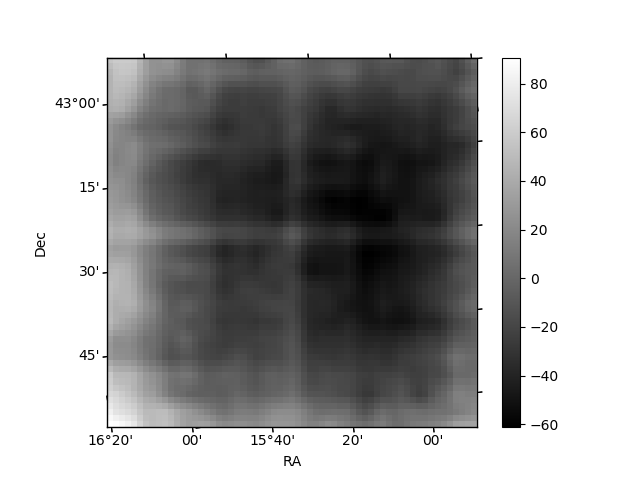
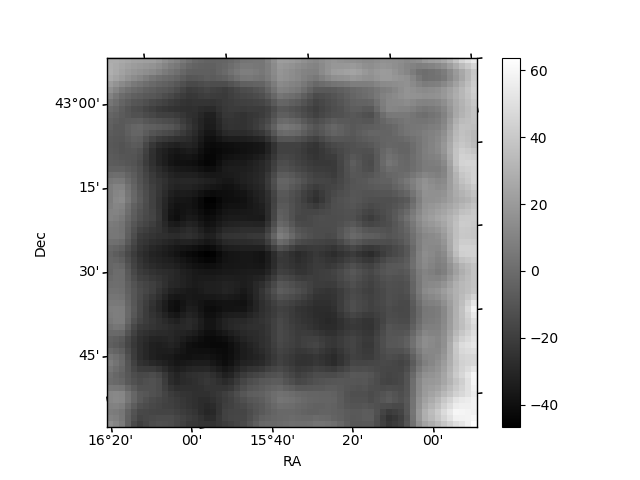
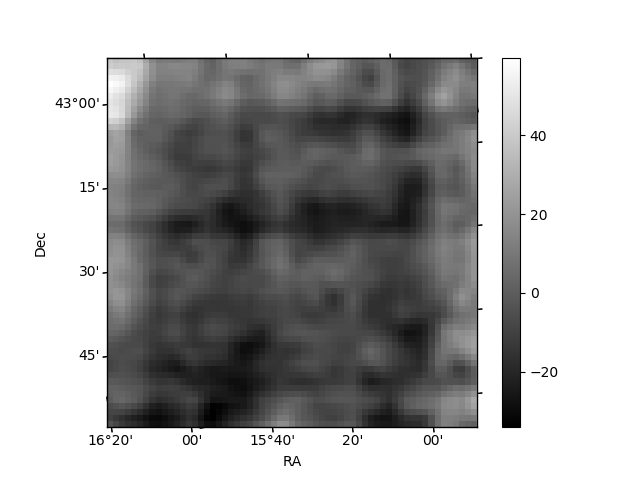
Histogram calculated using DETX and DETY for each event in the final _common_clean file
| Quadrant A | 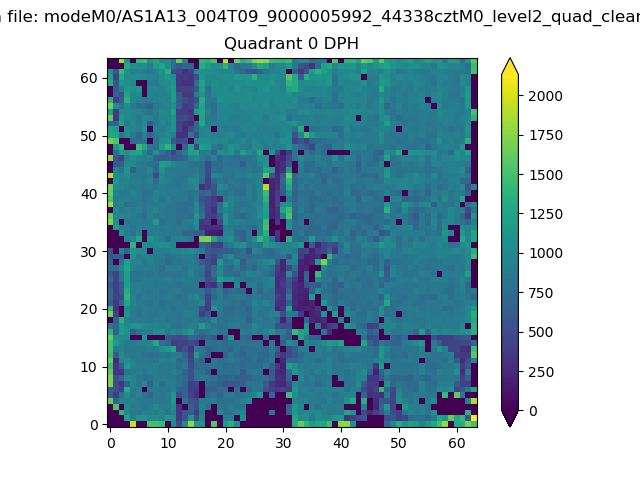 |
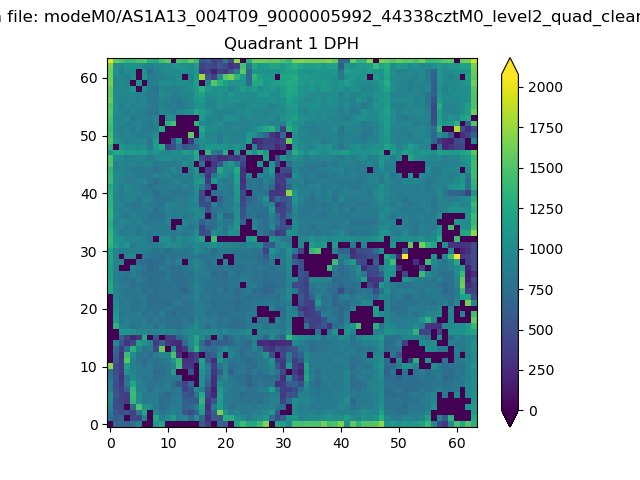 |
Quadrant B |
|---|---|---|---|
| Quadrant D | 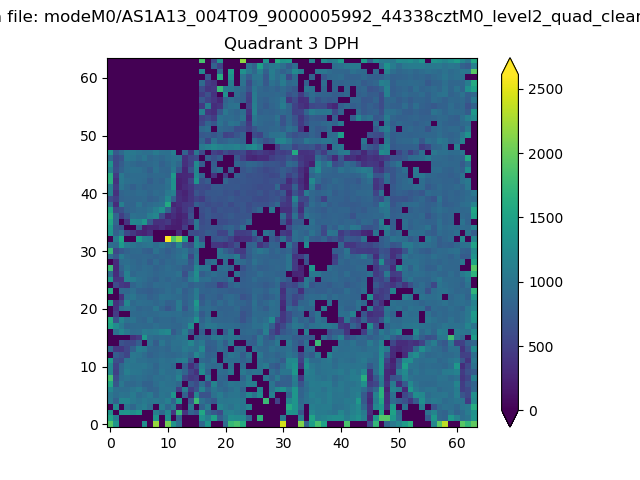 |
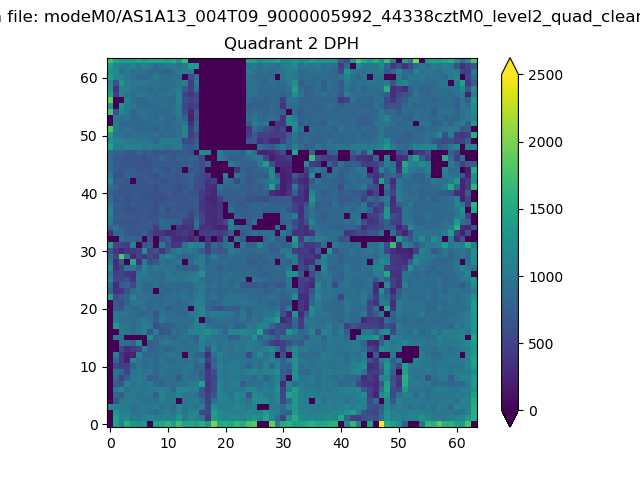 |
Quadrant C |
| Plot type | Count rate plots | Images |
|---|---|---|
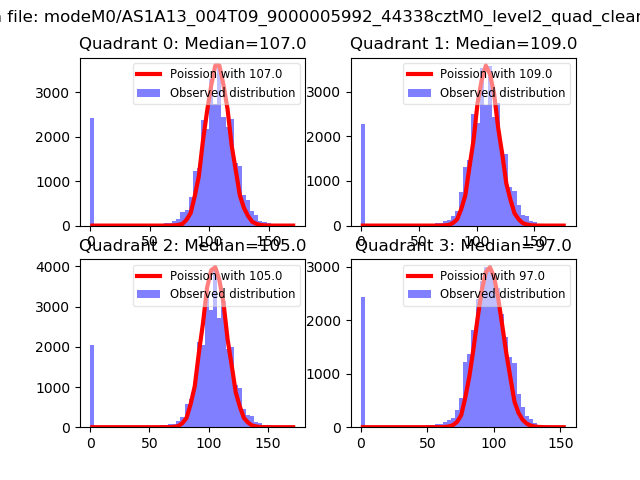
| Comparison with Poisson distribution Blue bars denote a histogram of data divided into 1 sec bins. Red curve is a Poisson curve with rate = median count rate of data. |
 |
 |
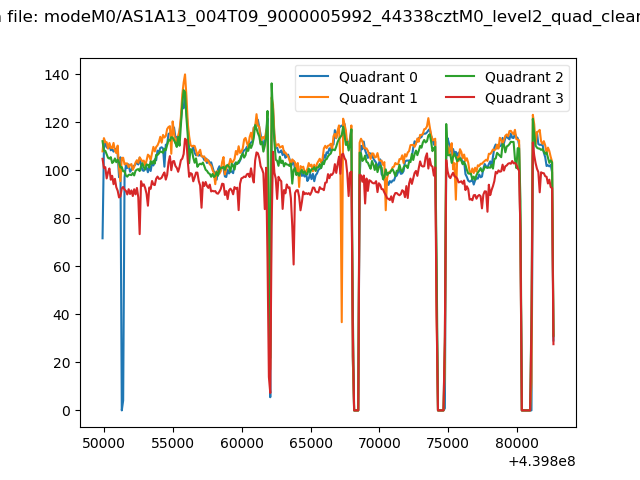
| Quadrant-wise count rates Data is divided into 100 sec bins |
 |
|
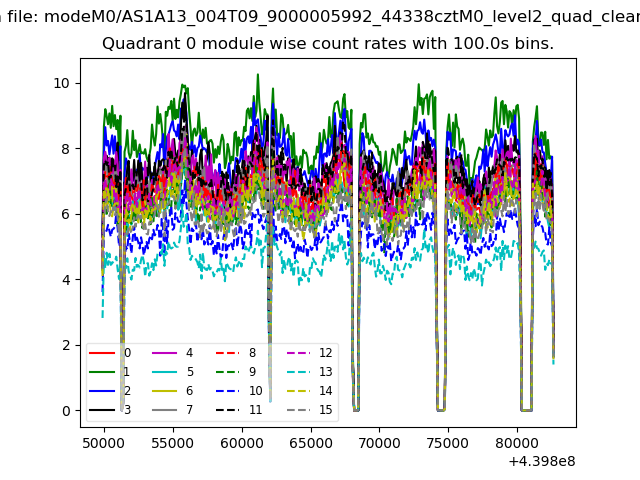
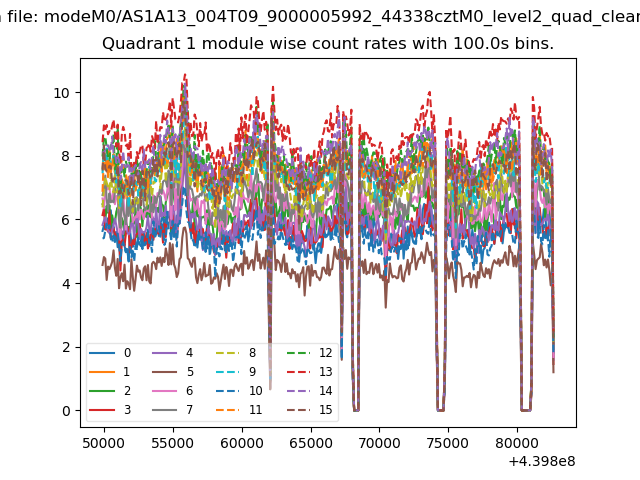
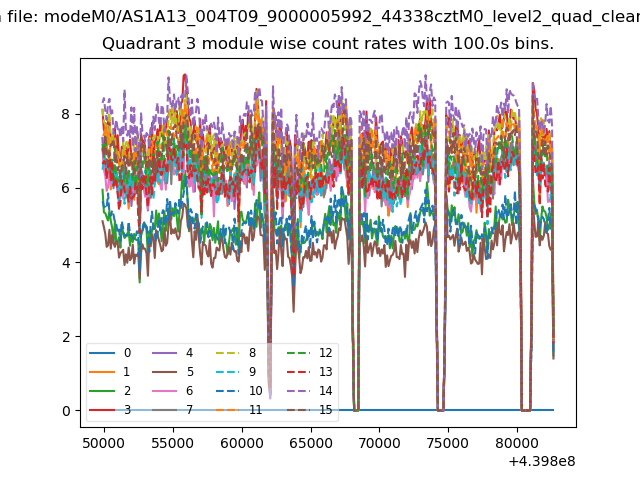
| Module-wise count rates for Quadrant A Data is divided into 100 sec bins |
 |
 |
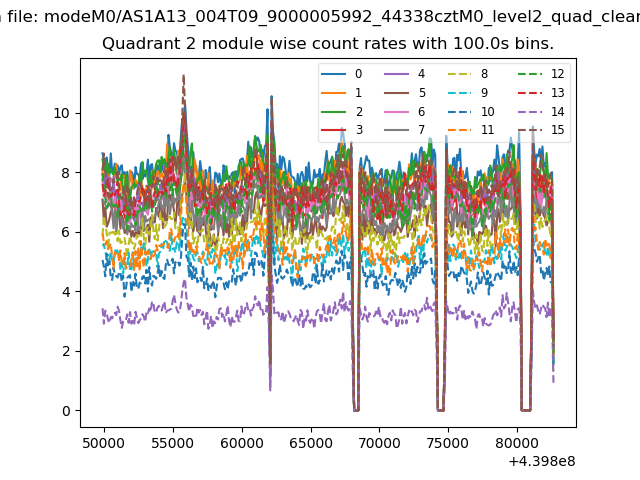
| Module-wise count rates for Quadrant B Data is divided into 100 sec bins |
 |
 |
| Module-wise count rates for Quadrant C Data is divided into 100 sec bins |
 |
 |
| Module-wise count rates for Quadrant D Data is divided into 100 sec bins |
 |
 |
| Parameter | Plot |
|---|---|
| CZT HV Monitor | 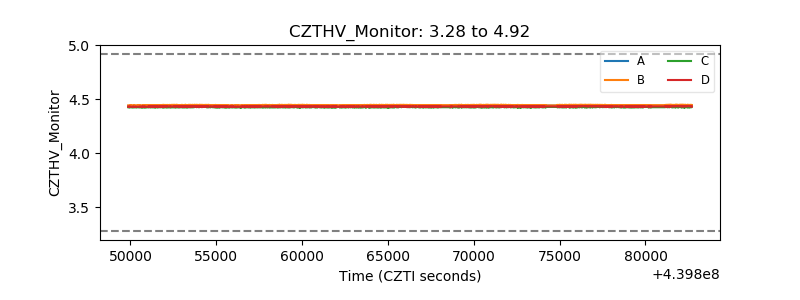 |
| D_VDD | 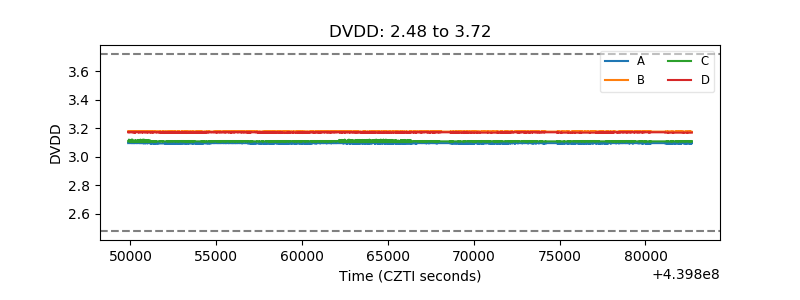 |
| Temperature 1 | 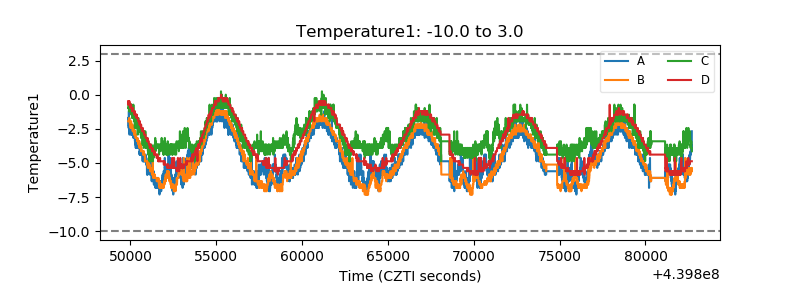 |
| Veto HV Monitor | 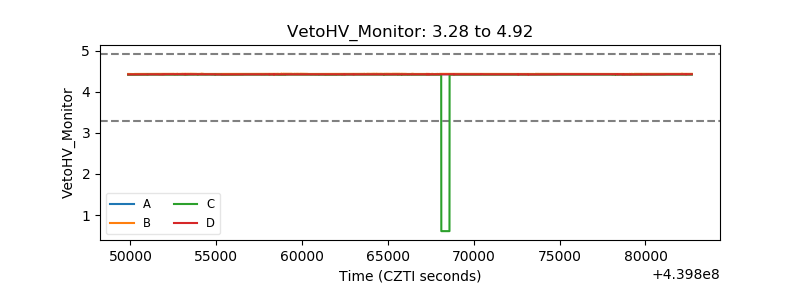 |
| Veto LLD | 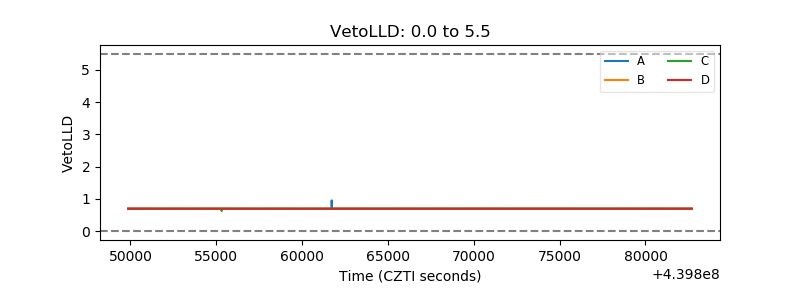 |
| Alpha Counter | 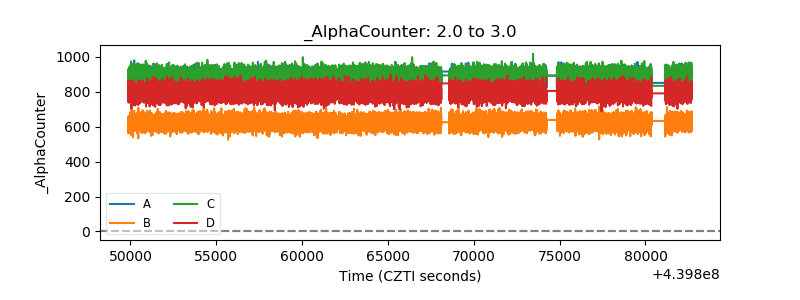 |
| _CPM_Rate | 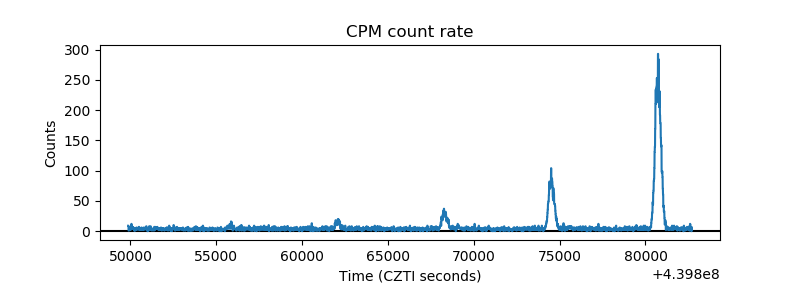 |
| CZT Counter | 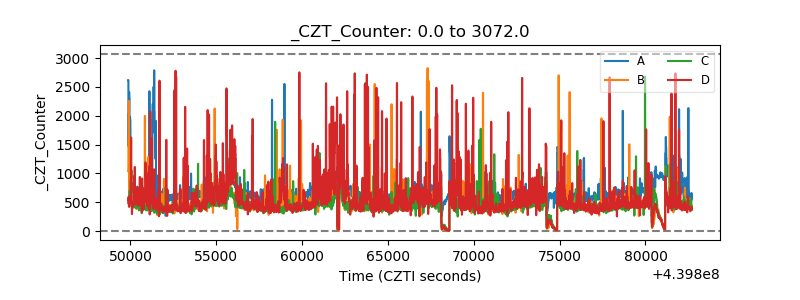 |
| +2.5 Volts monitor | 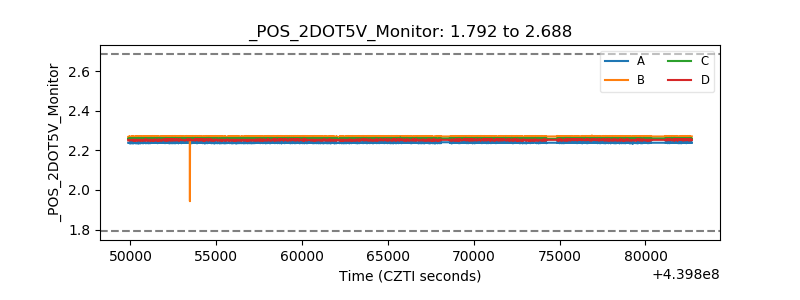 |
| +5 Volts monitor | 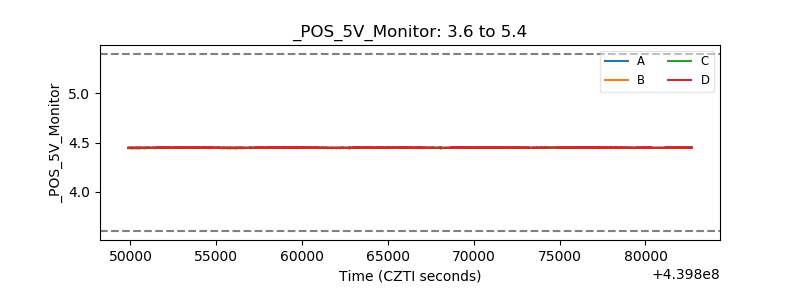 |
| _ROLL_ROT | 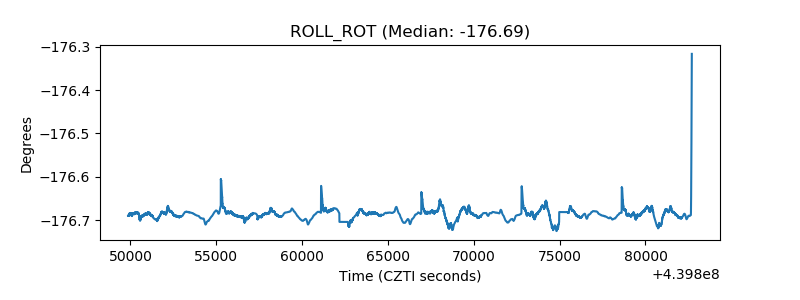 |
| _Roll_DEC | 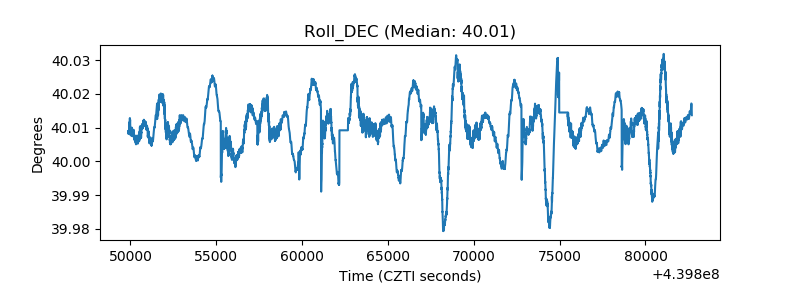 |
| _Roll_RA | 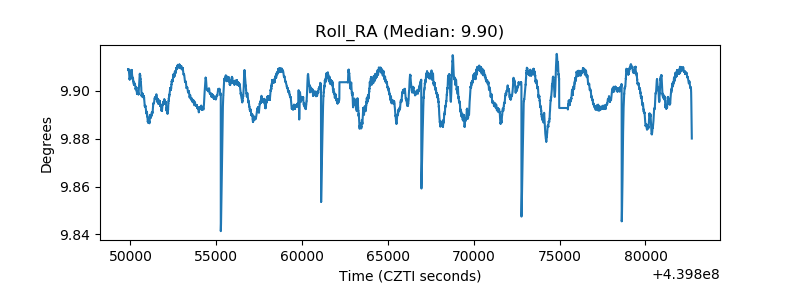 |
| Veto Counter | 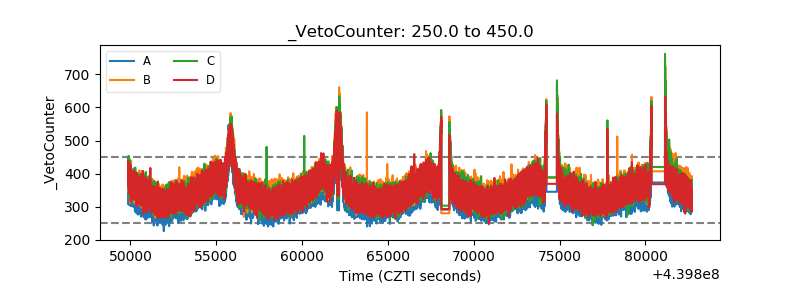 |