| Param | Original file | Final file |
|---|---|---|
| Filename | modeM0/AS1A13_004T09_9000005992_44339cztM0_level2.fits | modeM0/AS1A13_004T09_9000005992_44339cztM0_level2_quad_clean.evt |
| Size (bytes) | 462,571,200 | 116,161,920 |
| Size | 441.1 MB | 110.8 MB |
| Events in quadrant A | 5,384,870 | 765,085 |
| Events in quadrant B | 3,787,568 | 789,257 |
| Events in quadrant C | 3,371,236 | 770,254 |
| Events in quadrant D | 4,024,875 | 695,522 |
| Mode SS | |||
|---|---|---|---|
| Quadrant | BADHDUFLAG | Total packets | Discarded packets |
| A | 0 | 148 | 0 |
| B | 0 | 148 | 0 |
| C | 0 | 148 | 0 |
| D | 0 | 148 | 0 |
| Mode M9 | |||
|---|---|---|---|
| Quadrant | BADHDUFLAG | Total packets | Discarded packets |
| A | 0 | 17 | 0 |
| B | 0 | 17 | 0 |
| C | 0 | 17 | 0 |
| D | 0 | 17 | 0 |
| Mode M0 | |||
|---|---|---|---|
| Quadrant | BADHDUFLAG | Total packets | Discarded packets |
| A | 0 | 22013 | 2 |
| B | 0 | 15956 | 2 |
| C | 0 | 15030 | 2 |
| D | 0 | 16898 | 2 |
| Quadrant | Total seconds | Saturated seconds | Saturation percentage |
|---|---|---|---|
| A | 7133 | 209 | 2.930043% |
| B | 7134 | 156 | 2.186712% |
| C | 7134 | 68 | 0.953182% |
| D | 7134 | 163 | 2.284833% |
Noise dominated data is calculated using 1-second bins in cleaned event files. If a bin has >2000 counts, and if more than 50% of those come from <1% of pixels, then it is considered to be noise-dominated and hence unusable.
| Quadrant | # 1 sec bins | Bins with >0 counts | Bins with >2000 counts | High rate bins dominated by noise | Noise dominated (total time) | Noise dominated (detector-on time) | Marked lightcurve |
|---|---|---|---|---|---|---|---|
| A | 8888 | 7133 | 40 | 40 | 0.45% | 0.56% | 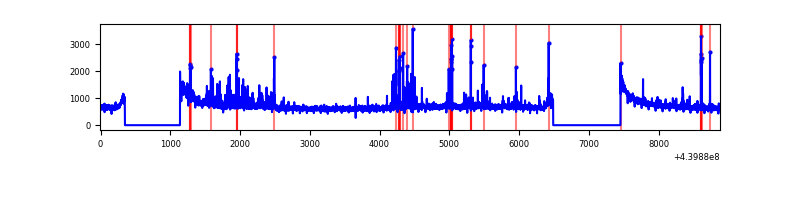 |
| B | 8889 | 7135 | 25 | 25 | 0.28% | 0.35% | 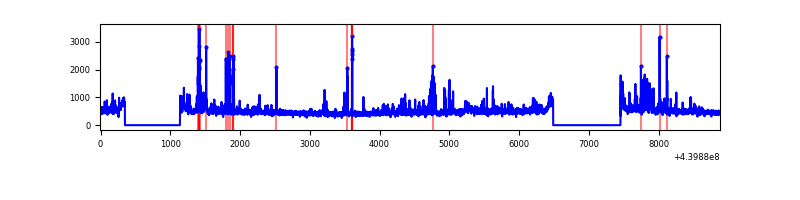 |
| C | 8889 | 7135 | 10 | 10 | 0.11% | 0.14% | 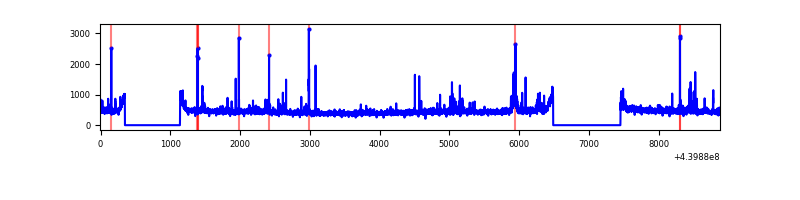 |
| D | 8889 | 7135 | 109 | 109 | 1.23% | 1.53% | 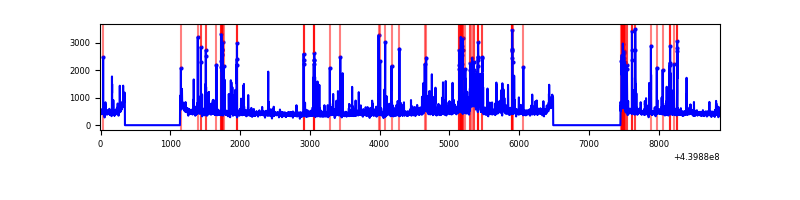 |
Top three noisy pixels from each quadrant. If the there are fewer than three noisy pixels in the level2.evt file, extra rows are filled as -1
| Pixel properties | Quadrant properties | ||||||
|---|---|---|---|---|---|---|---|
| Quadrant | DetID | PixID | Counts | Sigma | Mean | Median | Sigma |
| A | 10 | 83 | 1789517 | 10489.33 | 819 | 800 | 170.5 |
| A | 15 | 223 | 196855 | 1149.7 | 819 | 800 | 170.5 |
| A | 13 | 248 | 143604 | 837.43 | 819 | 800 | 170.5 |
| B | 0 | 219 | 184117 | 1122.89 | 820 | 795 | 163.3 |
| B | 15 | 36 | 67784 | 410.32 | 820 | 795 | 163.3 |
| B | 4 | 173 | 65215 | 394.59 | 820 | 795 | 163.3 |
| C | 14 | 254 | 98327 | 513.73 | 807 | 813 | 189.8 |
| C | 14 | 96 | 47957 | 248.36 | 807 | 813 | 189.8 |
| C | 5 | 4 | 30927 | 158.65 | 807 | 813 | 189.8 |
| D | 13 | 249 | 308407 | 1526.63 | 801 | 777 | 201.5 |
| D | 5 | 222 | 221379 | 1094.75 | 801 | 777 | 201.5 |
| D | 2 | 153 | 106688 | 525.59 | 801 | 777 | 201.5 |
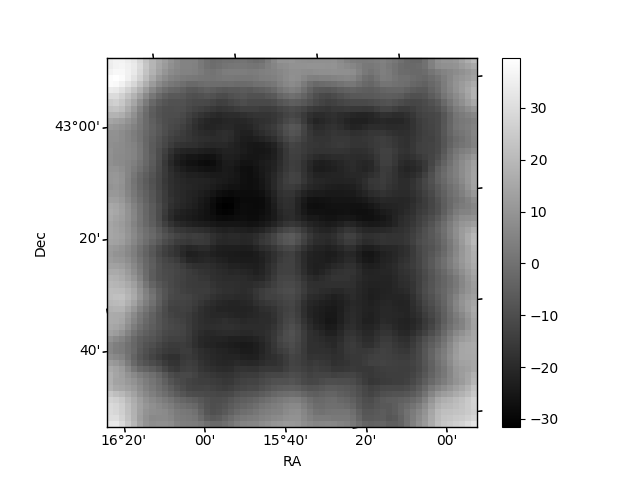
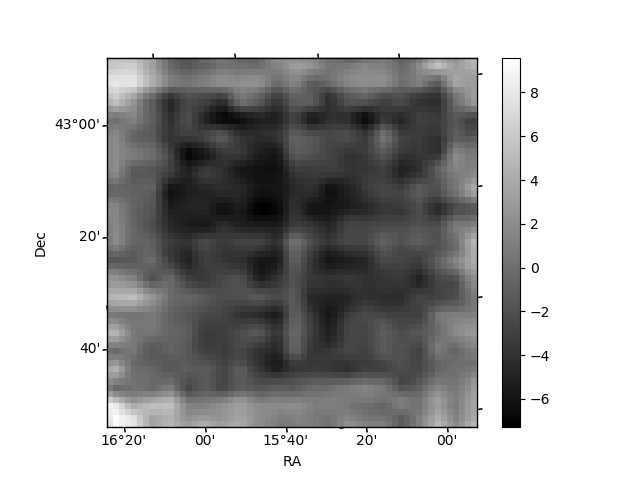
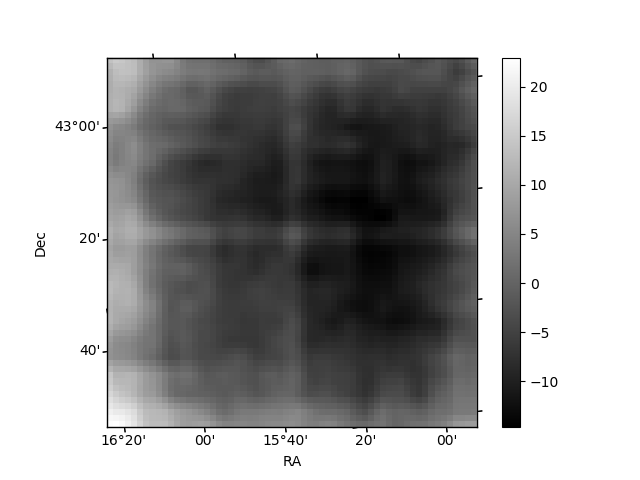
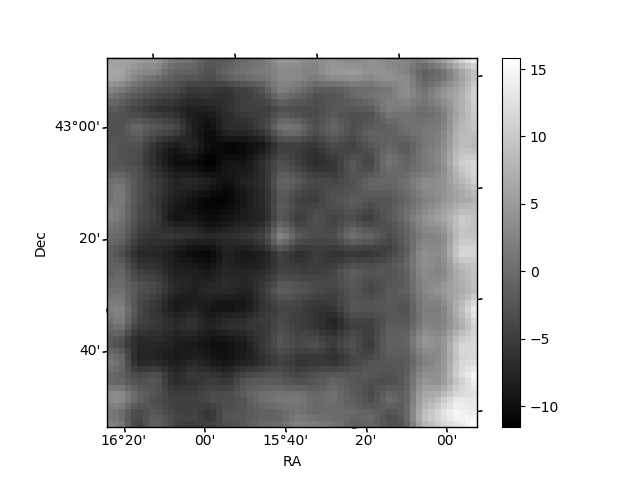
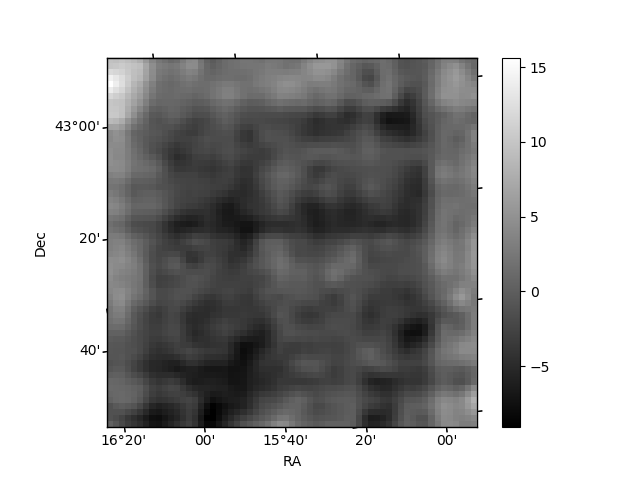
Histogram calculated using DETX and DETY for each event in the final _common_clean file
| Quadrant A | 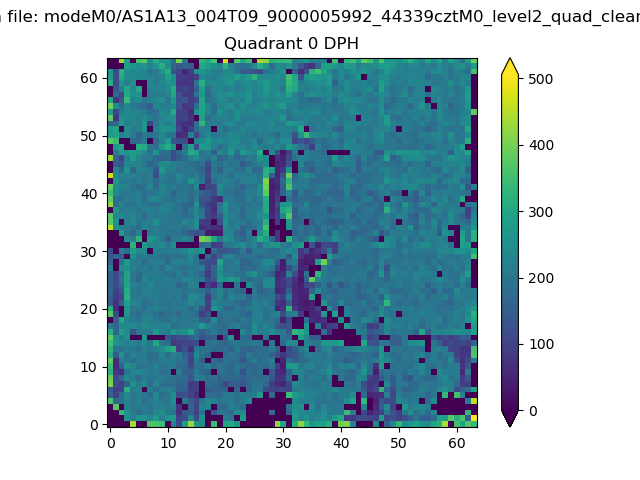 |
 |
Quadrant B |
|---|---|---|---|
| Quadrant D | 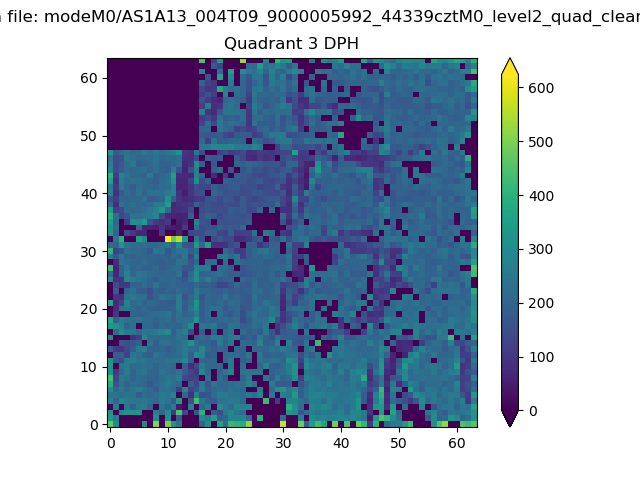 |
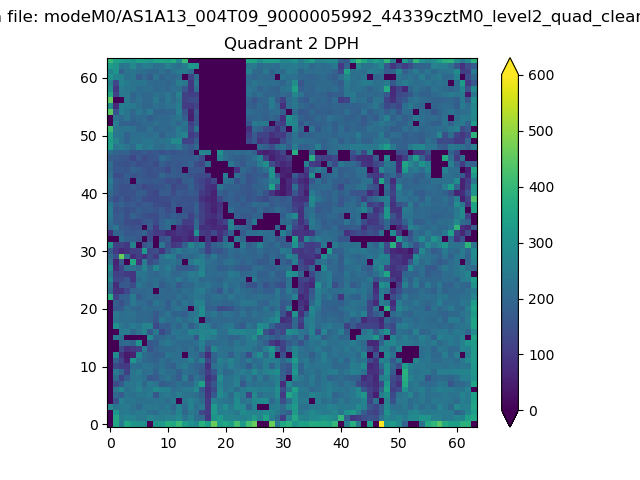 |
Quadrant C |
| Plot type | Count rate plots | Images |
|---|---|---|
| Comparison with Poisson distribution Blue bars denote a histogram of data divided into 1 sec bins. Red curve is a Poisson curve with rate = median count rate of data. |
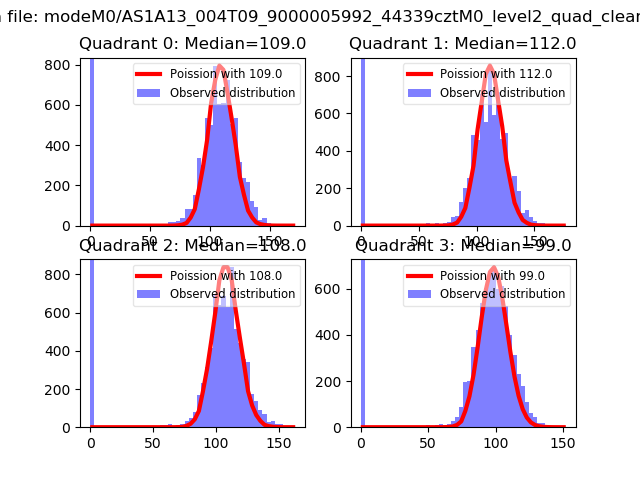 |
 |
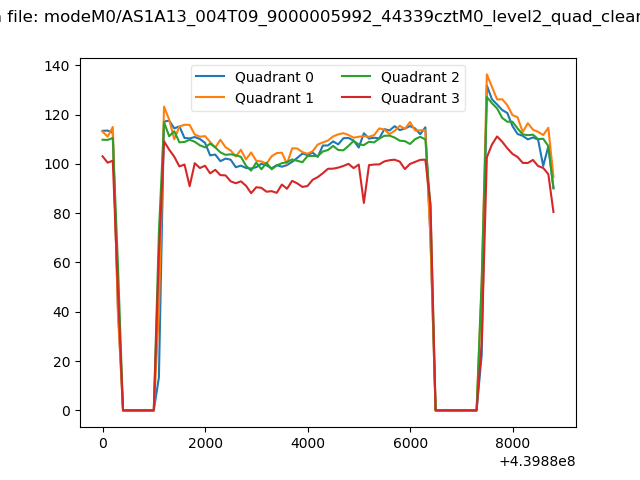
| Quadrant-wise count rates Data is divided into 100 sec bins |
 |
|
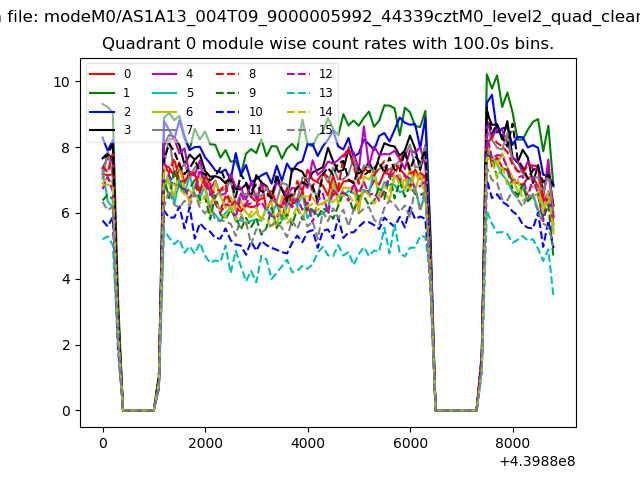
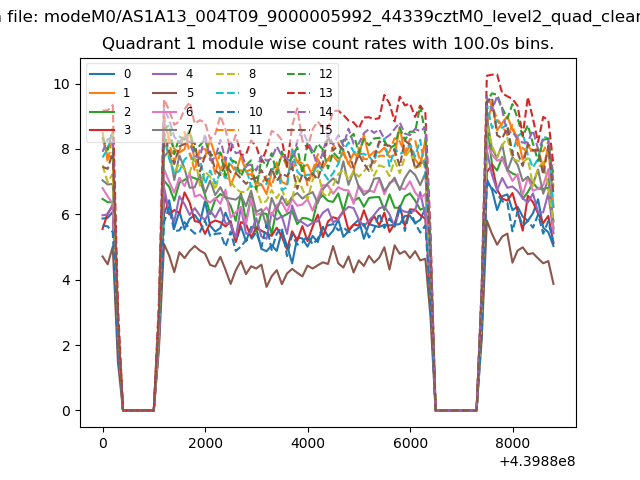
| Module-wise count rates for Quadrant A Data is divided into 100 sec bins |
 |
 |
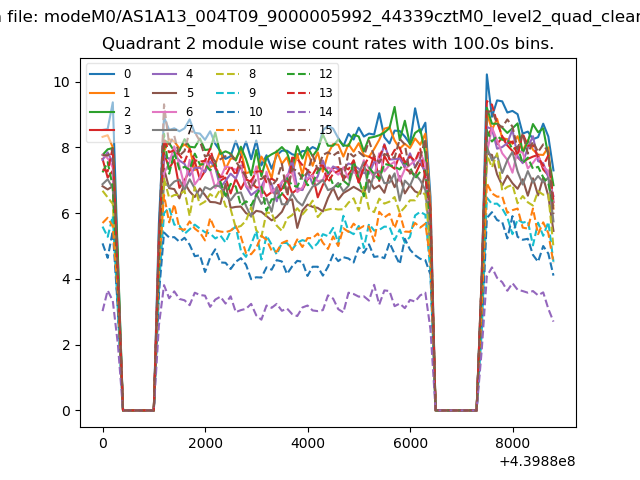
| Module-wise count rates for Quadrant B Data is divided into 100 sec bins |
 |
 |
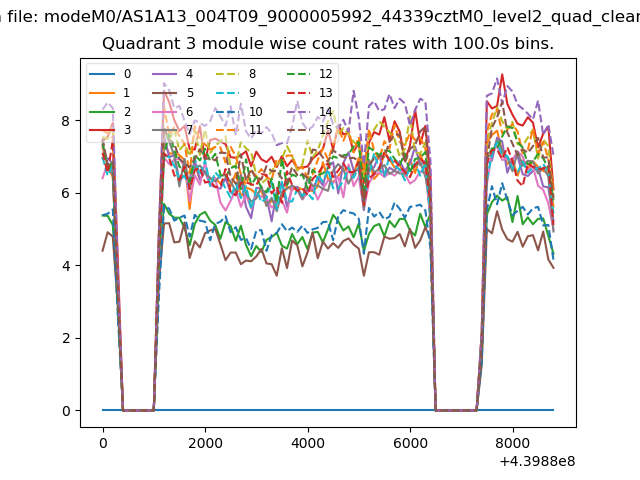
| Module-wise count rates for Quadrant C Data is divided into 100 sec bins |
 |
 |
| Module-wise count rates for Quadrant D Data is divided into 100 sec bins |
 |
 |
| Parameter | Plot |
|---|---|
| CZT HV Monitor | 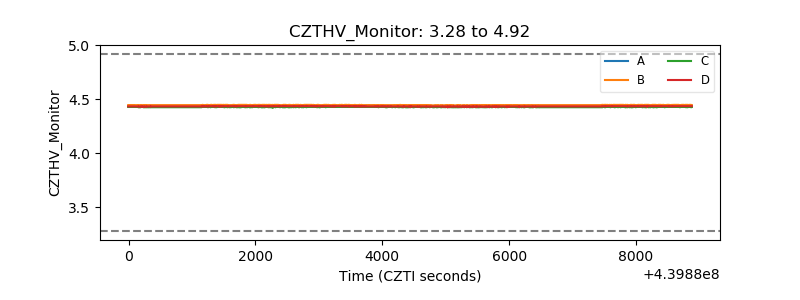 |
| D_VDD | 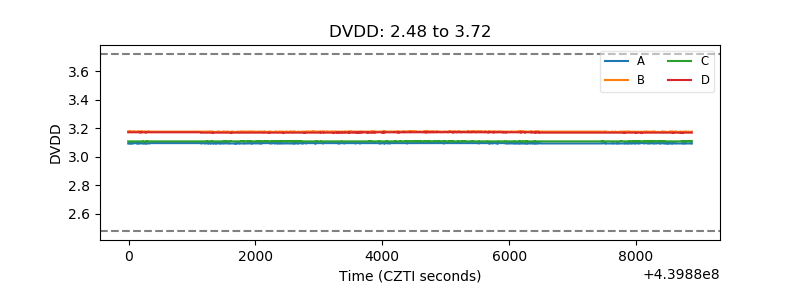 |
| Temperature 1 | 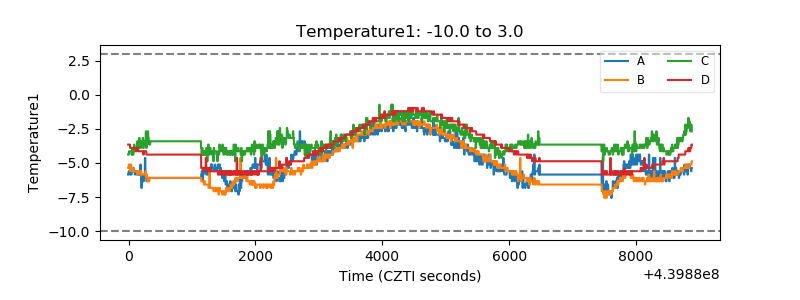 |
| Veto HV Monitor | 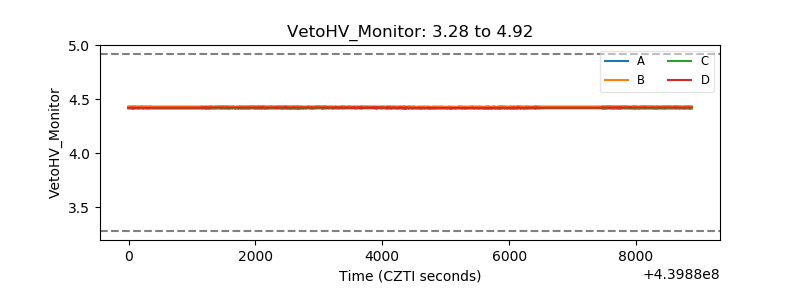 |
| Veto LLD | 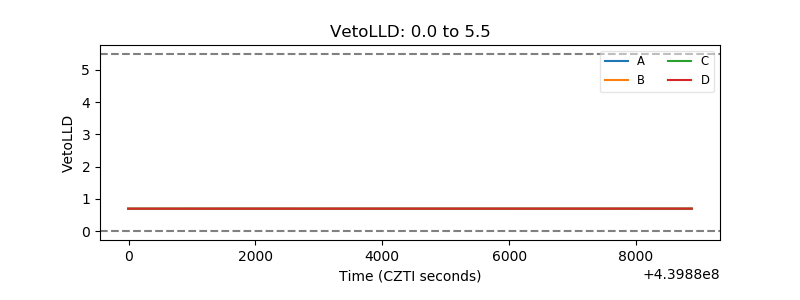 |
| Alpha Counter | 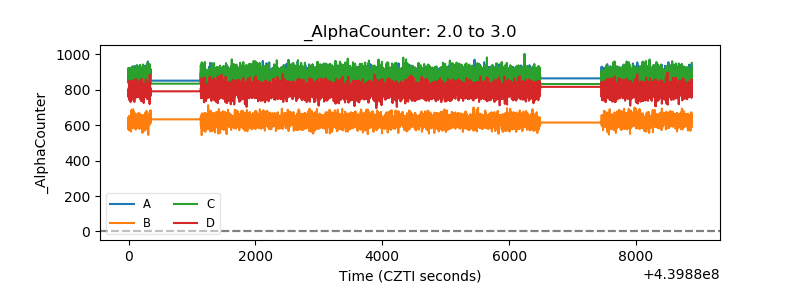 |
| _CPM_Rate | 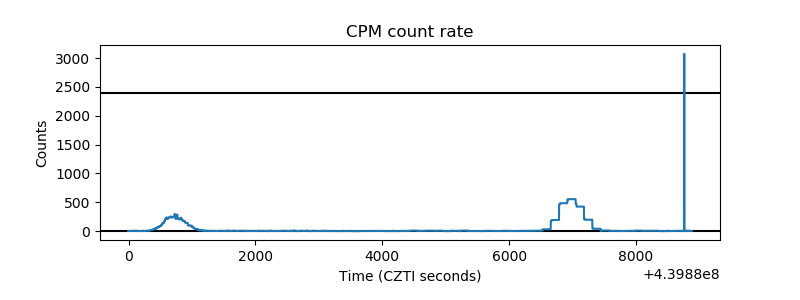 |
| CZT Counter | 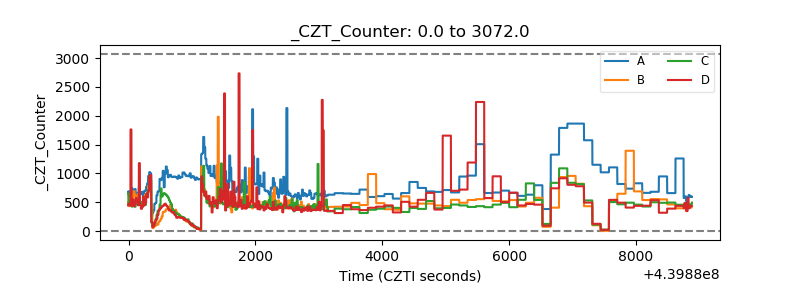 |
| +2.5 Volts monitor | 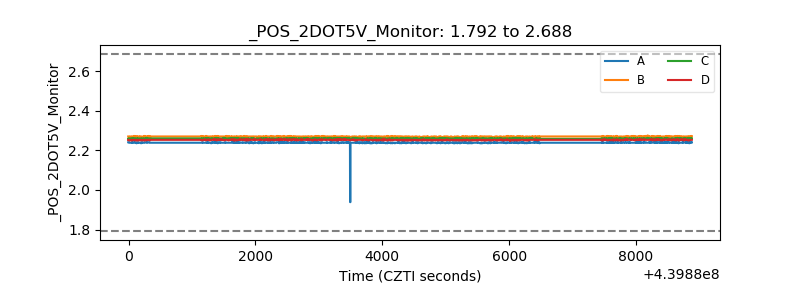 |
| +5 Volts monitor | 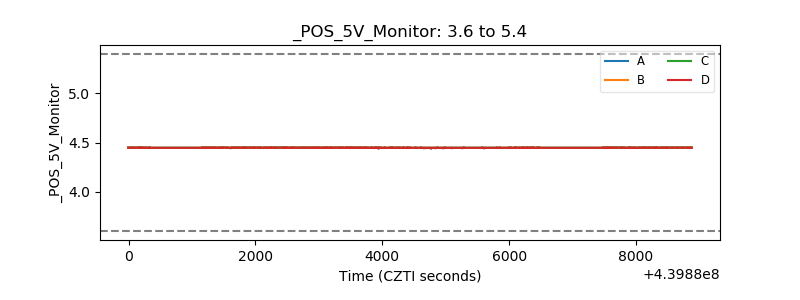 |
| _ROLL_ROT | 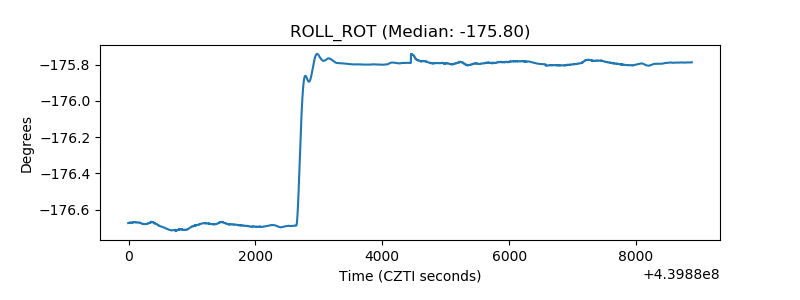 |
| _Roll_DEC | 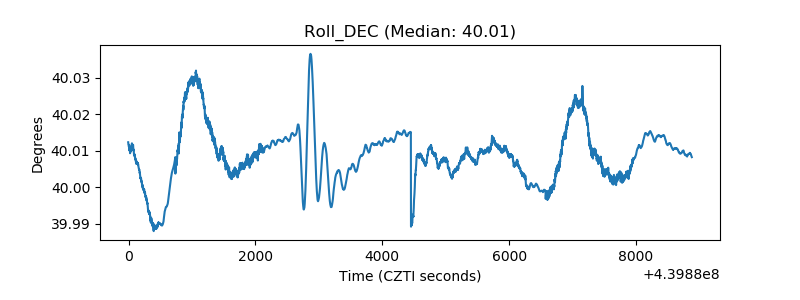 |
| _Roll_RA | 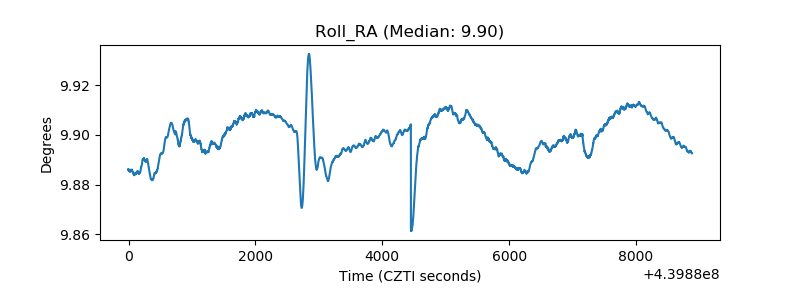 |
| Veto Counter | 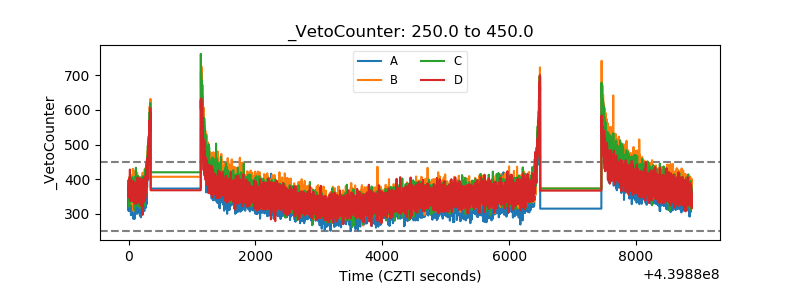 |