| Param | Original file | Final file |
|---|---|---|
| Filename | modeM0/AS1A13_004T09_9000005992_44341cztM0_level2.fits | modeM0/AS1A13_004T09_9000005992_44341cztM0_level2_quad_clean.evt |
| Size (bytes) | 443,966,400 | 110,191,680 |
| Size | 423.4 MB | 105.1 MB |
| Events in quadrant A | 4,903,778 | 733,726 |
| Events in quadrant B | 3,478,474 | 764,006 |
| Events in quadrant C | 3,060,547 | 734,248 |
| Events in quadrant D | 4,481,064 | 646,256 |
| Mode SS | |||
|---|---|---|---|
| Quadrant | BADHDUFLAG | Total packets | Discarded packets |
| A | 0 | 134 | 0 |
| B | 0 | 134 | 0 |
| C | 0 | 134 | 0 |
| D | 0 | 134 | 0 |
| Mode M9 | |||
|---|---|---|---|
| Quadrant | BADHDUFLAG | Total packets | Discarded packets |
| A | 0 | 18 | 0 |
| B | 0 | 19 | 0 |
| C | 0 | 19 | 0 |
| D | 0 | 19 | 0 |
| Mode M0 | |||
|---|---|---|---|
| Quadrant | BADHDUFLAG | Total packets | Discarded packets |
| A | 0 | 20025 | 2 |
| B | 0 | 14558 | 2 |
| C | 0 | 13660 | 3 |
| D | 0 | 17667 | 2 |
| Quadrant | Total seconds | Saturated seconds | Saturation percentage |
|---|---|---|---|
| A | 6568 | 219 | 3.334348% |
| B | 6568 | 124 | 1.887942% |
| C | 6567 | 62 | 0.944115% |
| D | 6567 | 403 | 6.136744% |
Noise dominated data is calculated using 1-second bins in cleaned event files. If a bin has >2000 counts, and if more than 50% of those come from <1% of pixels, then it is considered to be noise-dominated and hence unusable.
| Quadrant | # 1 sec bins | Bins with >0 counts | Bins with >2000 counts | High rate bins dominated by noise | Noise dominated (total time) | Noise dominated (detector-on time) | Marked lightcurve |
|---|---|---|---|---|---|---|---|
| A | 7623 | 6568 | 41 | 41 | 0.54% | 0.62% | 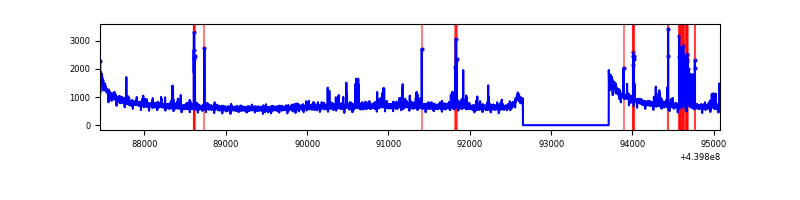 |
| B | 7623 | 6568 | 17 | 17 | 0.22% | 0.26% | 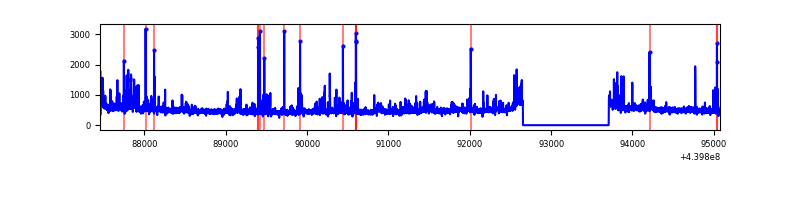 |
| C | 7622 | 6567 | 5 | 5 | 0.07% | 0.08% | 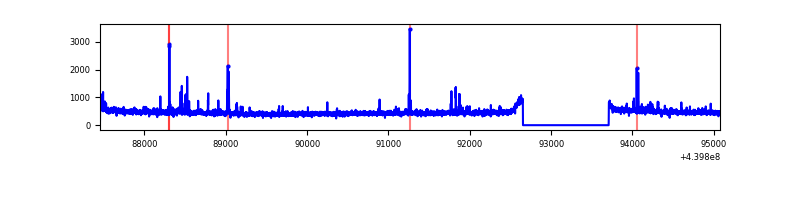 |
| D | 7622 | 6567 | 300 | 300 | 3.94% | 4.57% | 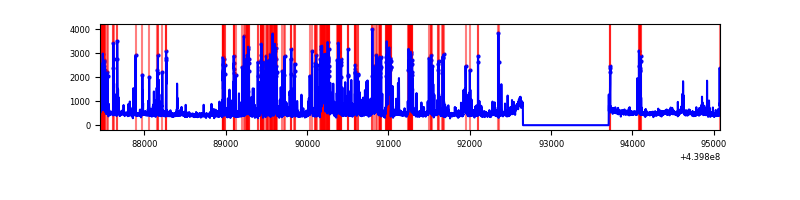 |
Top three noisy pixels from each quadrant. If the there are fewer than three noisy pixels in the level2.evt file, extra rows are filled as -1
| Pixel properties | Quadrant properties | ||||||
|---|---|---|---|---|---|---|---|
| Quadrant | DetID | PixID | Counts | Sigma | Mean | Median | Sigma |
| A | 10 | 83 | 1637566 | 10262.33 | 767 | 751 | 159.5 |
| A | 13 | 248 | 205203 | 1281.85 | 767 | 751 | 159.5 |
| A | 15 | 223 | 43528 | 268.2 | 767 | 751 | 159.5 |
| B | 5 | 255 | 127694 | 841.51 | 766 | 744 | 150.9 |
| B | 0 | 219 | 97156 | 639.08 | 766 | 744 | 150.9 |
| B | 0 | 199 | 77041 | 505.75 | 766 | 744 | 150.9 |
| C | 14 | 254 | 89564 | 501.38 | 753 | 756 | 177.1 |
| C | 1 | 3 | 14311 | 76.52 | 753 | 756 | 177.1 |
| C | 14 | 96 | 9764 | 50.85 | 753 | 756 | 177.1 |
| D | 13 | 249 | 1026849 | 5456.37 | 740 | 717 | 188.1 |
| D | 2 | 153 | 150364 | 795.74 | 740 | 717 | 188.1 |
| D | 5 | 33 | 93765 | 494.77 | 740 | 717 | 188.1 |
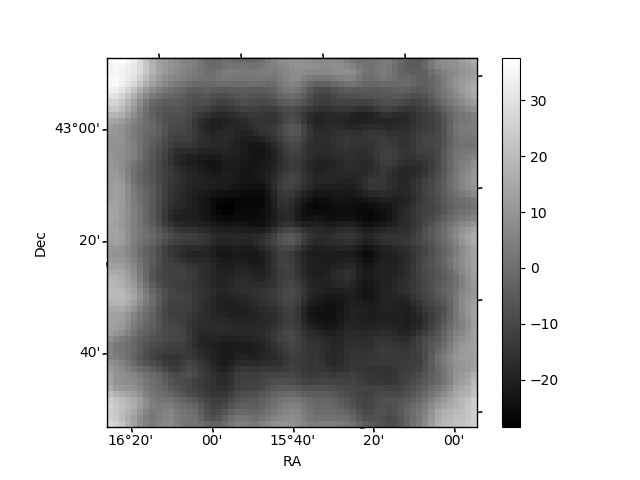
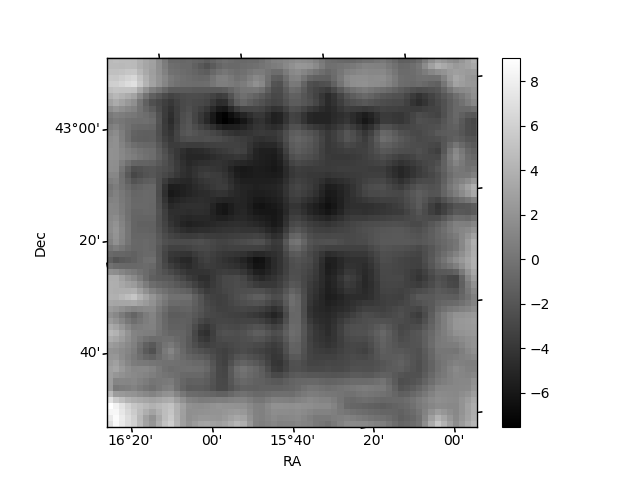
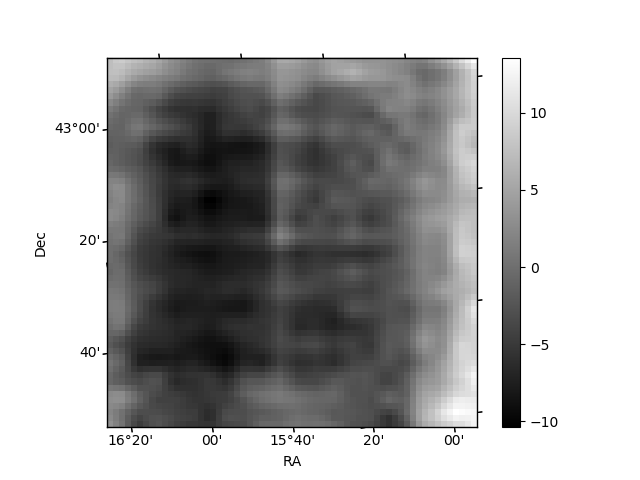
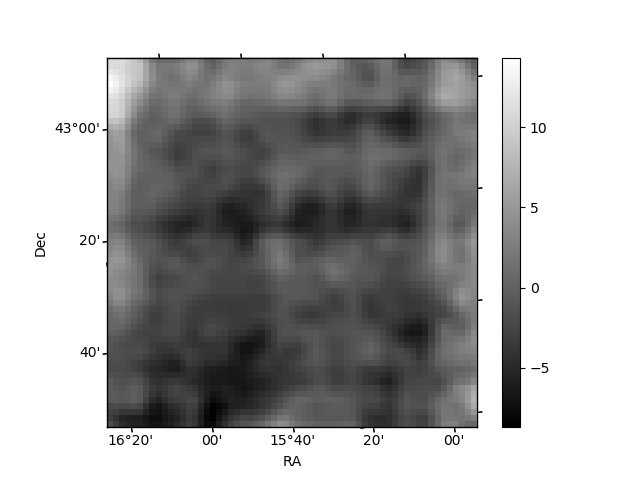
Histogram calculated using DETX and DETY for each event in the final _common_clean file
| Quadrant A | 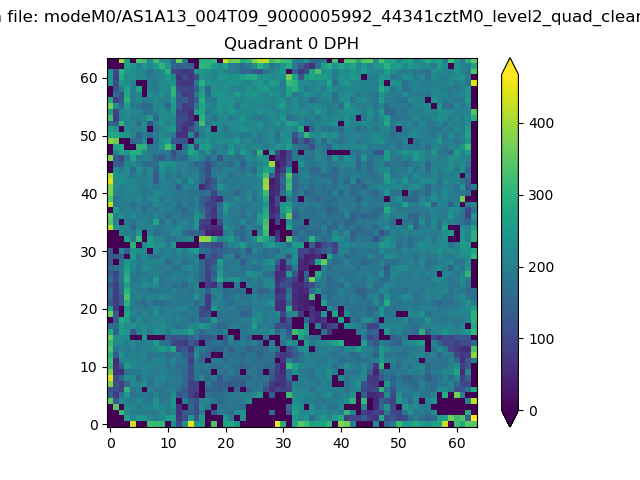 |
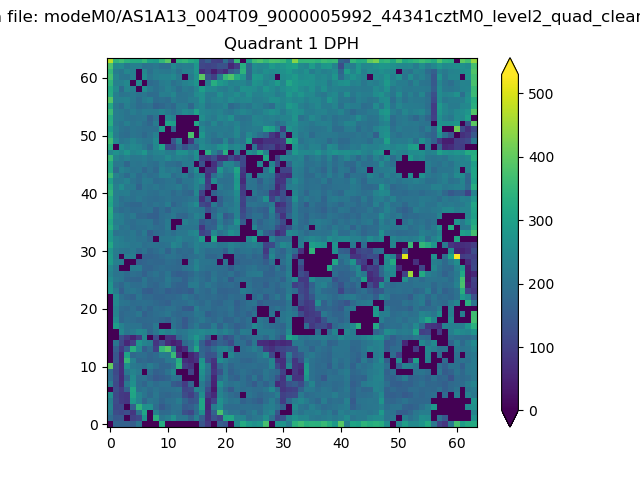 |
Quadrant B |
|---|---|---|---|
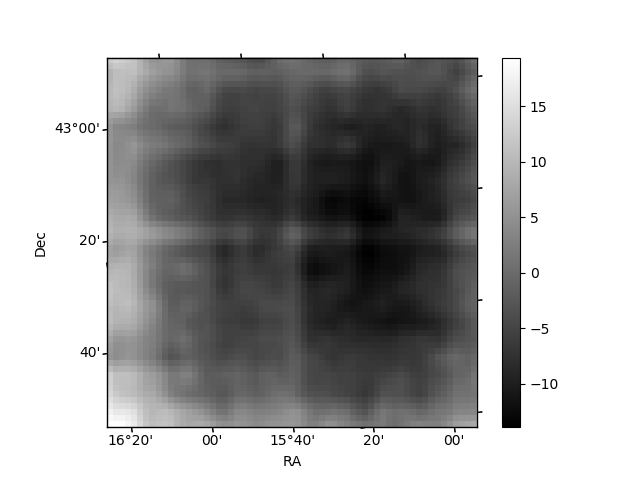
| Quadrant D | 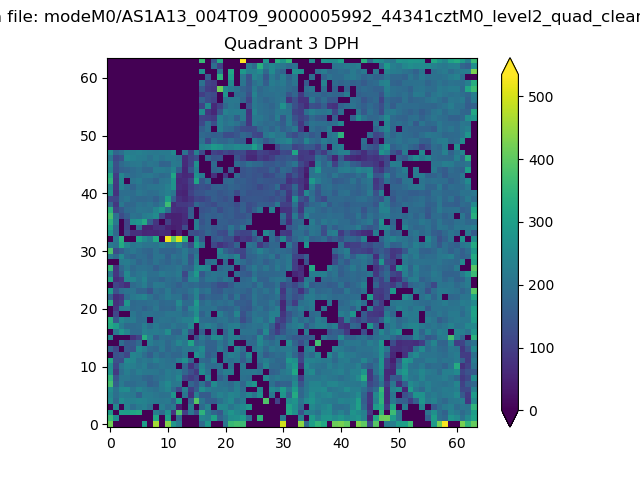 |
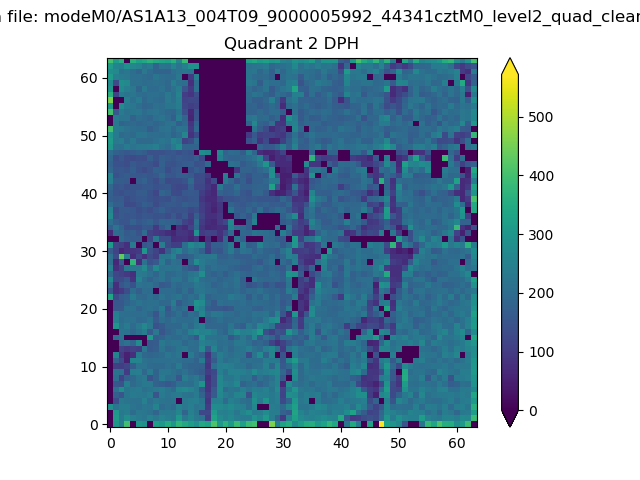 |
Quadrant C |
| Plot type | Count rate plots | Images |
|---|---|---|
| Comparison with Poisson distribution Blue bars denote a histogram of data divided into 1 sec bins. Red curve is a Poisson curve with rate = median count rate of data. |
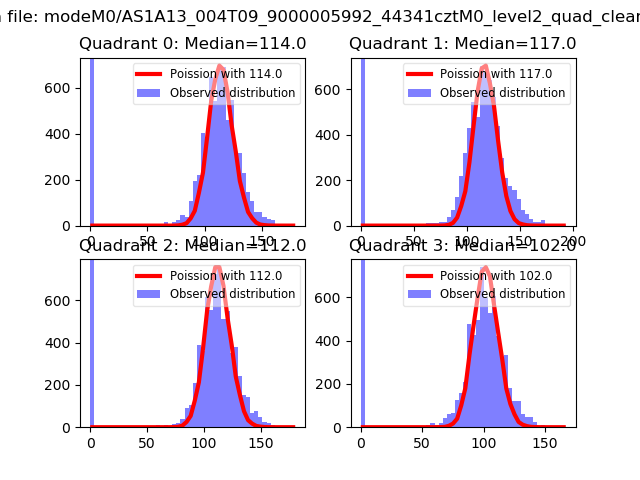 |
 |
| Quadrant-wise count rates Data is divided into 100 sec bins |
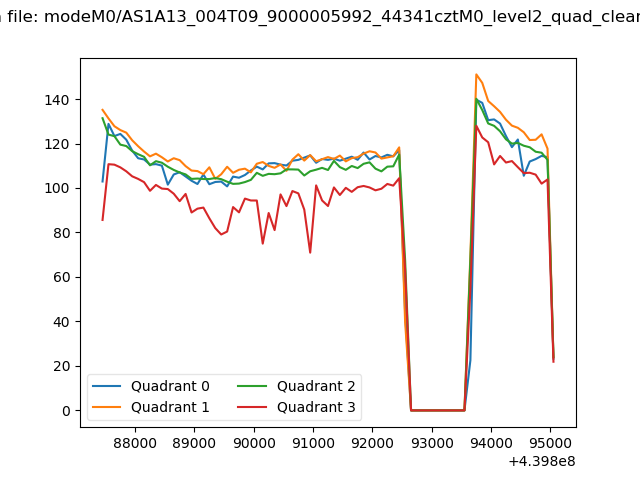 |
|
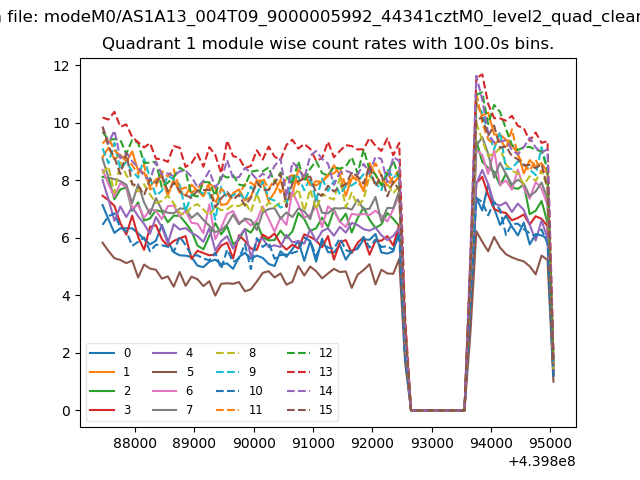
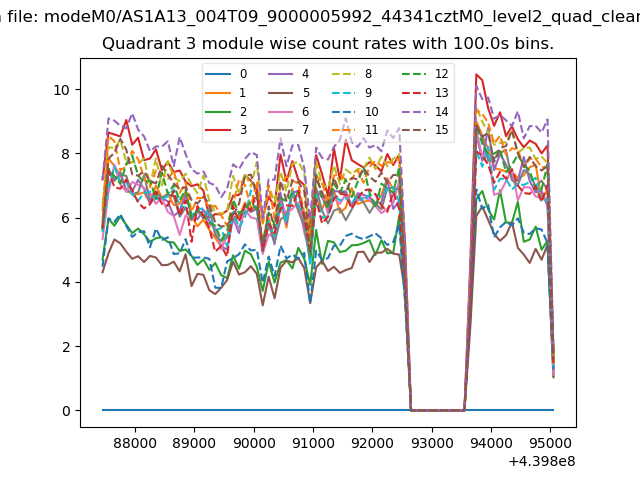
| Module-wise count rates for Quadrant A Data is divided into 100 sec bins |
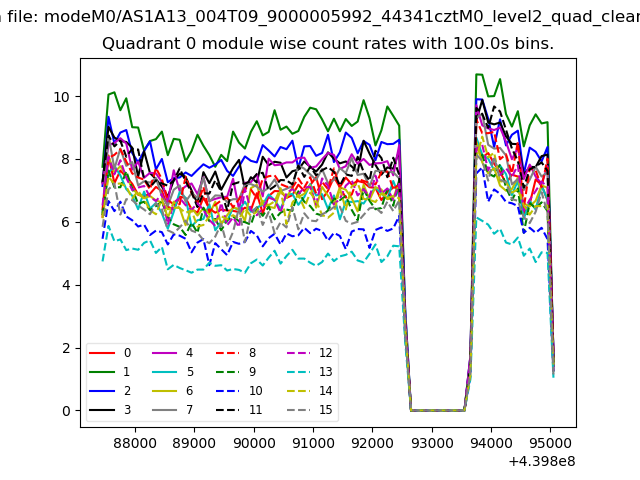 |
 |
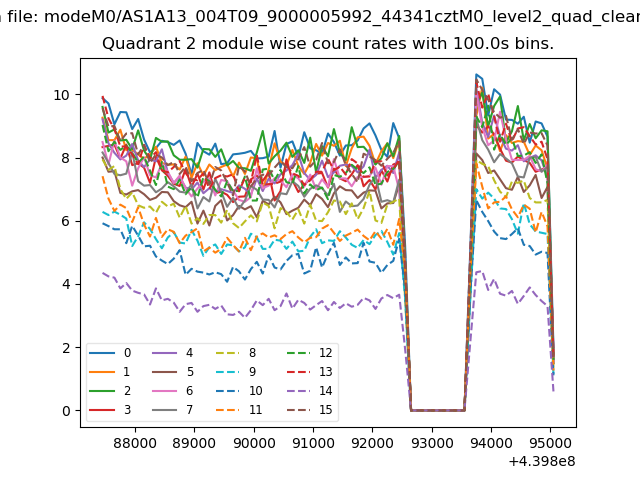
| Module-wise count rates for Quadrant B Data is divided into 100 sec bins |
 |
 |
| Module-wise count rates for Quadrant C Data is divided into 100 sec bins |
 |
 |
| Module-wise count rates for Quadrant D Data is divided into 100 sec bins |
 |
 |
| Parameter | Plot |
|---|---|
| CZT HV Monitor | 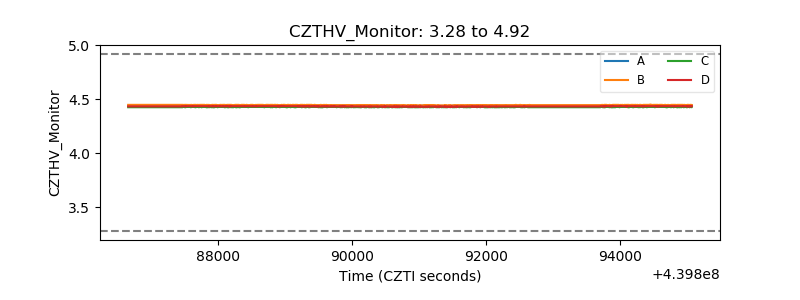 |
| D_VDD | 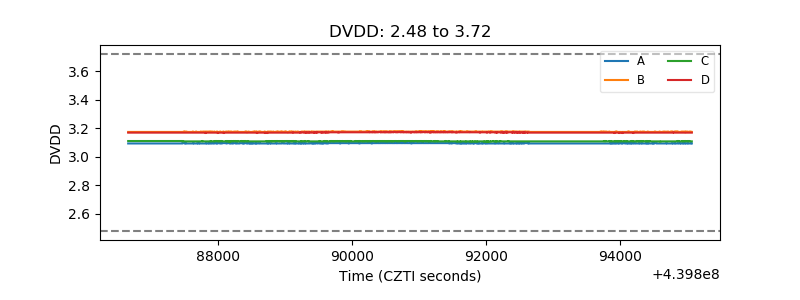 |
| Temperature 1 | 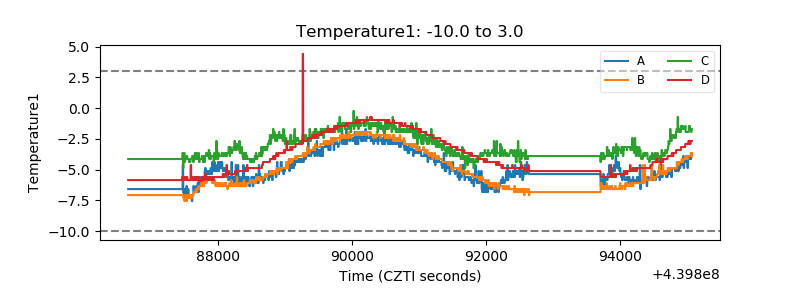 |
| Veto HV Monitor | 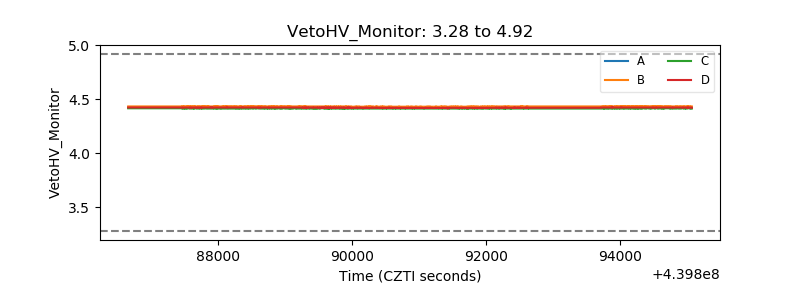 |
| Veto LLD | 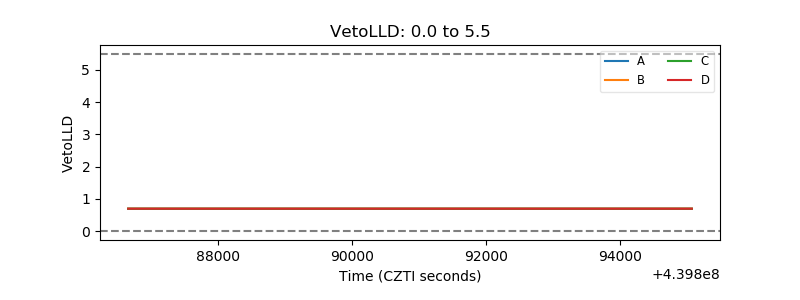 |
| Alpha Counter | 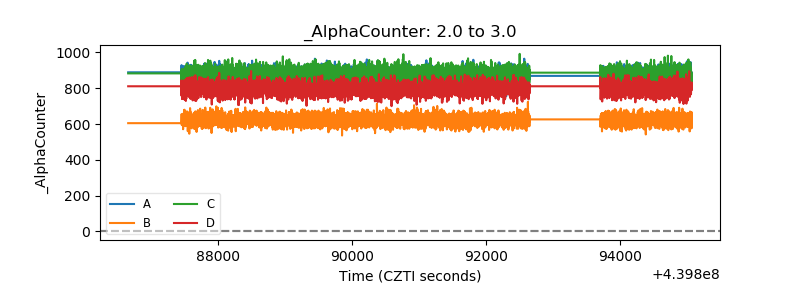 |
| _CPM_Rate | 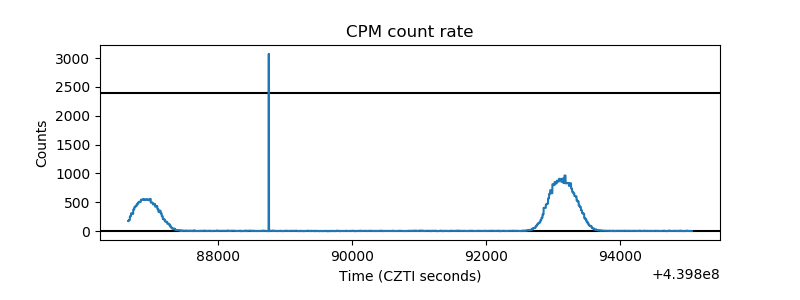 |
| CZT Counter | 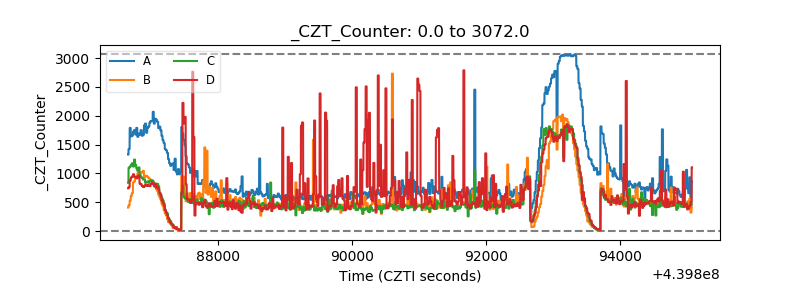 |
| +2.5 Volts monitor | 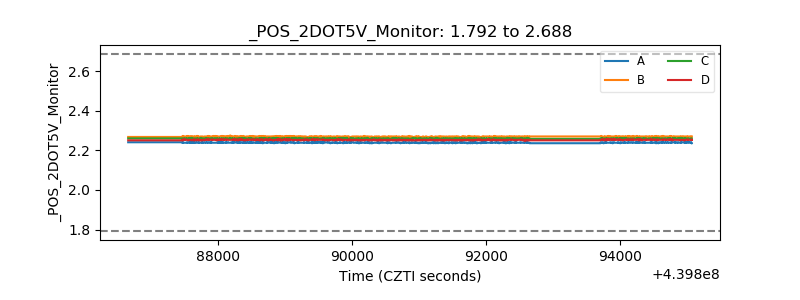 |
| +5 Volts monitor | 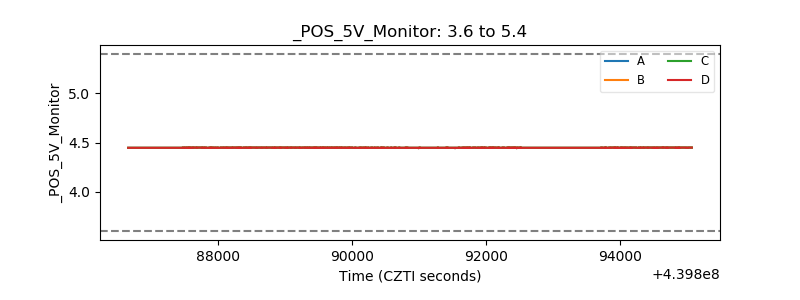 |
| _ROLL_ROT | 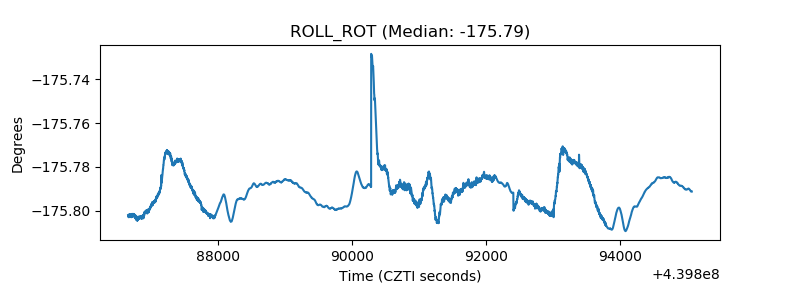 |
| _Roll_DEC | 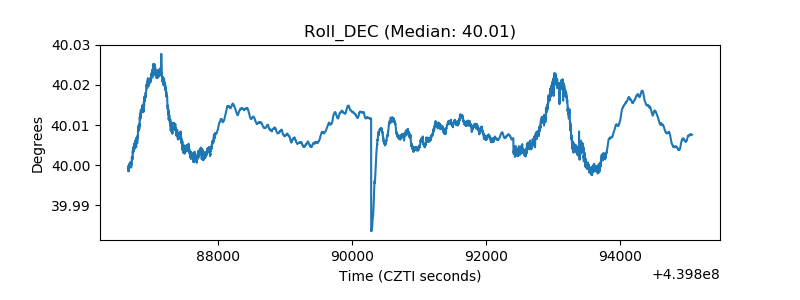 |
| _Roll_RA | 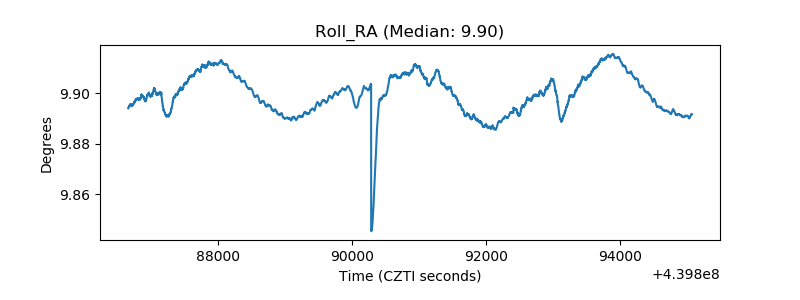 |
| Veto Counter | 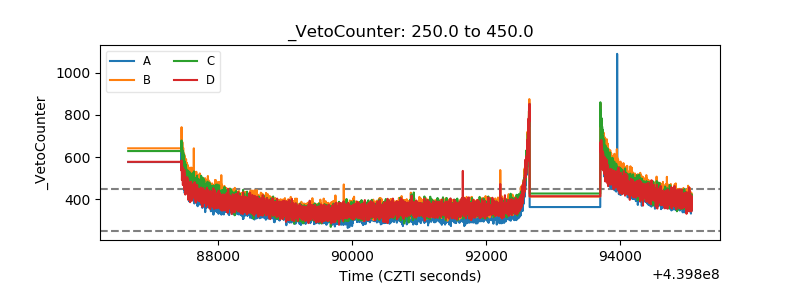 |