| Param | Original file | Final file |
|---|---|---|
| Filename | modeM0/AS1A13_004T09_9000005992_44342cztM0_level2.fits | modeM0/AS1A13_004T09_9000005992_44342cztM0_level2_quad_clean.evt |
| Size (bytes) | 447,943,680 | 112,812,480 |
| Size | 427.2 MB | 107.6 MB |
| Events in quadrant A | 5,167,576 | 749,092 |
| Events in quadrant B | 3,432,654 | 792,836 |
| Events in quadrant C | 3,189,343 | 753,336 |
| Events in quadrant D | 4,288,914 | 669,495 |
| Mode SS | |||
|---|---|---|---|
| Quadrant | BADHDUFLAG | Total packets | Discarded packets |
| A | 0 | 132 | 0 |
| B | 0 | 132 | 0 |
| C | 0 | 132 | 0 |
| D | 0 | 132 | 0 |
| Mode M9 | |||
|---|---|---|---|
| Quadrant | BADHDUFLAG | Total packets | Discarded packets |
| A | 0 | 18 | 0 |
| B | 0 | 19 | 0 |
| C | 0 | 19 | 0 |
| D | 0 | 19 | 0 |
| Mode M0 | |||
|---|---|---|---|
| Quadrant | BADHDUFLAG | Total packets | Discarded packets |
| A | 0 | 20910 | 2 |
| B | 0 | 14267 | 2 |
| C | 0 | 13796 | 2 |
| D | 0 | 16926 | 2 |
| Quadrant | Total seconds | Saturated seconds | Saturation percentage |
|---|---|---|---|
| A | 6468 | 341 | 5.272109% |
| B | 6468 | 118 | 1.824366% |
| C | 6468 | 65 | 1.004947% |
| D | 6468 | 369 | 5.705009% |
Noise dominated data is calculated using 1-second bins in cleaned event files. If a bin has >2000 counts, and if more than 50% of those come from <1% of pixels, then it is considered to be noise-dominated and hence unusable.
| Quadrant | # 1 sec bins | Bins with >0 counts | Bins with >2000 counts | High rate bins dominated by noise | Noise dominated (total time) | Noise dominated (detector-on time) | Marked lightcurve |
|---|---|---|---|---|---|---|---|
| A | 7613 | 6468 | 103 | 103 | 1.35% | 1.59% | 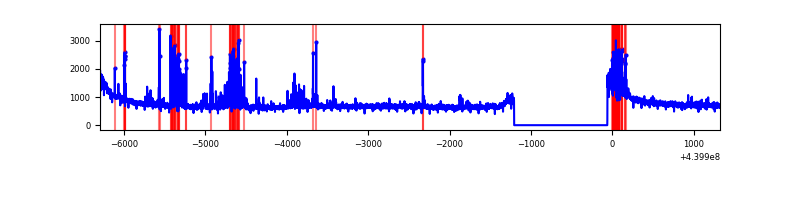 |
| B | 7613 | 6468 | 12 | 12 | 0.16% | 0.19% | 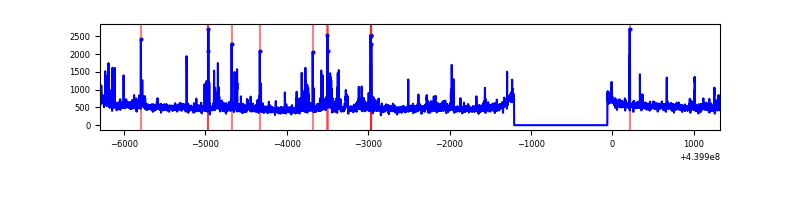 |
| C | 7613 | 6468 | 20 | 20 | 0.26% | 0.31% | 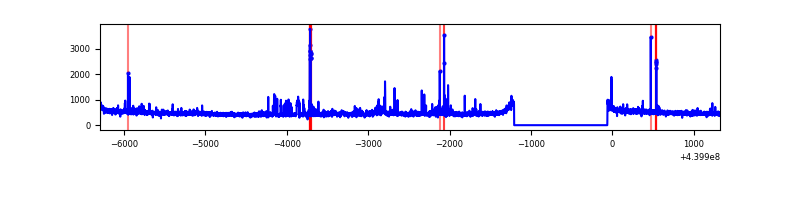 |
| D | 7613 | 6468 | 313 | 313 | 4.11% | 4.84% | 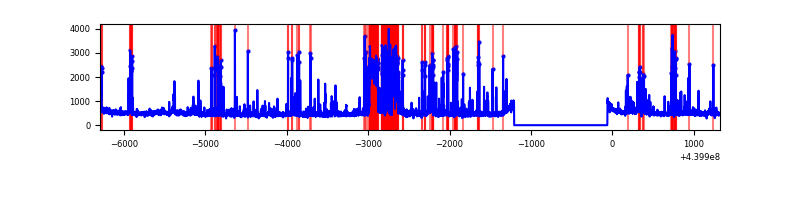 |
Top three noisy pixels from each quadrant. If the there are fewer than three noisy pixels in the level2.evt file, extra rows are filled as -1
| Pixel properties | Quadrant properties | ||||||
|---|---|---|---|---|---|---|---|
| Quadrant | DetID | PixID | Counts | Sigma | Mean | Median | Sigma |
| A | 10 | 83 | 1639834 | 10246.54 | 774 | 758 | 160.0 |
| A | 13 | 248 | 475585 | 2968.34 | 774 | 758 | 160.0 |
| A | 15 | 223 | 20617 | 124.15 | 774 | 758 | 160.0 |
| B | 0 | 199 | 69872 | 453.26 | 776 | 753 | 152.5 |
| B | 5 | 255 | 66298 | 429.82 | 776 | 753 | 152.5 |
| B | 0 | 155 | 58017 | 375.52 | 776 | 753 | 152.5 |
| C | 3 | 233 | 120884 | 677.65 | 755 | 758 | 177.3 |
| C | 14 | 254 | 98822 | 553.2 | 755 | 758 | 177.3 |
| C | 1 | 3 | 18134 | 98.02 | 755 | 758 | 177.3 |
| D | 13 | 249 | 852029 | 4575.39 | 744 | 721 | 186.1 |
| D | 2 | 153 | 225668 | 1208.99 | 744 | 721 | 186.1 |
| D | 12 | 1 | 99339 | 530.03 | 744 | 721 | 186.1 |
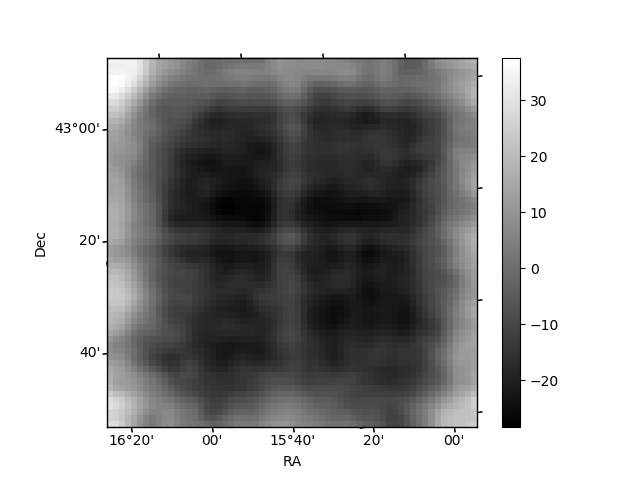
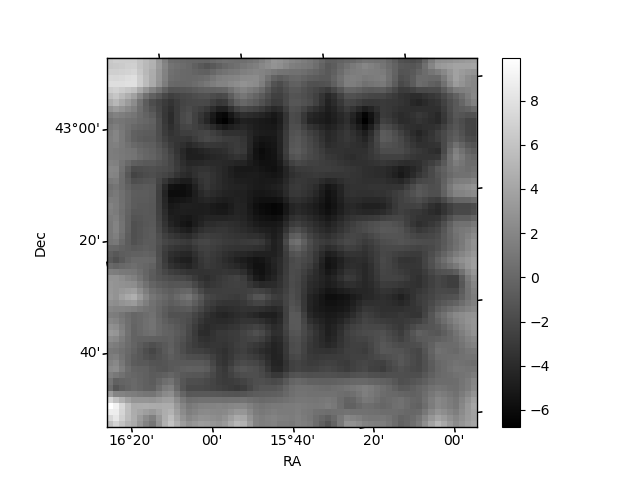
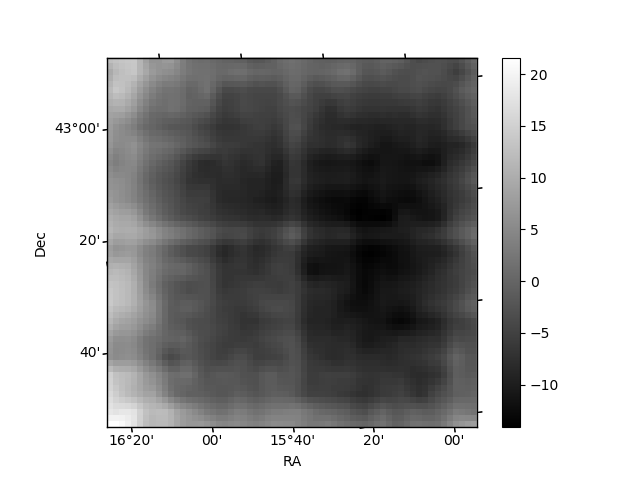
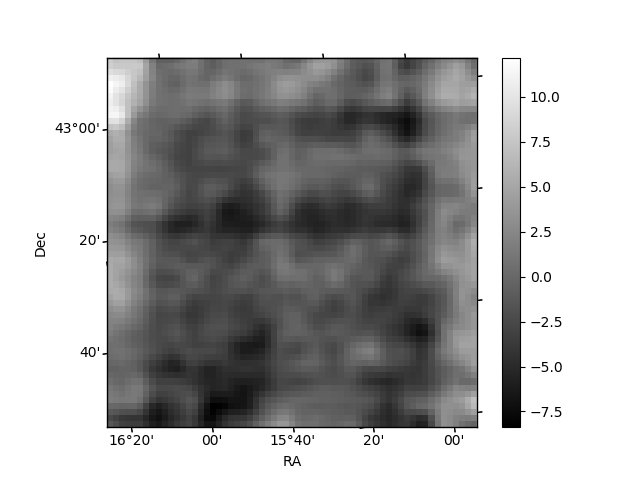
Histogram calculated using DETX and DETY for each event in the final _common_clean file
| Quadrant A | 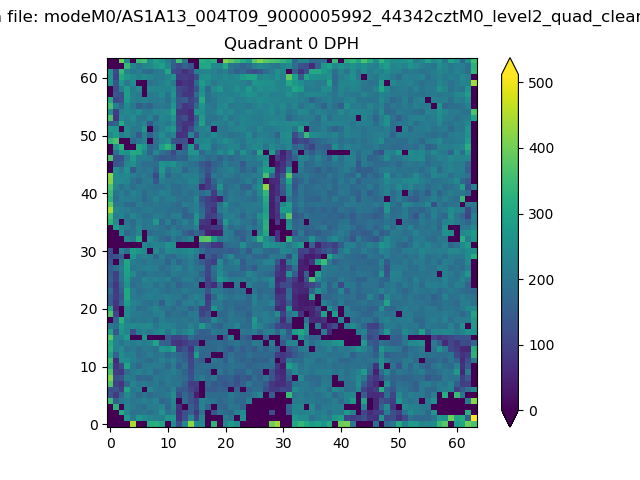 |
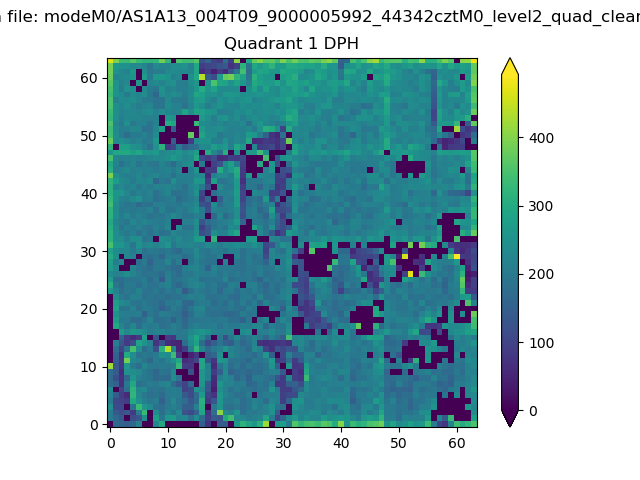 |
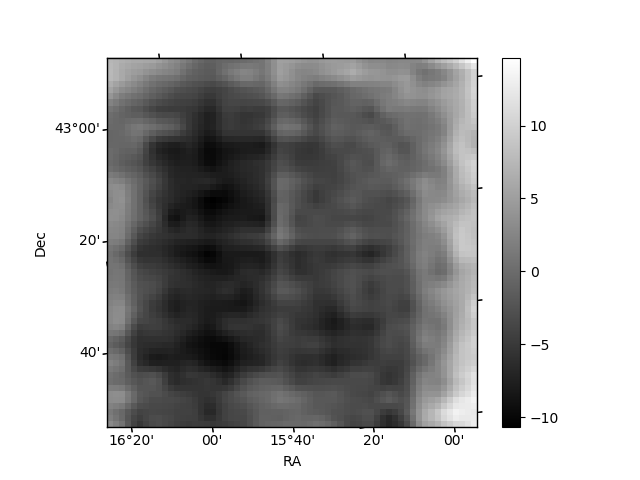
Quadrant B |
|---|---|---|---|
| Quadrant D | 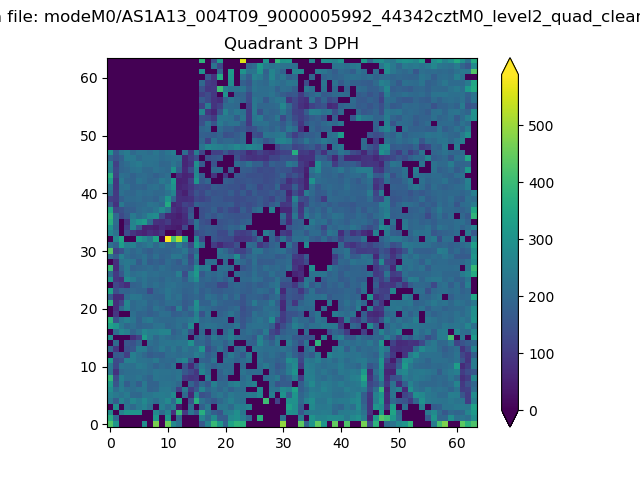 |
 |
Quadrant C |
| Plot type | Count rate plots | Images |
|---|---|---|
| Comparison with Poisson distribution Blue bars denote a histogram of data divided into 1 sec bins. Red curve is a Poisson curve with rate = median count rate of data. |
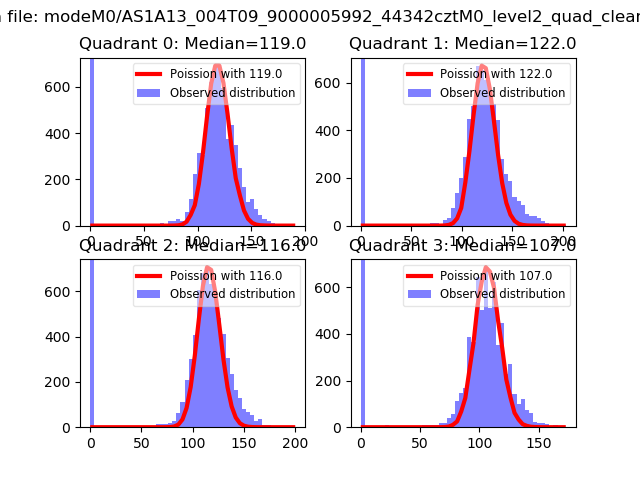 |
 |
| Quadrant-wise count rates Data is divided into 100 sec bins |
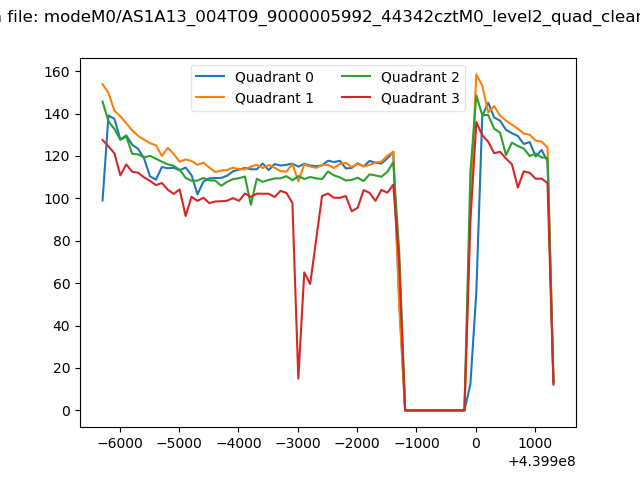 |
|
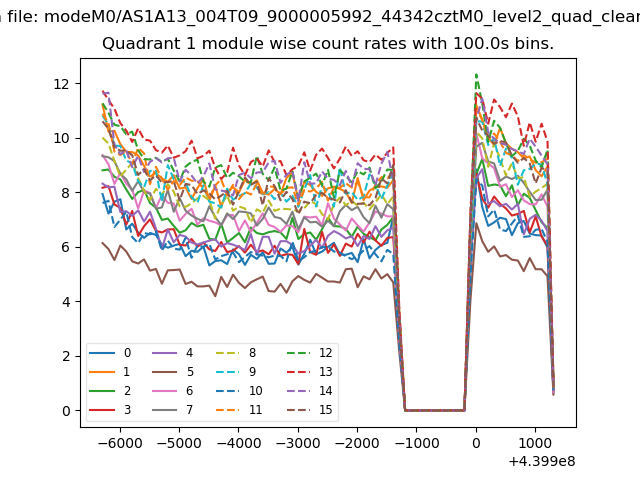
| Module-wise count rates for Quadrant A Data is divided into 100 sec bins |
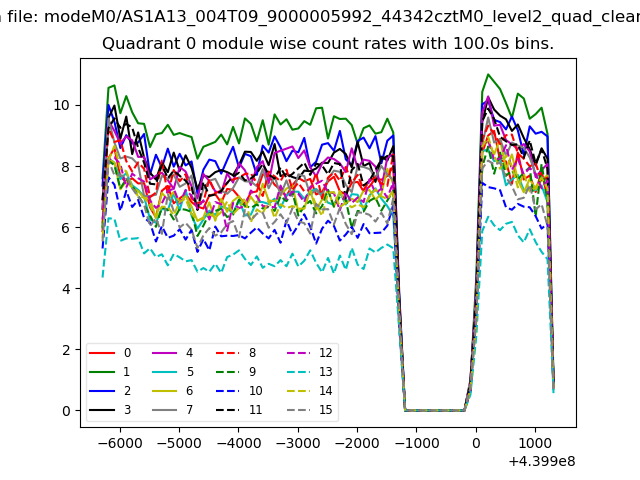 |
 |
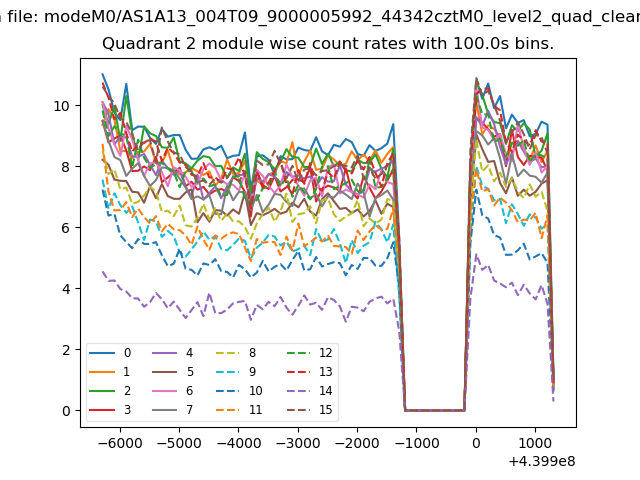
| Module-wise count rates for Quadrant B Data is divided into 100 sec bins |
 |
 |
| Module-wise count rates for Quadrant C Data is divided into 100 sec bins |
 |
 |
| Module-wise count rates for Quadrant D Data is divided into 100 sec bins |
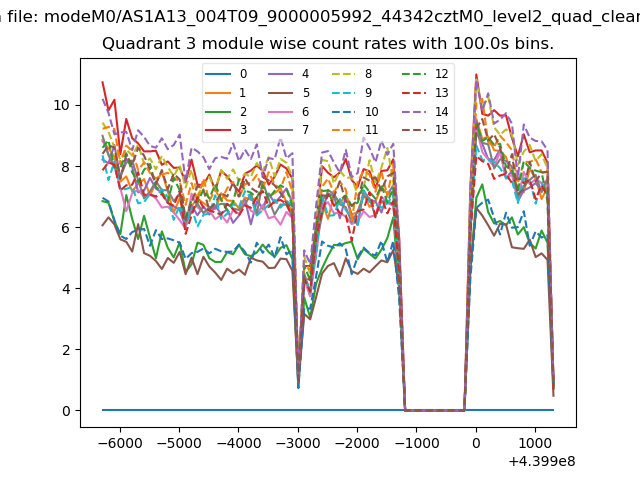 |
 |
| Parameter | Plot |
|---|---|
| CZT HV Monitor | 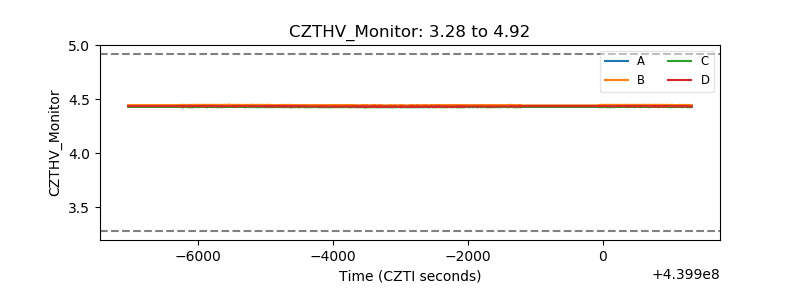 |
| D_VDD | 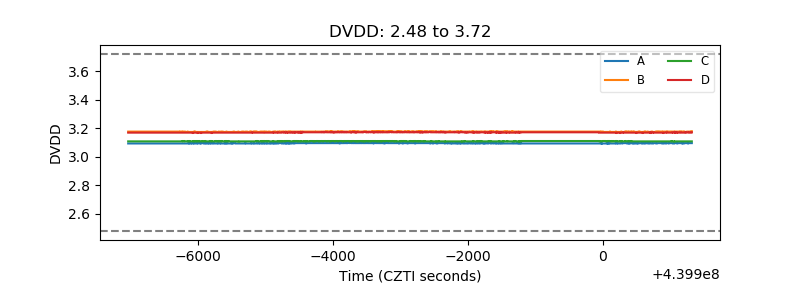 |
| Temperature 1 | 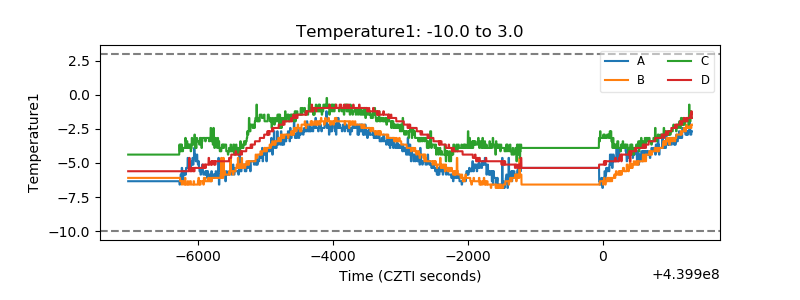 |
| Veto HV Monitor | 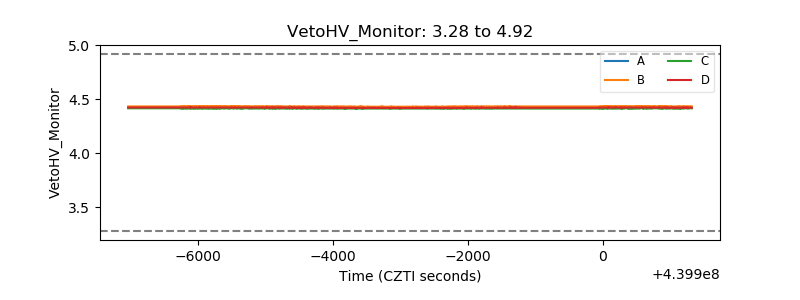 |
| Veto LLD | 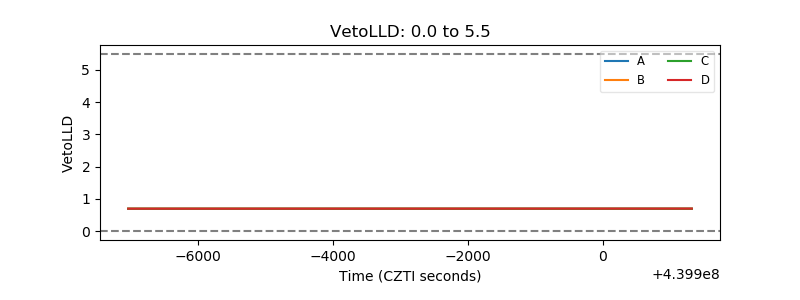 |
| Alpha Counter | 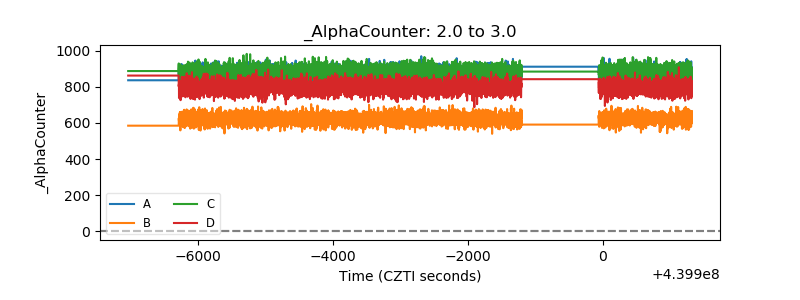 |
| _CPM_Rate | 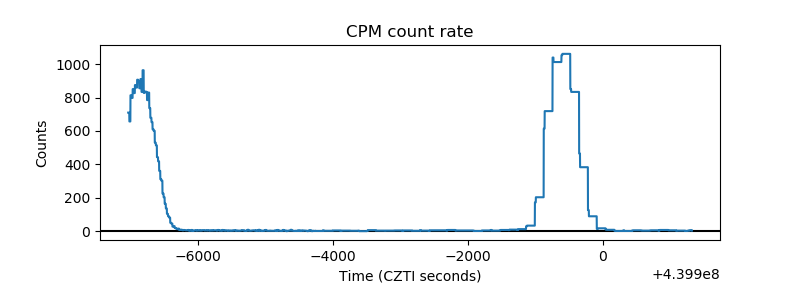 |
| CZT Counter |  |
| +2.5 Volts monitor | 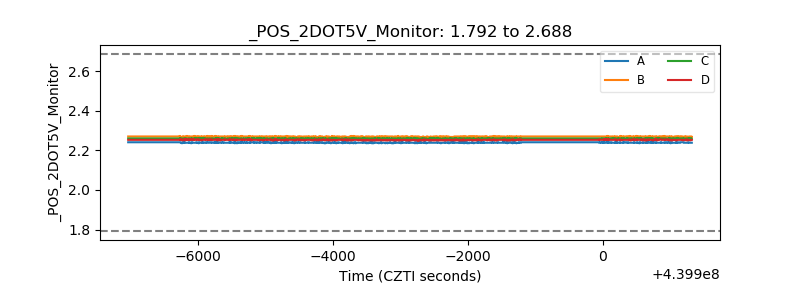 |
| +5 Volts monitor | 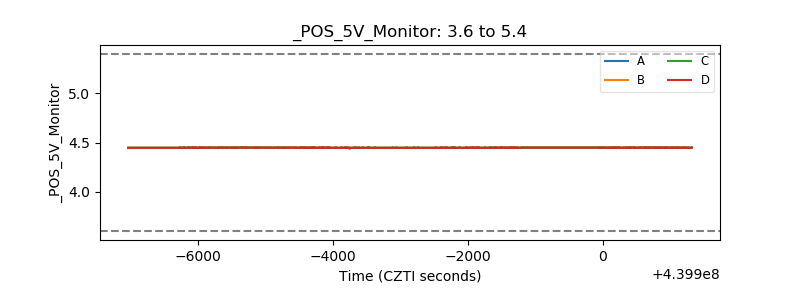 |
| _ROLL_ROT | 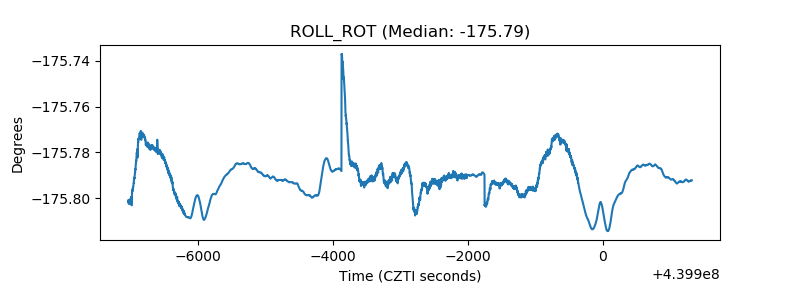 |
| _Roll_DEC | 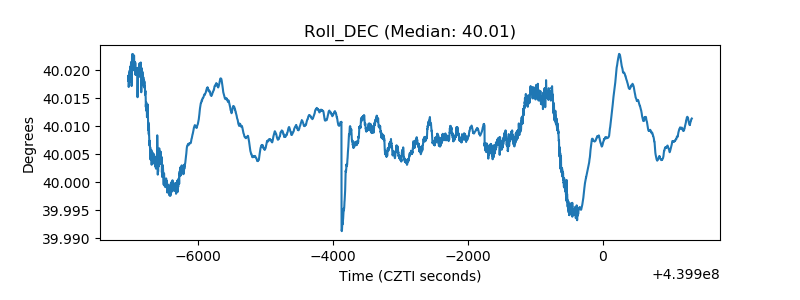 |
| _Roll_RA | 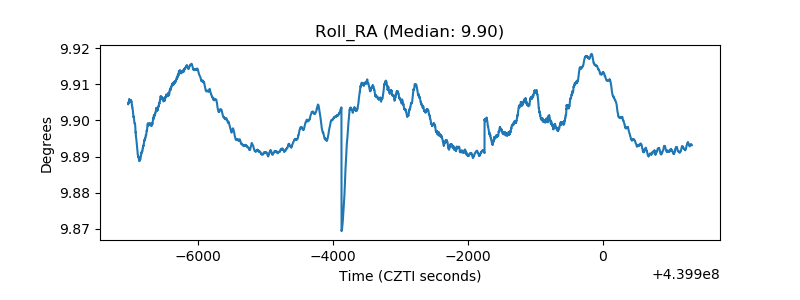 |
| Veto Counter | 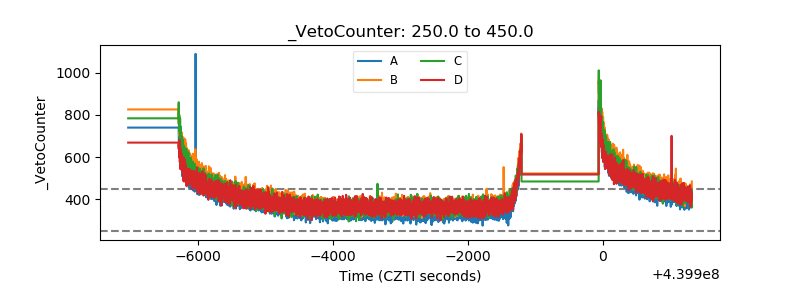 |