| Param | Original file | Final file |
|---|---|---|
| Filename | modeM0/AS1A13_004T09_9000005992_44344cztM0_level2.fits | modeM0/AS1A13_004T09_9000005992_44344cztM0_level2_quad_clean.evt |
| Size (bytes) | 423,529,920 | 110,525,760 |
| Size | 403.9 MB | 105.4 MB |
| Events in quadrant A | 4,877,143 | 747,148 |
| Events in quadrant B | 3,358,402 | 771,002 |
| Events in quadrant C | 3,233,923 | 723,996 |
| Events in quadrant D | 3,721,662 | 667,926 |
| Mode SS | |||
|---|---|---|---|
| Quadrant | BADHDUFLAG | Total packets | Discarded packets |
| A | 0 | 126 | 0 |
| B | 0 | 126 | 0 |
| C | 0 | 126 | 0 |
| D | 0 | 126 | 0 |
| Mode M9 | |||
|---|---|---|---|
| Quadrant | BADHDUFLAG | Total packets | Discarded packets |
| A | 0 | 11 | 0 |
| B | 0 | 11 | 0 |
| C | 0 | 11 | 0 |
| D | 0 | 11 | 0 |
| Mode M0 | |||
|---|---|---|---|
| Quadrant | BADHDUFLAG | Total packets | Discarded packets |
| A | 0 | 19749 | 1 |
| B | 0 | 13988 | 3 |
| C | 0 | 13856 | 1 |
| D | 0 | 15194 | 1 |
| Quadrant | Total seconds | Saturated seconds | Saturation percentage |
|---|---|---|---|
| A | 6256 | 247 | 3.948210% |
| B | 6255 | 149 | 2.382094% |
| C | 6256 | 154 | 2.461637% |
| D | 6256 | 230 | 3.676471% |
Noise dominated data is calculated using 1-second bins in cleaned event files. If a bin has >2000 counts, and if more than 50% of those come from <1% of pixels, then it is considered to be noise-dominated and hence unusable.
| Quadrant | # 1 sec bins | Bins with >0 counts | Bins with >2000 counts | High rate bins dominated by noise | Noise dominated (total time) | Noise dominated (detector-on time) | Marked lightcurve |
|---|---|---|---|---|---|---|---|
| A | 7411 | 6256 | 49 | 49 | 0.66% | 0.78% | 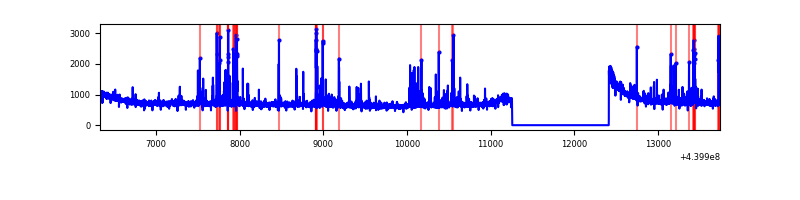 |
| B | 7410 | 6255 | 27 | 27 | 0.36% | 0.43% | 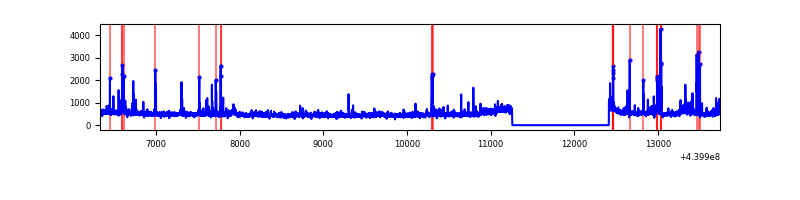 |
| C | 7411 | 6256 | 64 | 64 | 0.86% | 1.02% | 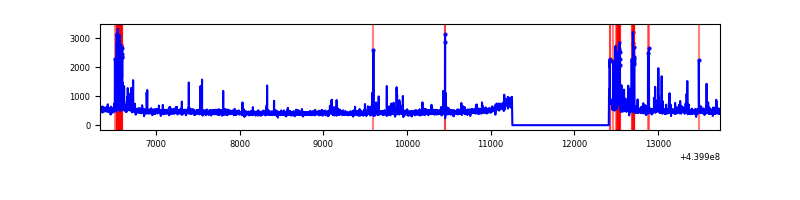 |
| D | 7411 | 6256 | 123 | 123 | 1.66% | 1.97% | 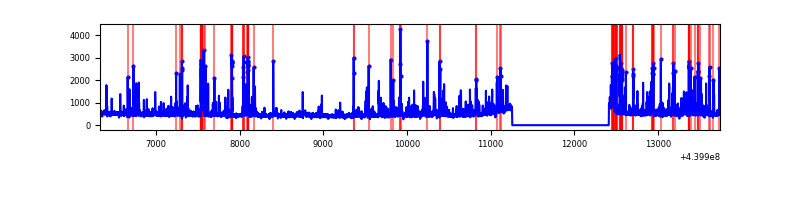 |
Top three noisy pixels from each quadrant. If the there are fewer than three noisy pixels in the level2.evt file, extra rows are filled as -1
| Pixel properties | Quadrant properties | ||||||
|---|---|---|---|---|---|---|---|
| Quadrant | DetID | PixID | Counts | Sigma | Mean | Median | Sigma |
| A | 10 | 83 | 1555651 | 9904.37 | 756 | 739 | 157.0 |
| A | 13 | 248 | 369558 | 2349.28 | 756 | 739 | 157.0 |
| A | 0 | 243 | 18758 | 114.78 | 756 | 739 | 157.0 |
| B | 7 | 221 | 87819 | 604.81 | 745 | 722 | 144.0 |
| B | 0 | 190 | 51352 | 351.58 | 745 | 722 | 144.0 |
| B | 0 | 219 | 49253 | 337.0 | 745 | 722 | 144.0 |
| C | 14 | 96 | 159599 | 930.58 | 729 | 732 | 170.7 |
| C | 1 | 3 | 117744 | 685.41 | 729 | 732 | 170.7 |
| C | 14 | 254 | 101289 | 589.02 | 729 | 732 | 170.7 |
| D | 13 | 249 | 241710 | 1322.15 | 735 | 713 | 182.3 |
| D | 13 | 171 | 108227 | 589.84 | 735 | 713 | 182.3 |
| D | 5 | 171 | 94150 | 512.61 | 735 | 713 | 182.3 |
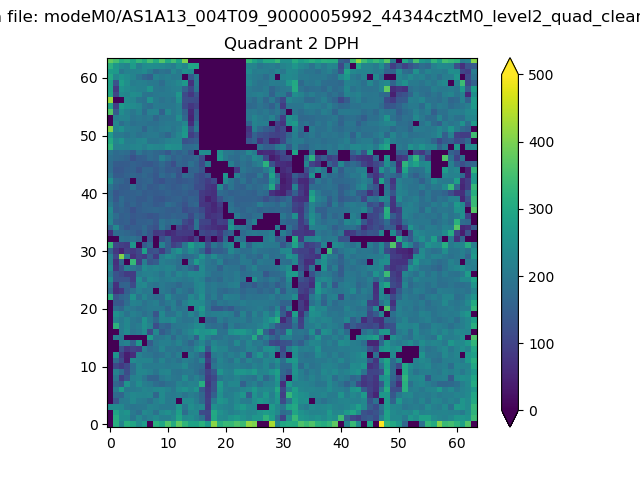
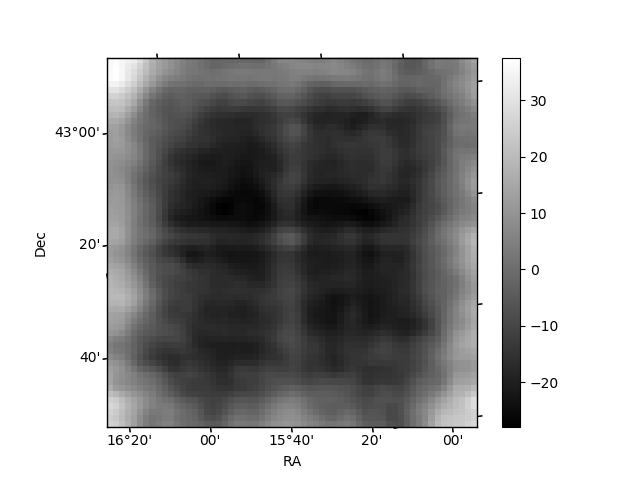
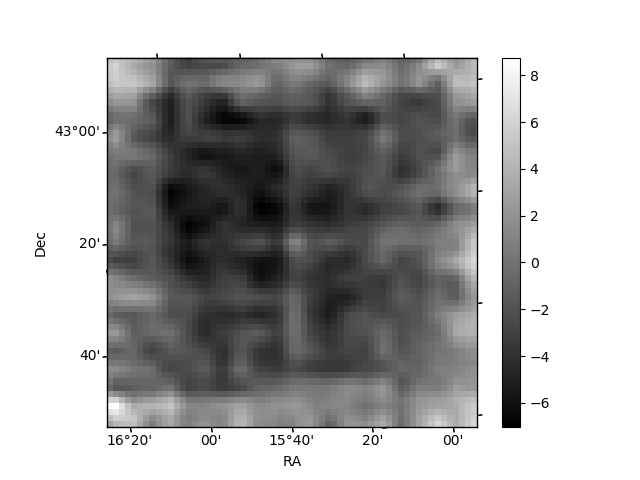
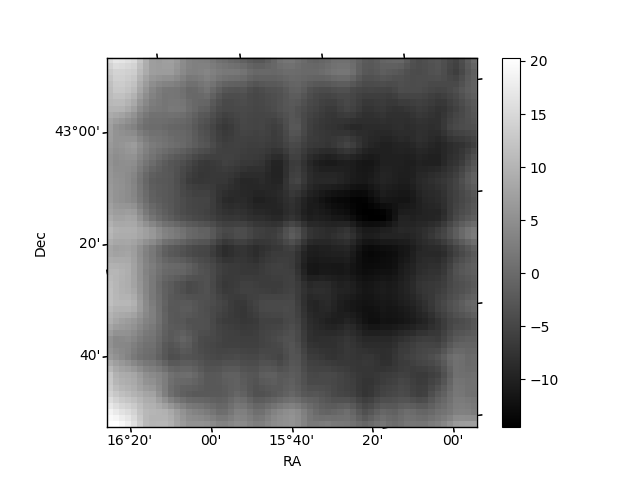
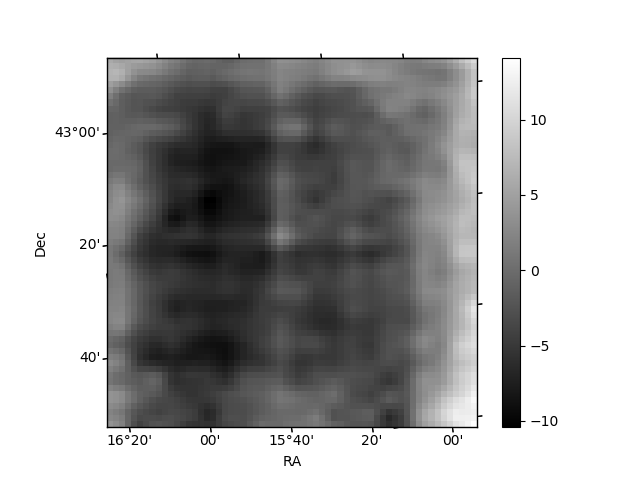
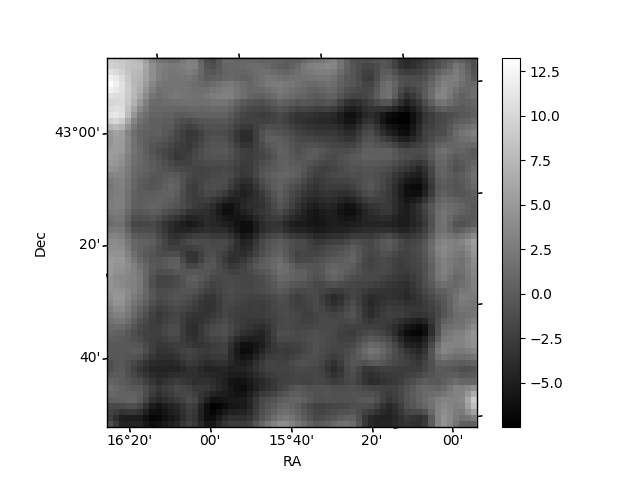
Histogram calculated using DETX and DETY for each event in the final _common_clean file
| Quadrant A | 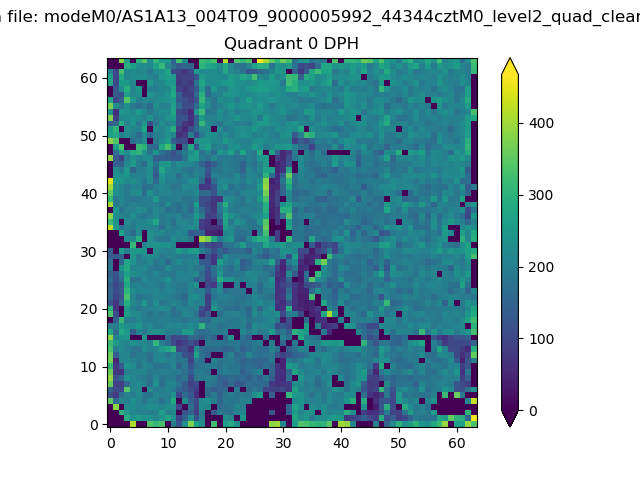 |
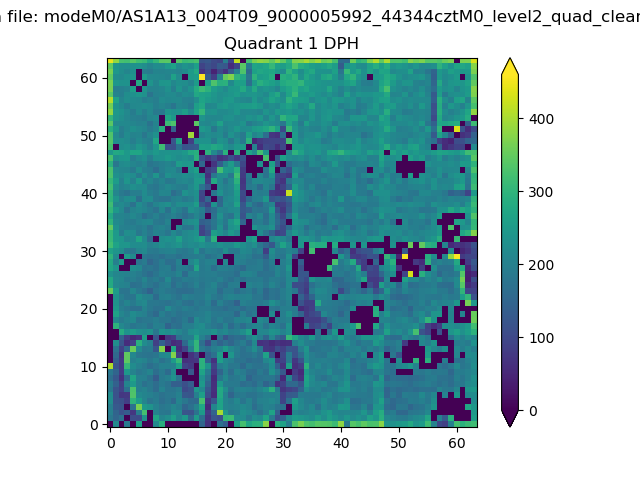 |
Quadrant B |
|---|---|---|---|
| Quadrant D | 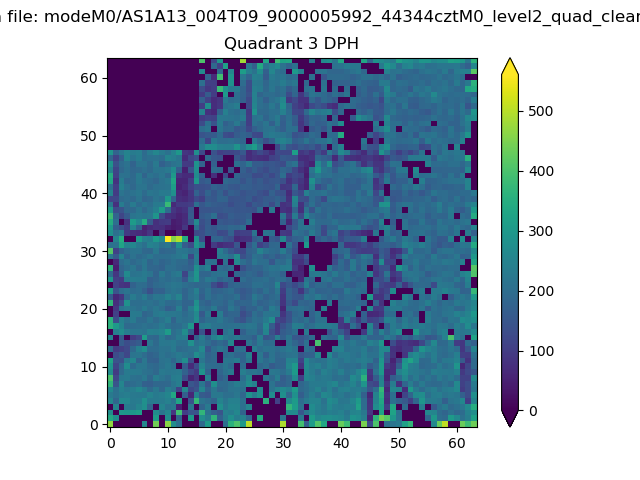 |
 |
Quadrant C |
| Plot type | Count rate plots | Images |
|---|---|---|
| Comparison with Poisson distribution Blue bars denote a histogram of data divided into 1 sec bins. Red curve is a Poisson curve with rate = median count rate of data. |
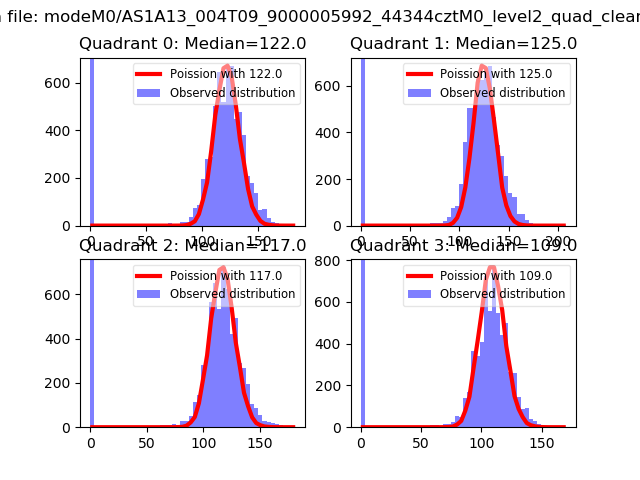 |
 |
| Quadrant-wise count rates Data is divided into 100 sec bins |
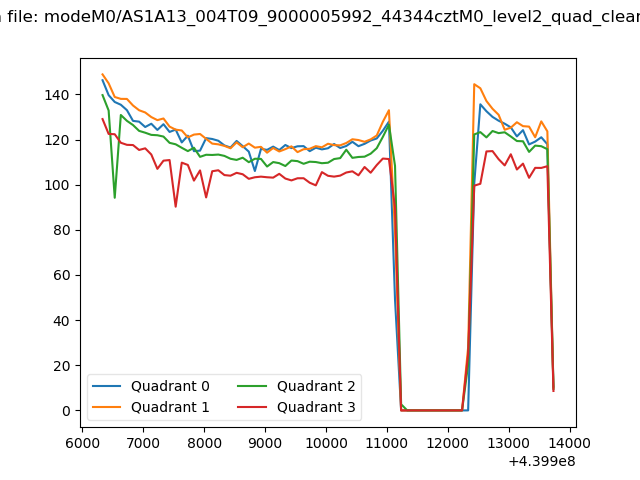 |
|
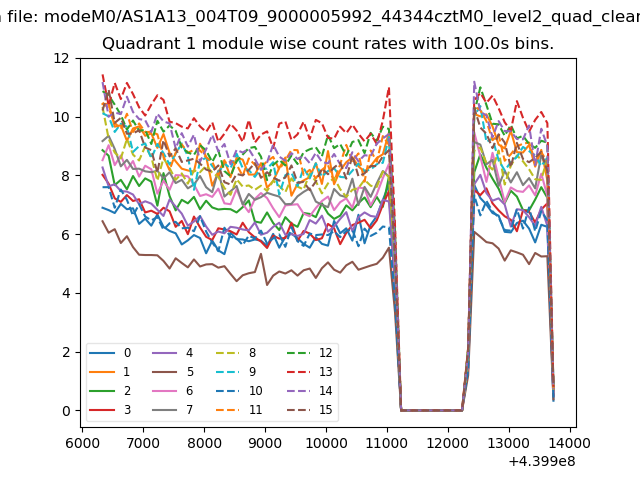
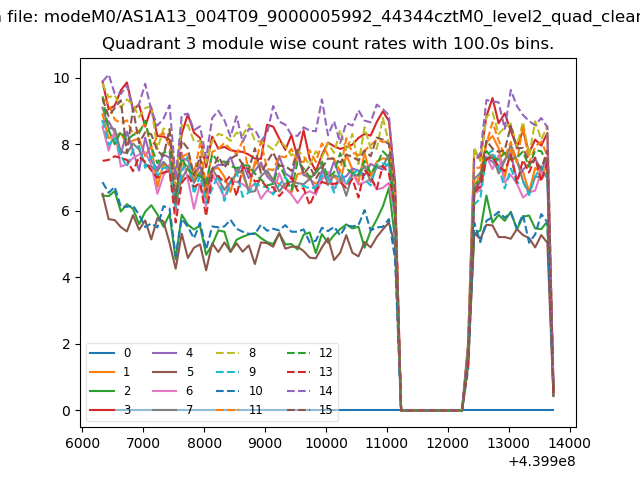
| Module-wise count rates for Quadrant A Data is divided into 100 sec bins |
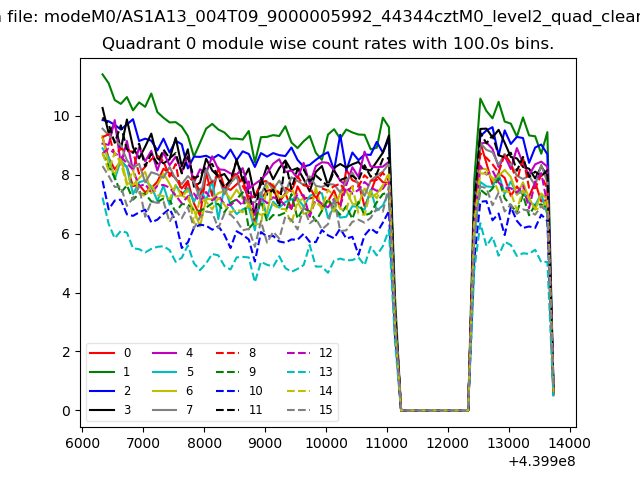 |
 |
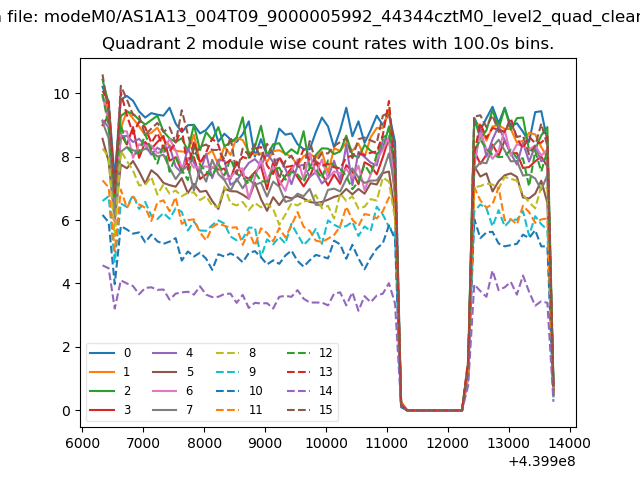
| Module-wise count rates for Quadrant B Data is divided into 100 sec bins |
 |
 |
| Module-wise count rates for Quadrant C Data is divided into 100 sec bins |
 |
 |
| Module-wise count rates for Quadrant D Data is divided into 100 sec bins |
 |
 |
| Parameter | Plot |
|---|---|
| CZT HV Monitor | 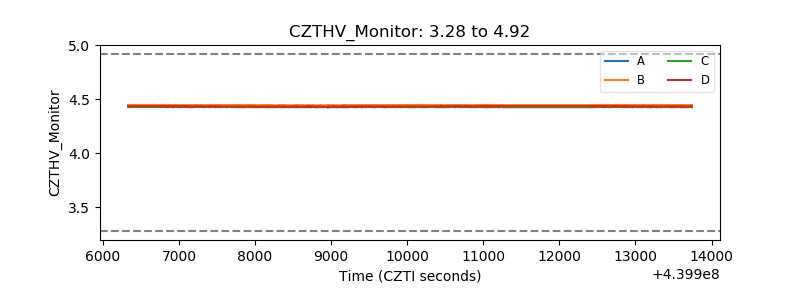 |
| D_VDD | 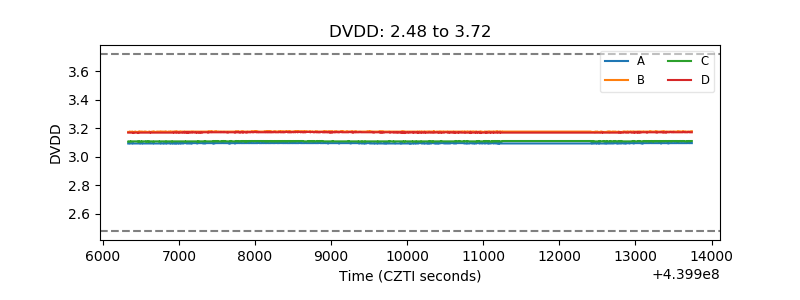 |
| Temperature 1 | 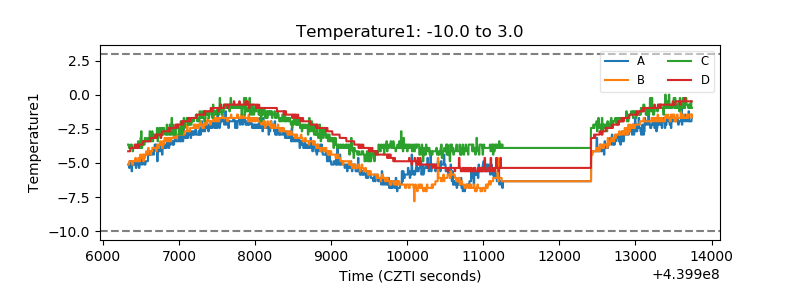 |
| Veto HV Monitor | 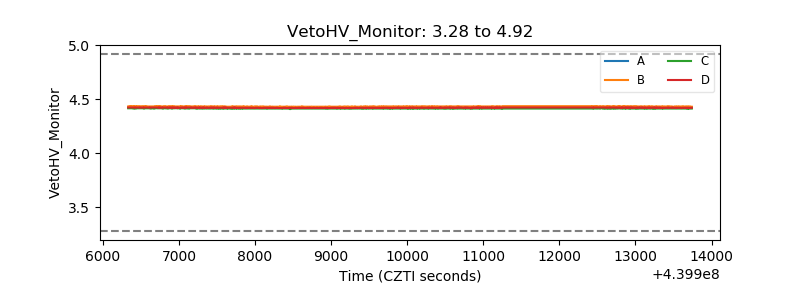 |
| Veto LLD | 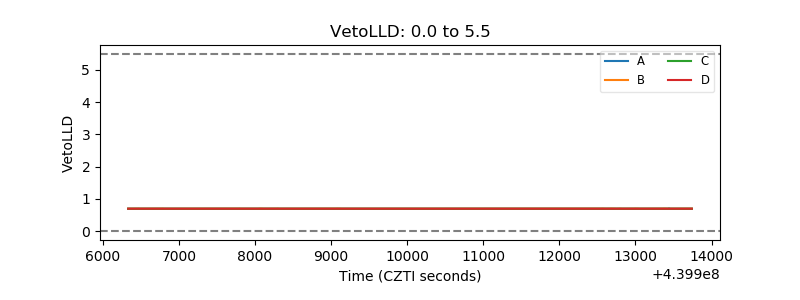 |
| Alpha Counter | 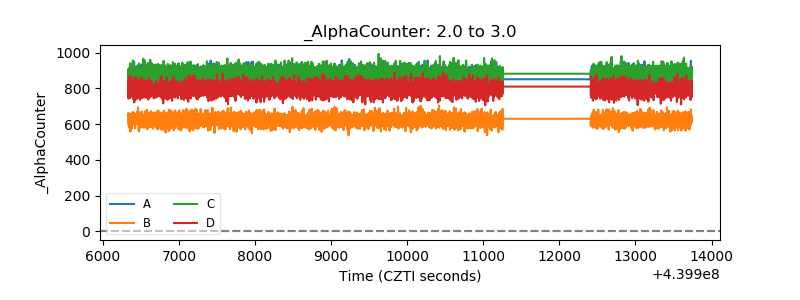 |
| _CPM_Rate | 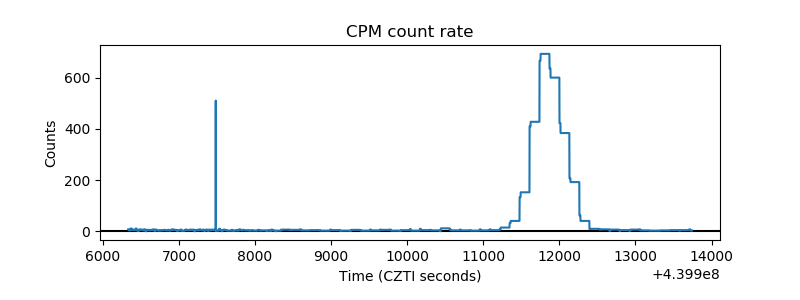 |
| CZT Counter | 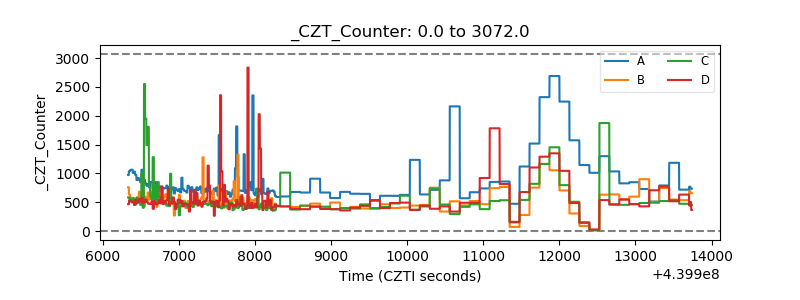 |
| +2.5 Volts monitor | 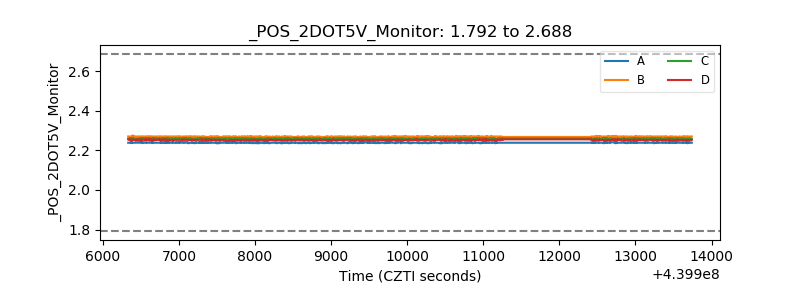 |
| +5 Volts monitor | 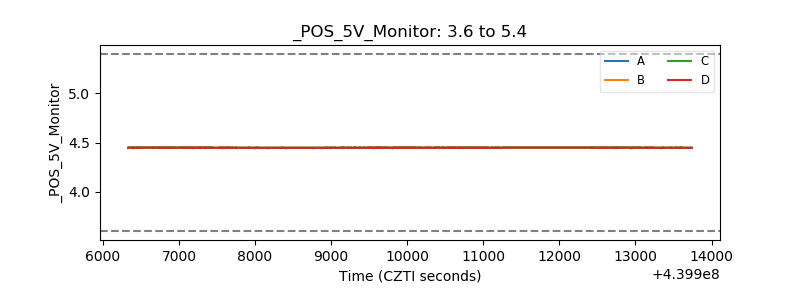 |
| _ROLL_ROT | 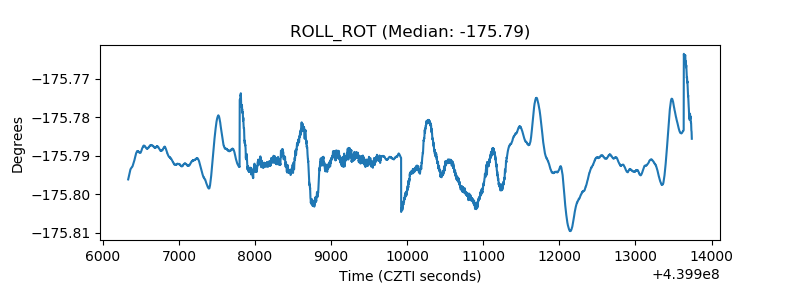 |
| _Roll_DEC | 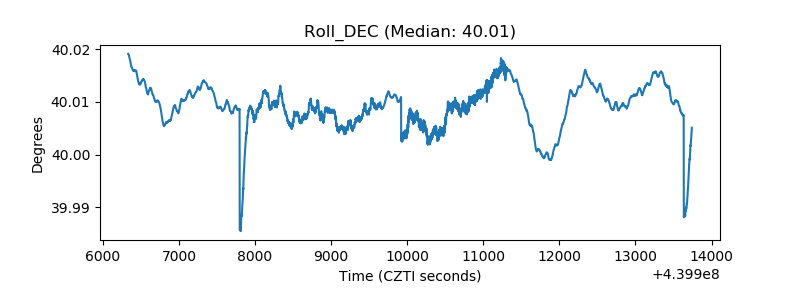 |
| _Roll_RA | 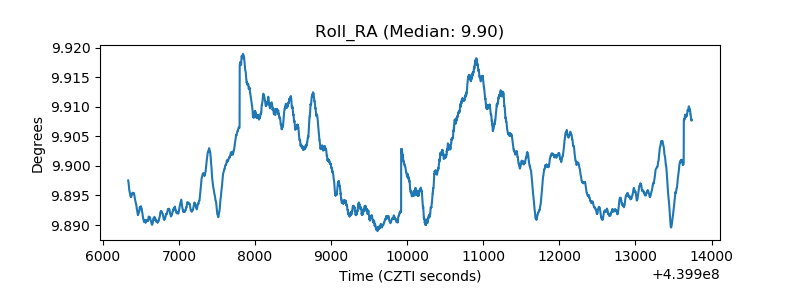 |
| Veto Counter | 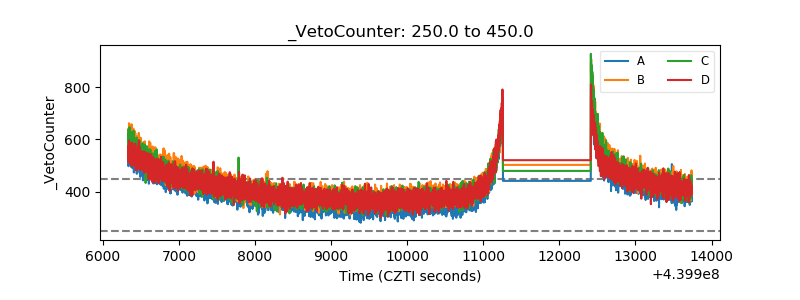 |