| Param | Original file | Final file |
|---|---|---|
| Filename | modeM0/AS1A13_004T09_9000005992_44506cztM0_level2.fits | modeM0/AS1A13_004T09_9000005992_44506cztM0_level2_quad_clean.evt |
| Size (bytes) | 16,626,240 | 4,199,040 |
| Size | 15.9 MB | 4.0 MB |
| Events in quadrant A | 198,931 | 26,161 |
| Events in quadrant B | 126,528 | 27,347 |
| Events in quadrant C | 126,832 | 24,351 |
| Events in quadrant D | 138,197 | 22,203 |
| Mode SS | |||
|---|---|---|---|
| Quadrant | BADHDUFLAG | Total packets | Discarded packets |
| A | 0 | 6 | 0 |
| B | 0 | 6 | 0 |
| C | 0 | 6 | 0 |
| D | 0 | 6 | 0 |
| Mode M0 | |||
|---|---|---|---|
| Quadrant | BADHDUFLAG | Total packets | Discarded packets |
| A | 0 | 829 | 0 |
| B | 0 | 558 | 0 |
| C | 0 | 559 | 0 |
| D | 0 | 581 | 0 |
| Quadrant | Total seconds | Saturated seconds | Saturation percentage |
|---|---|---|---|
| A | 272 | 2 | 0.735294% |
| B | 271 | 1 | 0.369004% |
| C | 271 | 0 | 0.000000% |
| D | 271 | 0 | 0.000000% |
Noise dominated data is calculated using 1-second bins in cleaned event files. If a bin has >2000 counts, and if more than 50% of those come from <1% of pixels, then it is considered to be noise-dominated and hence unusable.
| Quadrant | # 1 sec bins | Bins with >0 counts | Bins with >2000 counts | High rate bins dominated by noise | Noise dominated (total time) | Noise dominated (detector-on time) | Marked lightcurve |
|---|---|---|---|---|---|---|---|
| A | 272 | 272 | 1 | 1 | 0.37% | 0.37% | 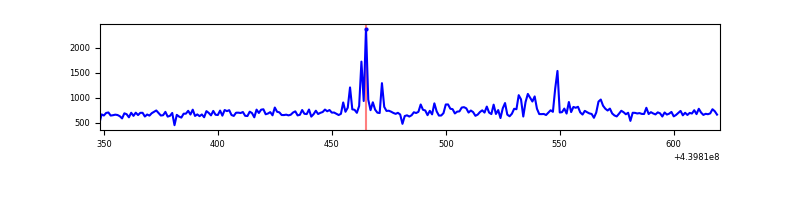 |
| B | 271 | 271 | 1 | 1 | 0.37% | 0.37% | 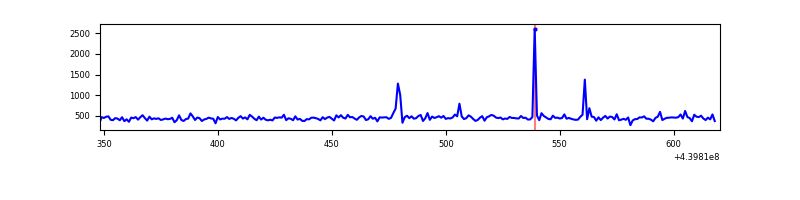 |
| C | 271 | 271 | 0 | 0 | 0.00% | 0.00% | 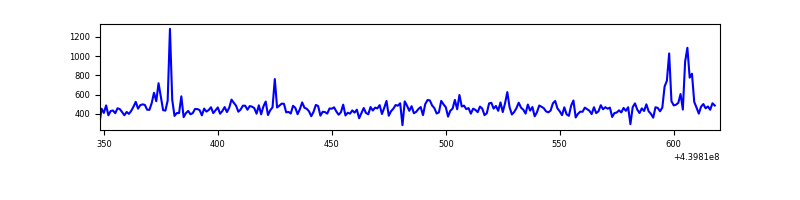 |
| D | 271 | 271 | 0 | 0 | 0.00% | 0.00% | 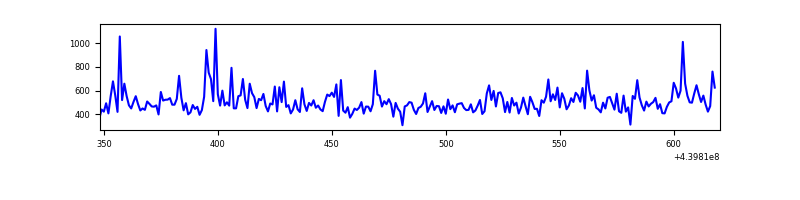 |
Top three noisy pixels from each quadrant. If the there are fewer than three noisy pixels in the level2.evt file, extra rows are filled as -1
| Pixel properties | Quadrant properties | ||||||
|---|---|---|---|---|---|---|---|
| Quadrant | DetID | PixID | Counts | Sigma | Mean | Median | Sigma |
| A | 10 | 83 | 66623 | 7880.81 | 30 | 29 | 8.5 |
| A | 13 | 248 | 13937 | 1645.89 | 30 | 29 | 8.5 |
| A | 0 | 243 | 593 | 66.74 | 30 | 29 | 8.5 |
| B | 5 | 172 | 5502 | 680.62 | 30 | 29 | 8.0 |
| B | 0 | 186 | 1855 | 227.08 | 30 | 29 | 8.0 |
| B | 5 | 235 | 1015 | 122.62 | 30 | 29 | 8.0 |
| C | 3 | 233 | 7649 | 858.87 | 29 | 29 | 8.9 |
| C | 14 | 254 | 3070 | 342.76 | 29 | 29 | 8.9 |
| C | 13 | 61 | 203 | 19.61 | 29 | 29 | 8.9 |
| D | 2 | 249 | 7419 | 785.03 | 30 | 28 | 9.4 |
| D | 5 | 222 | 5706 | 603.09 | 30 | 28 | 9.4 |
| D | 1 | 52 | 4851 | 512.27 | 30 | 28 | 9.4 |
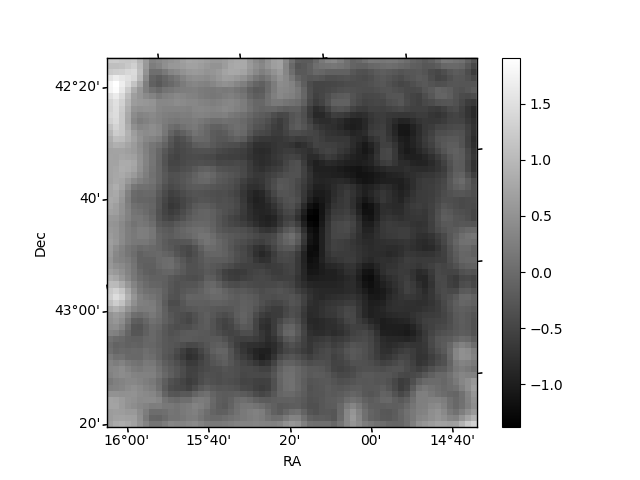
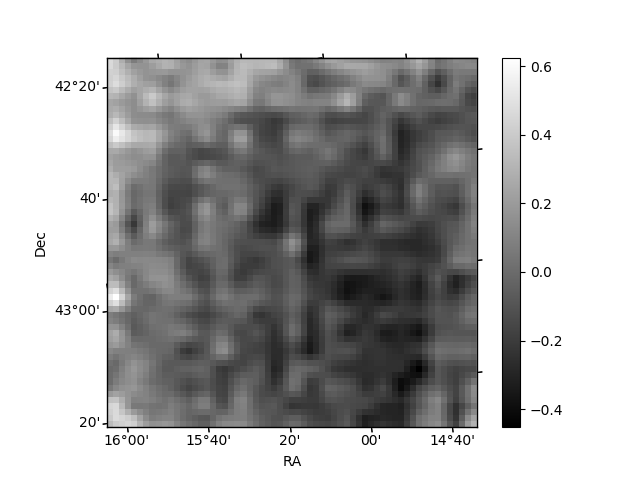
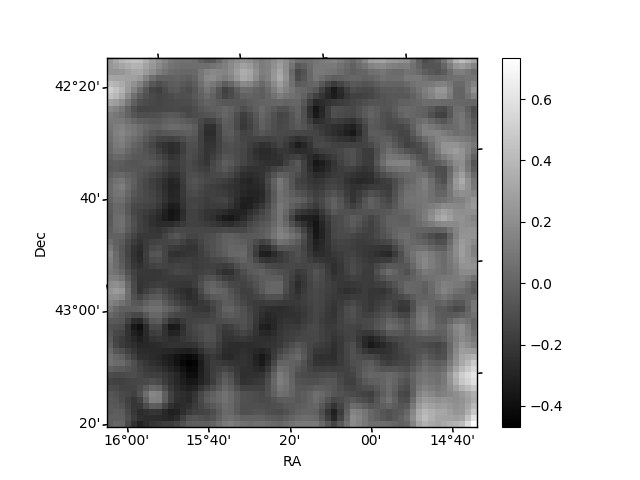
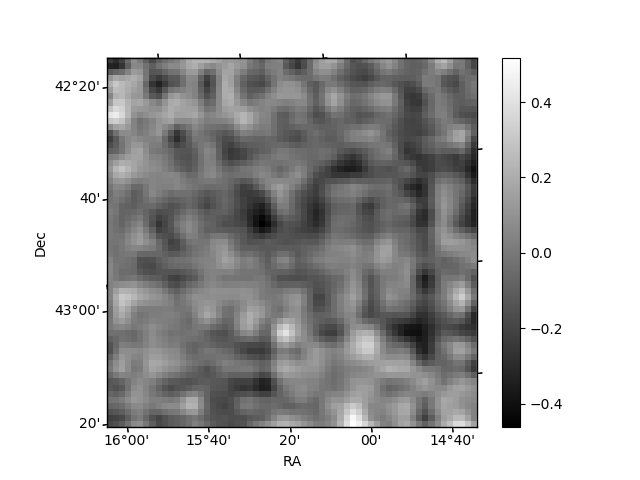
Histogram calculated using DETX and DETY for each event in the final _common_clean file
| Quadrant A | 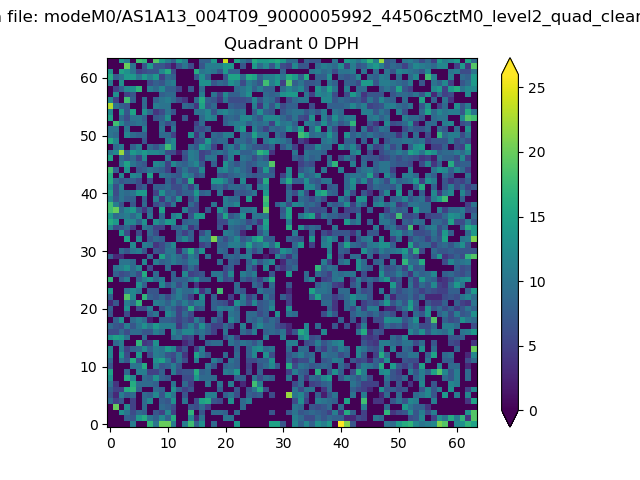 |
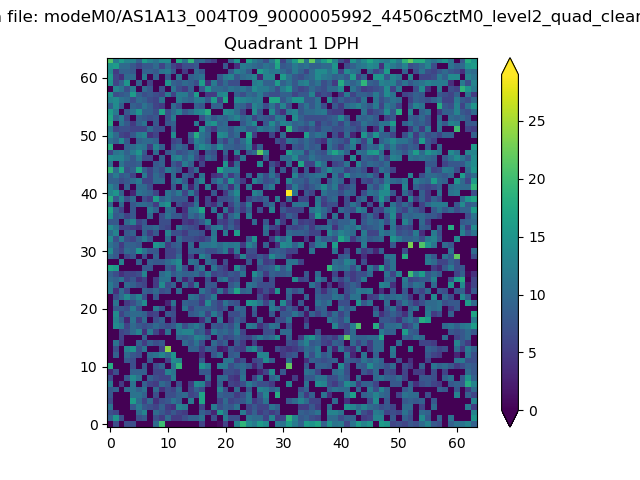 |
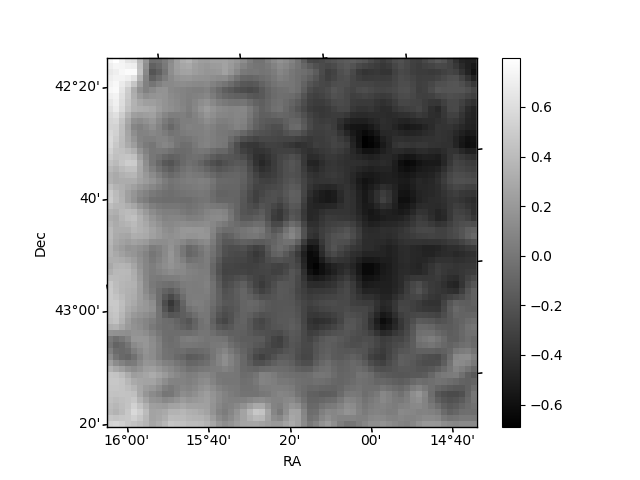
Quadrant B |
|---|---|---|---|
| Quadrant D | 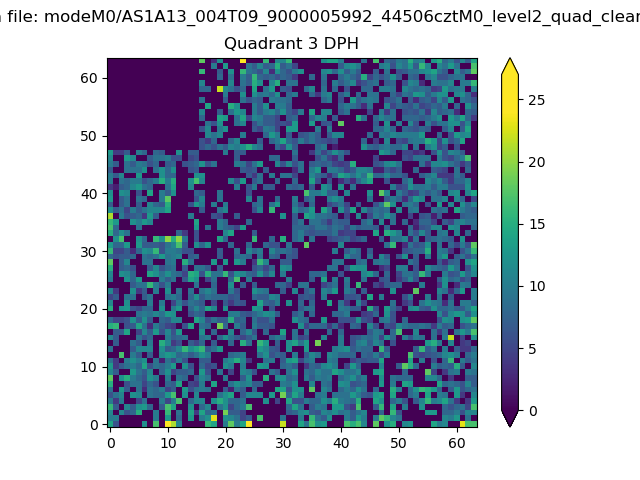 |
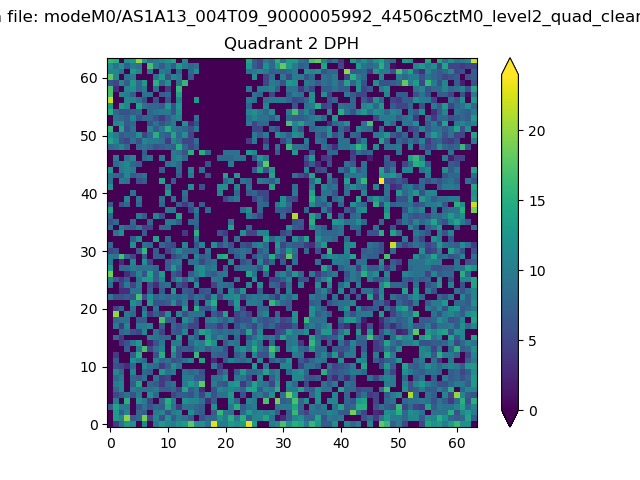 |
Quadrant C |
| Plot type | Count rate plots | Images |
|---|---|---|
| Comparison with Poisson distribution Blue bars denote a histogram of data divided into 1 sec bins. Red curve is a Poisson curve with rate = median count rate of data. |
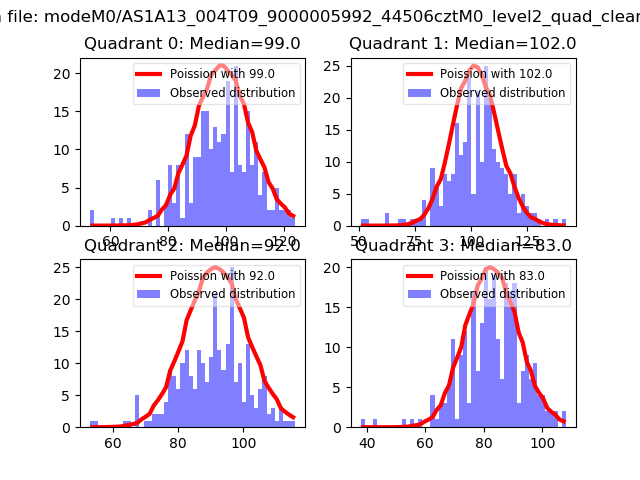 |
 |
| Quadrant-wise count rates Data is divided into 100 sec bins |
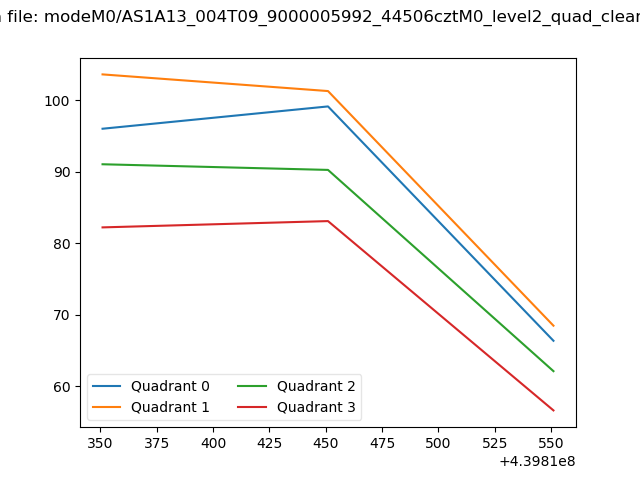 |
|
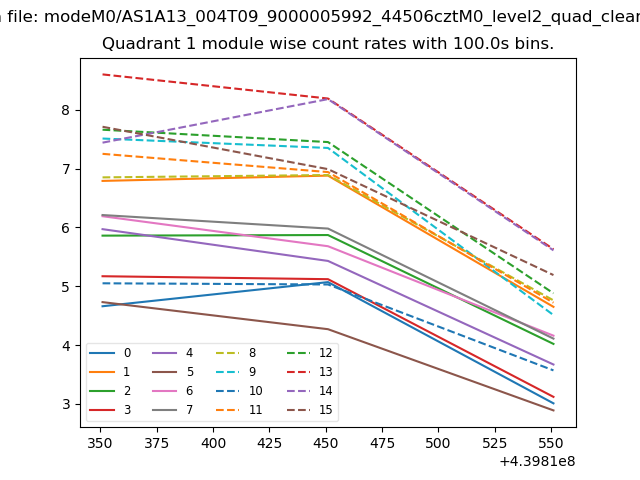
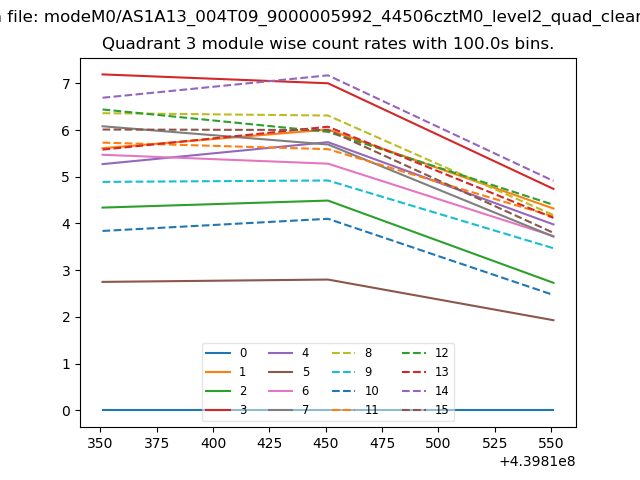
| Module-wise count rates for Quadrant A Data is divided into 100 sec bins |
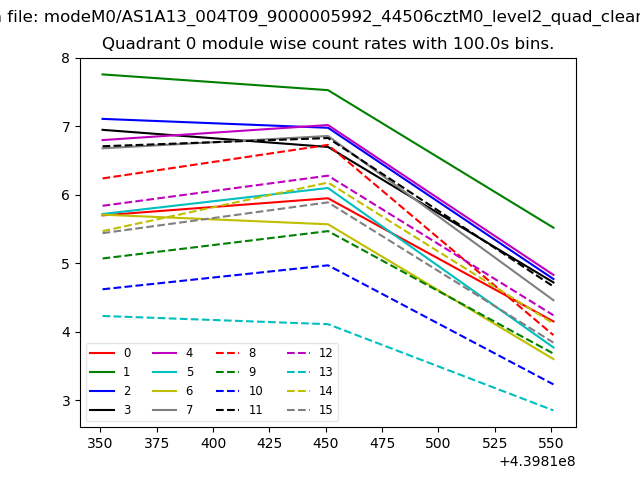 |
 |
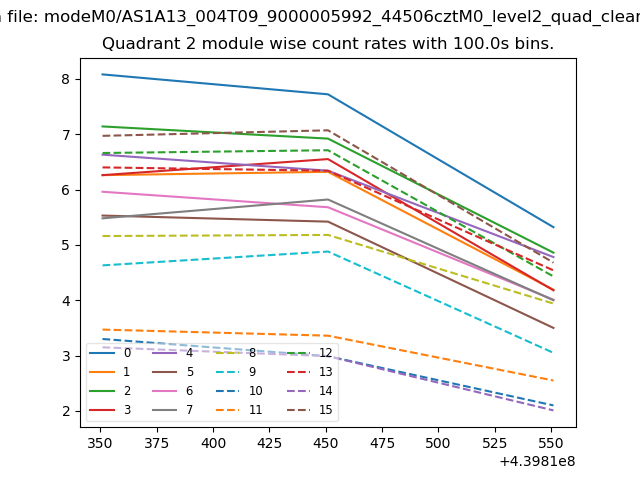
| Module-wise count rates for Quadrant B Data is divided into 100 sec bins |
 |
 |
| Module-wise count rates for Quadrant C Data is divided into 100 sec bins |
 |
 |
| Module-wise count rates for Quadrant D Data is divided into 100 sec bins |
 |
 |
| Parameter | Plot |
|---|---|
| CZT HV Monitor | 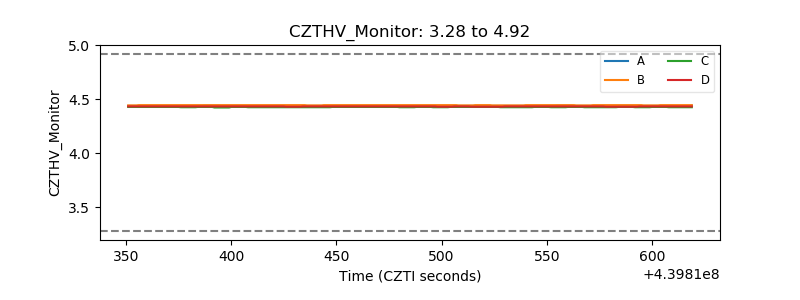 |
| D_VDD | 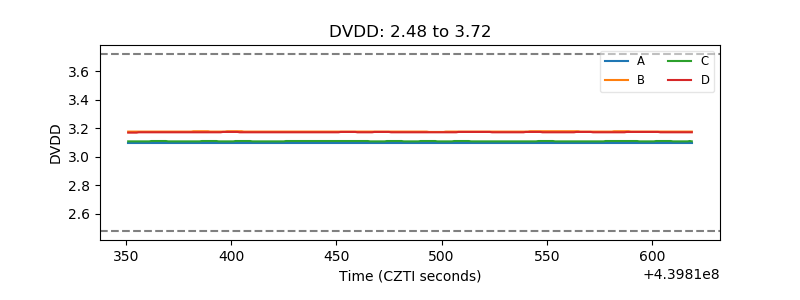 |
| Temperature 1 | 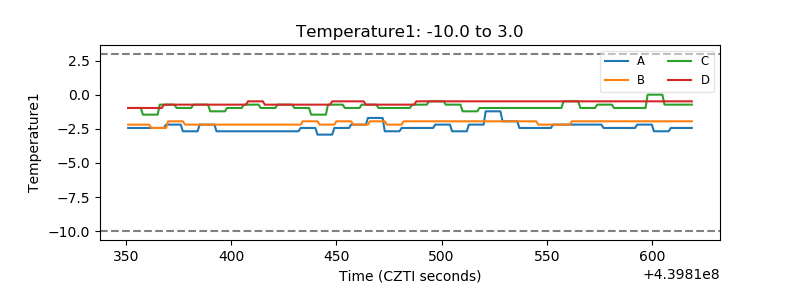 |
| Veto HV Monitor | 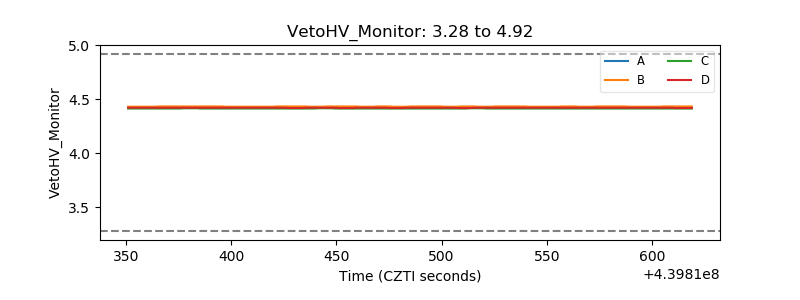 |
| Veto LLD | 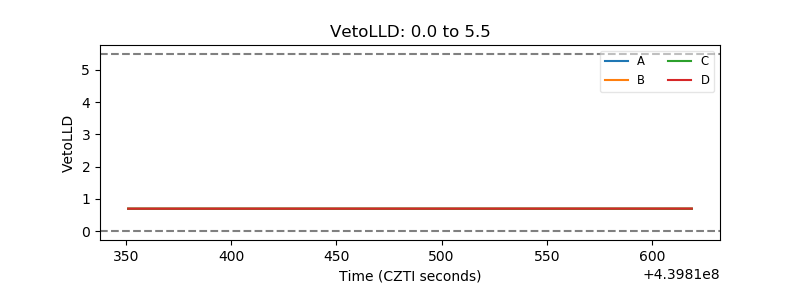 |
| Alpha Counter | 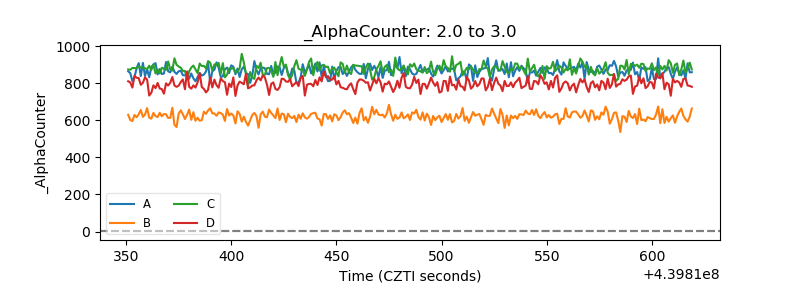 |
| _CPM_Rate | 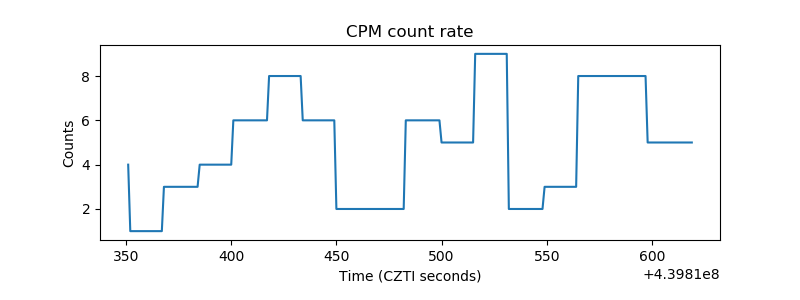 |
| CZT Counter | 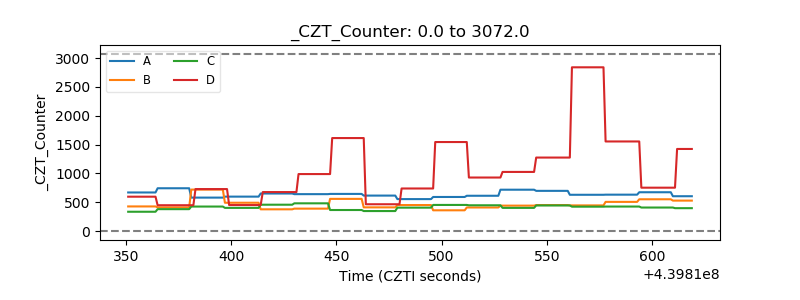 |
| +2.5 Volts monitor |  |
| +5 Volts monitor | 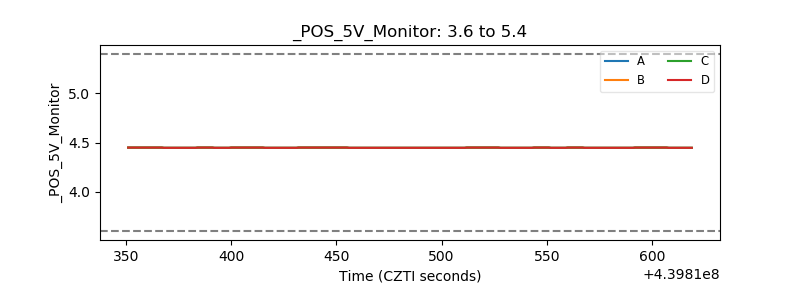 |
| _ROLL_ROT | 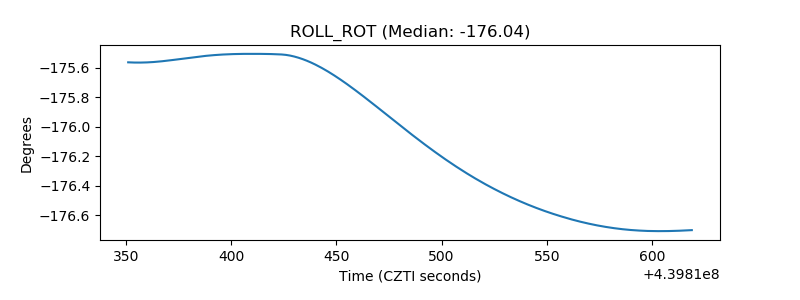 |
| _Roll_DEC | 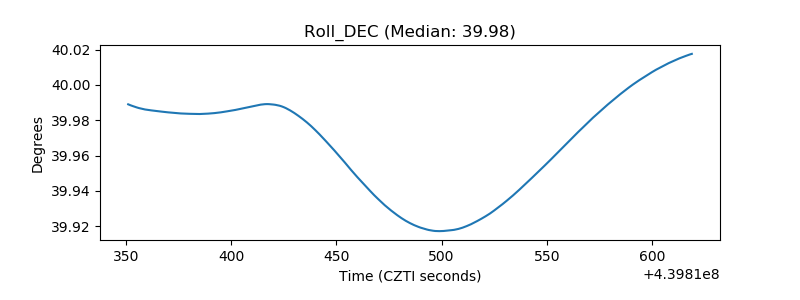 |
| _Roll_RA | 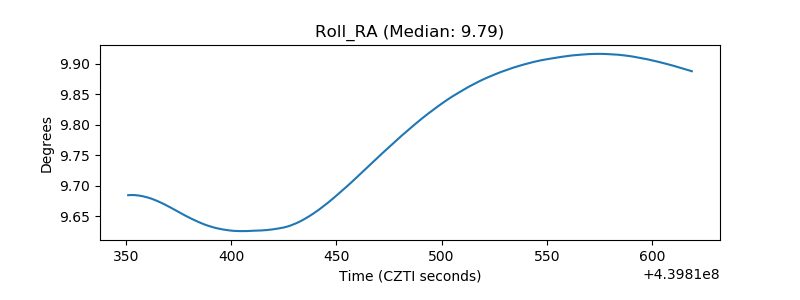 |
| Veto Counter | 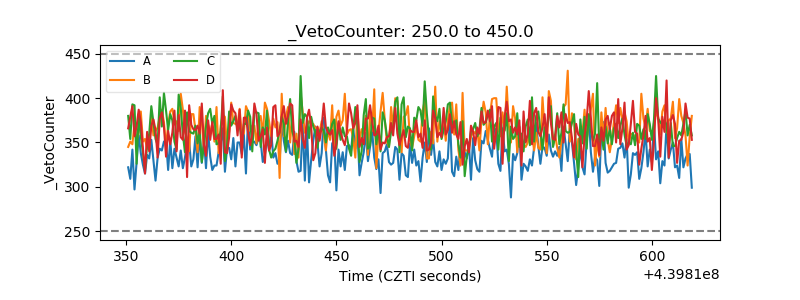 |