| Param | Original file | Final file |
|---|---|---|
| Filename | modeM0/AS1A13_008T06_9000005994_44345cztM0_level2.fits | modeM0/AS1A13_008T06_9000005994_44345cztM0_level2_quad_clean.evt |
| Size (bytes) | 261,938,880 | 59,699,520 |
| Size | 249.8 MB | 56.9 MB |
| Events in quadrant A | 3,219,789 | 374,916 |
| Events in quadrant B | 2,051,159 | 415,321 |
| Events in quadrant C | 1,774,808 | 405,893 |
| Events in quadrant D | 2,372,371 | 359,573 |
| Mode M9 | |||
|---|---|---|---|
| Quadrant | BADHDUFLAG | Total packets | Discarded packets |
| A | 0 | 10 | 0 |
| B | 0 | 10 | 0 |
| C | 0 | 10 | 0 |
| D | 0 | 10 | 0 |
| Mode SS | |||
|---|---|---|---|
| Quadrant | BADHDUFLAG | Total packets | Discarded packets |
| A | 0 | 74 | 0 |
| B | 0 | 74 | 0 |
| C | 0 | 74 | 0 |
| D | 0 | 74 | 0 |
| Mode M0 | |||
|---|---|---|---|
| Quadrant | BADHDUFLAG | Total packets | Discarded packets |
| A | 0 | 12407 | 1 |
| B | 0 | 8423 | 1 |
| C | 0 | 7686 | 1 |
| D | 0 | 9453 | 1 |
| Quadrant | Total seconds | Saturated seconds | Saturation percentage |
|---|---|---|---|
| A | 3557 | 421 | 11.835817% |
| B | 3557 | 143 | 4.020242% |
| C | 3557 | 40 | 1.124543% |
| D | 3557 | 213 | 5.988192% |
Noise dominated data is calculated using 1-second bins in cleaned event files. If a bin has >2000 counts, and if more than 50% of those come from <1% of pixels, then it is considered to be noise-dominated and hence unusable.
| Quadrant | # 1 sec bins | Bins with >0 counts | Bins with >2000 counts | High rate bins dominated by noise | Noise dominated (total time) | Noise dominated (detector-on time) | Marked lightcurve |
|---|---|---|---|---|---|---|---|
| A | 4607 | 3557 | 200 | 200 | 4.34% | 5.62% | 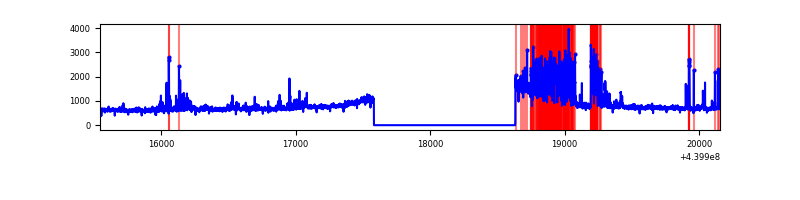 |
| B | 4607 | 3557 | 11 | 11 | 0.24% | 0.31% | 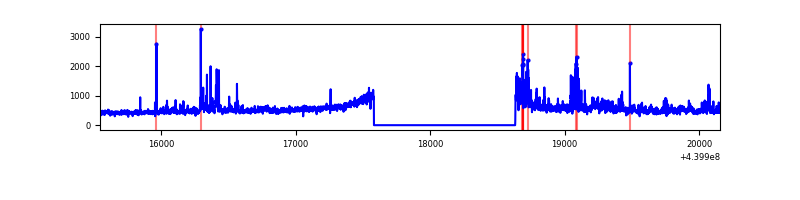 |
| C | 4607 | 3558 | 0 | 0 | 0.00% | 0.00% | 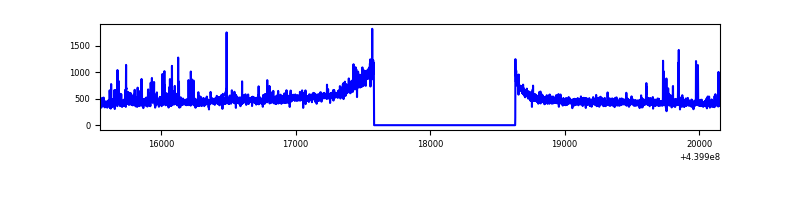 |
| D | 4607 | 3558 | 133 | 133 | 2.89% | 3.74% | 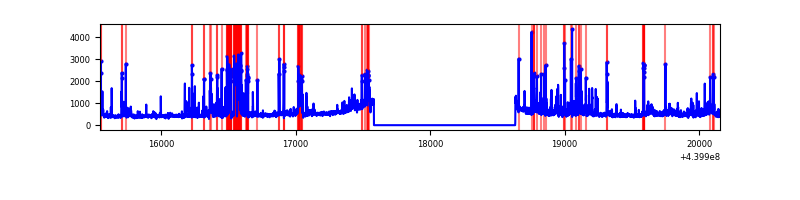 |
Top three noisy pixels from each quadrant. If the there are fewer than three noisy pixels in the level2.evt file, extra rows are filled as -1
| Pixel properties | Quadrant properties | ||||||
|---|---|---|---|---|---|---|---|
| Quadrant | DetID | PixID | Counts | Sigma | Mean | Median | Sigma |
| A | 10 | 83 | 933284 | 10277.06 | 428 | 419 | 90.8 |
| A | 13 | 248 | 603923 | 6648.6 | 428 | 419 | 90.8 |
| A | 0 | 243 | 11106 | 117.74 | 428 | 419 | 90.8 |
| B | 15 | 36 | 60860 | 673.09 | 441 | 428 | 89.8 |
| B | 0 | 229 | 40832 | 450.02 | 441 | 428 | 89.8 |
| B | 0 | 199 | 38602 | 425.18 | 441 | 428 | 89.8 |
| C | 14 | 96 | 43781 | 416.07 | 432 | 435 | 104.2 |
| C | 14 | 254 | 30652 | 290.05 | 432 | 435 | 104.2 |
| C | 3 | 233 | 7633 | 69.09 | 432 | 435 | 104.2 |
| D | 13 | 249 | 428972 | 3913.45 | 425 | 411 | 109.5 |
| D | 2 | 153 | 121752 | 1108.04 | 425 | 411 | 109.5 |
| D | 5 | 171 | 77141 | 700.67 | 425 | 411 | 109.5 |
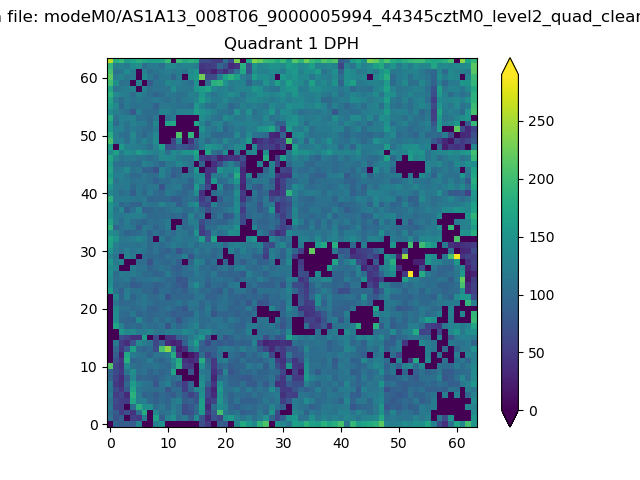
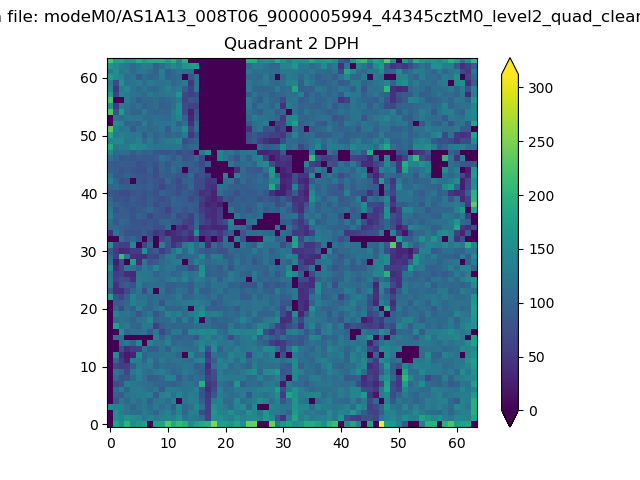
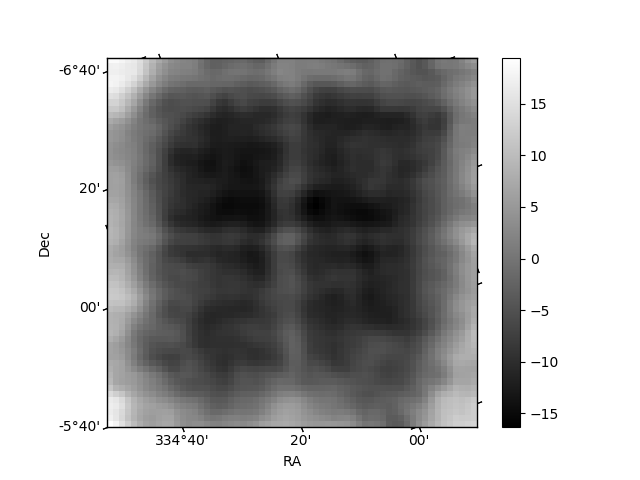
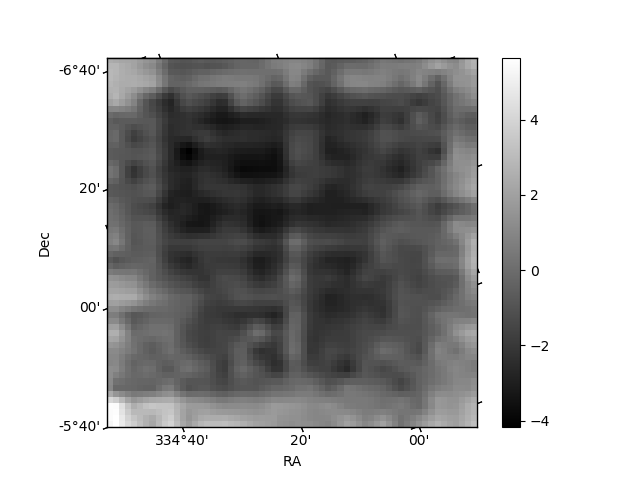
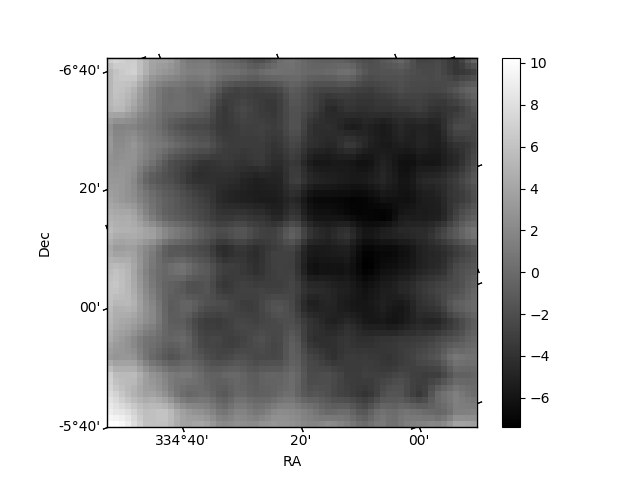
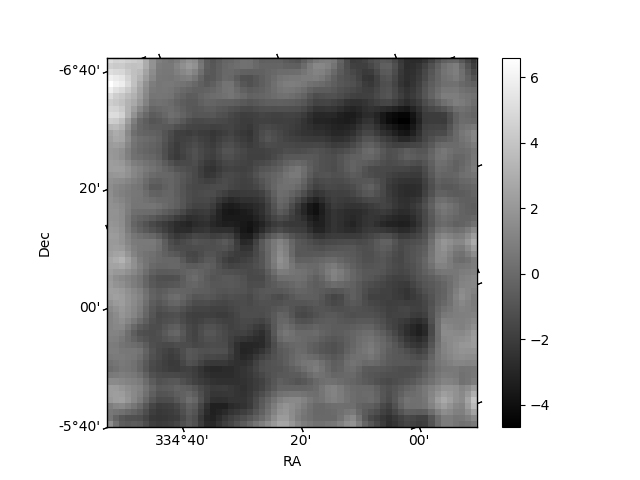
Histogram calculated using DETX and DETY for each event in the final _common_clean file
| Quadrant A |  |
 |
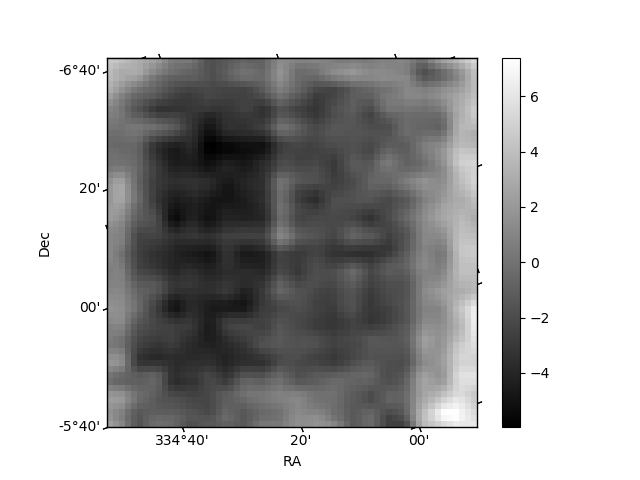
Quadrant B |
|---|---|---|---|
| Quadrant D | 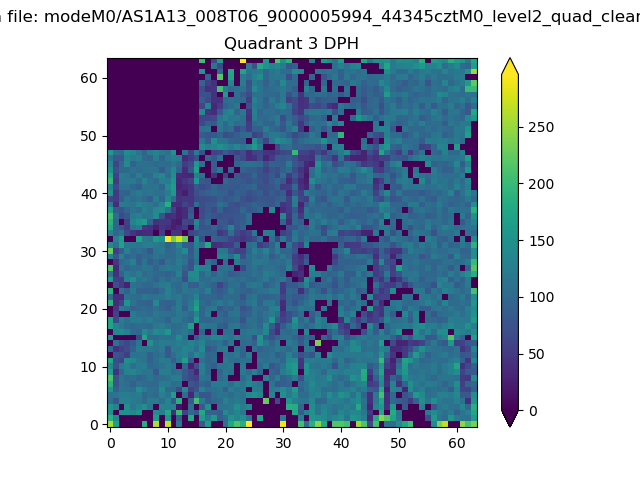 |
 |
Quadrant C |
| Plot type | Count rate plots | Images |
|---|---|---|
| Comparison with Poisson distribution Blue bars denote a histogram of data divided into 1 sec bins. Red curve is a Poisson curve with rate = median count rate of data. |
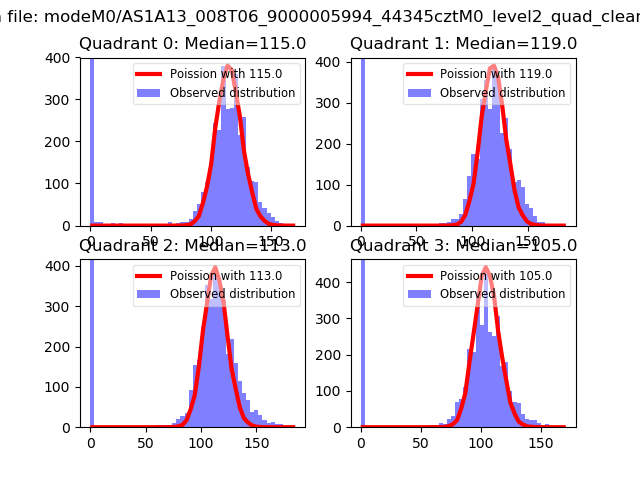 |
 |
| Quadrant-wise count rates Data is divided into 100 sec bins |
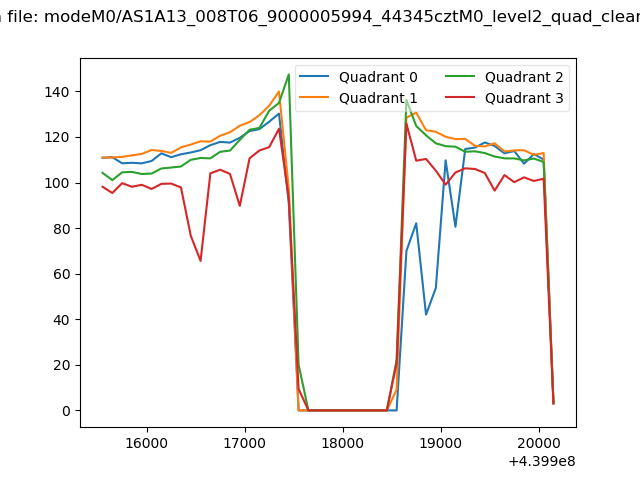 |
|
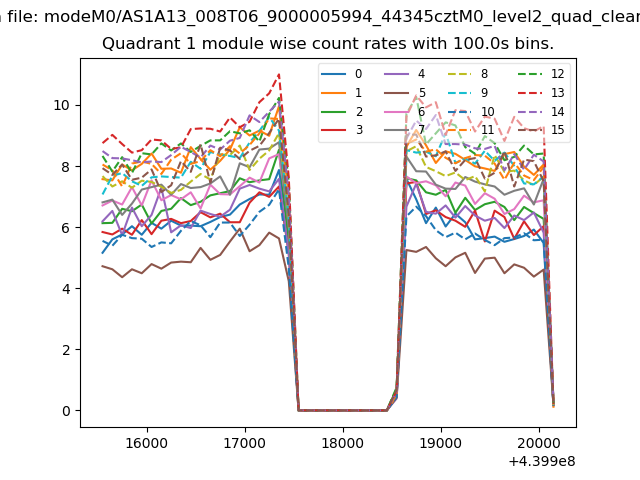
| Module-wise count rates for Quadrant A Data is divided into 100 sec bins |
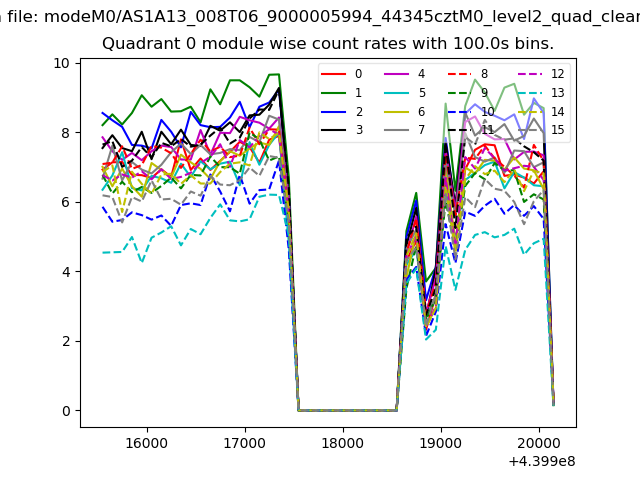 |
 |
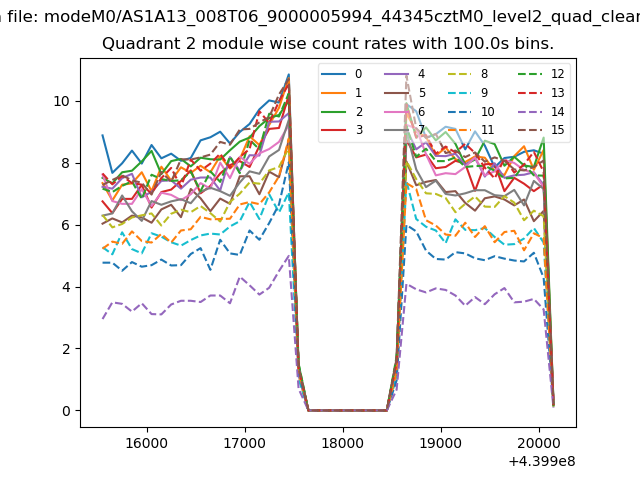
| Module-wise count rates for Quadrant B Data is divided into 100 sec bins |
 |
 |
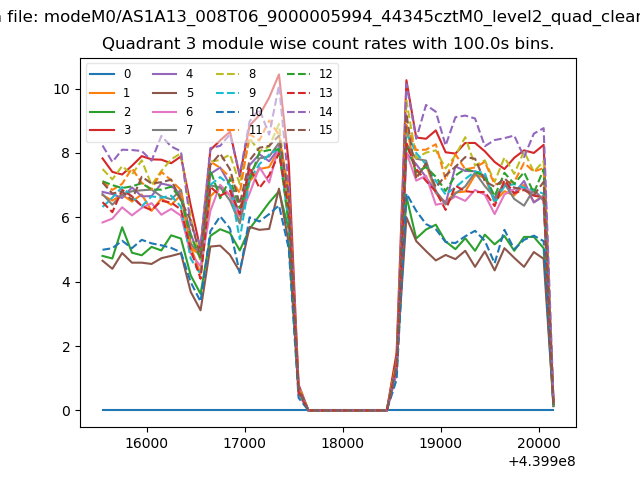
| Module-wise count rates for Quadrant C Data is divided into 100 sec bins |
 |
 |
| Module-wise count rates for Quadrant D Data is divided into 100 sec bins |
 |
 |
| Parameter | Plot |
|---|---|
| CZT HV Monitor | 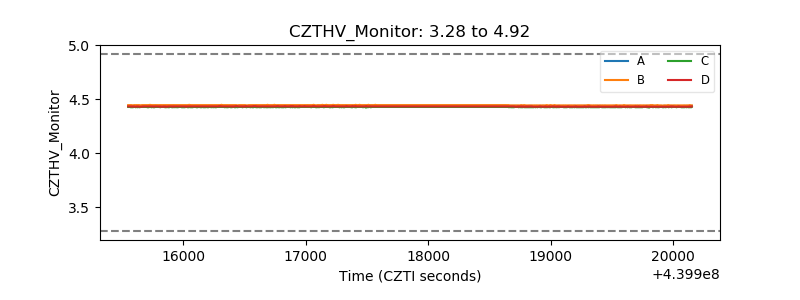 |
| D_VDD | 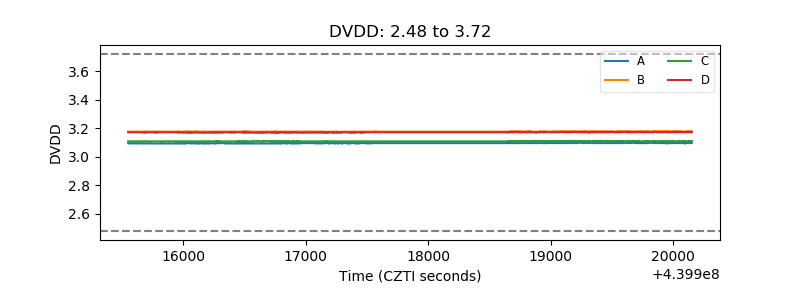 |
| Temperature 1 | 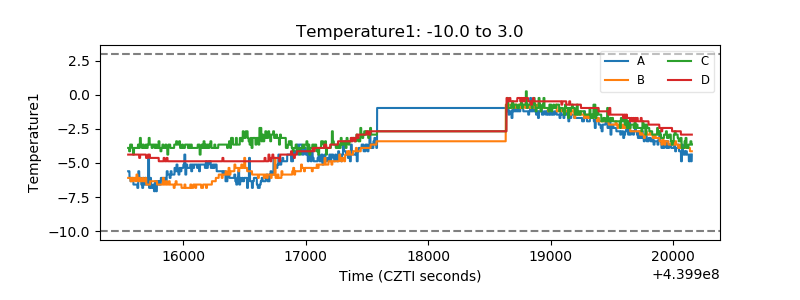 |
| Veto HV Monitor | 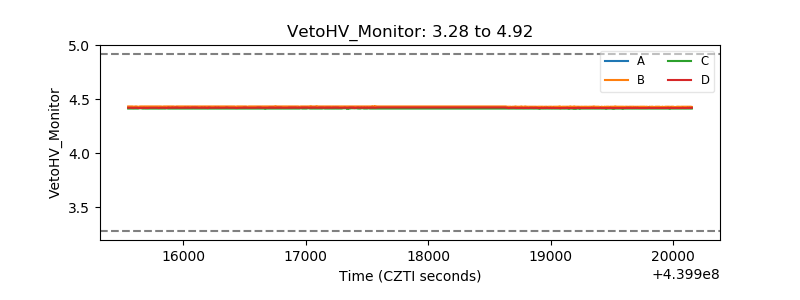 |
| Veto LLD | 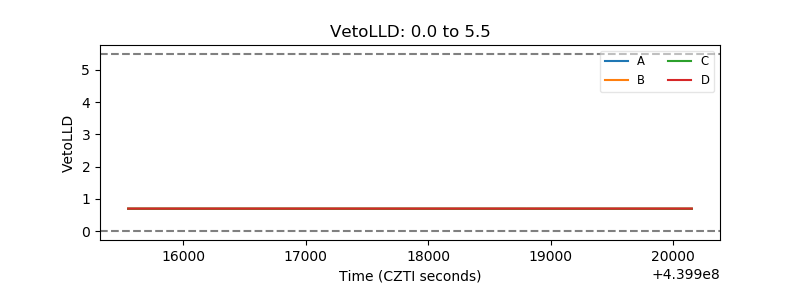 |
| Alpha Counter | 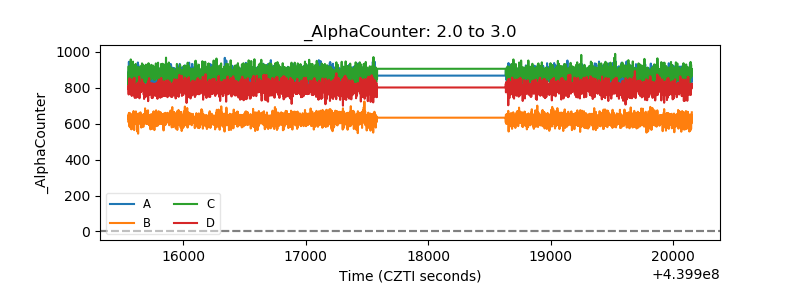 |
| _CPM_Rate |  |
| CZT Counter | 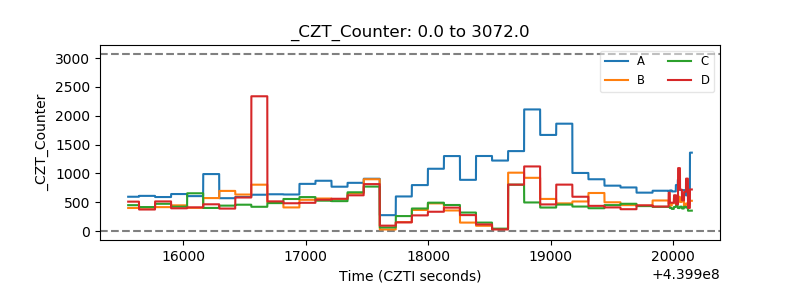 |
| +2.5 Volts monitor | 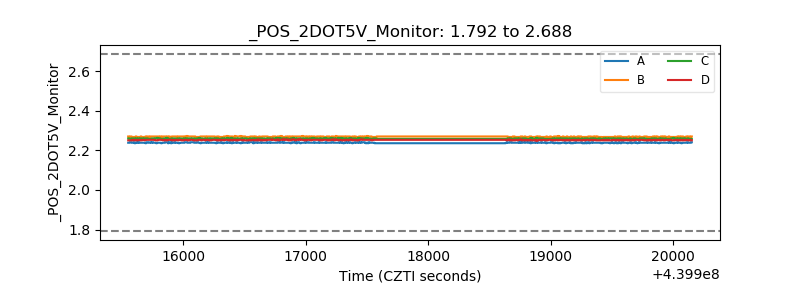 |
| +5 Volts monitor | 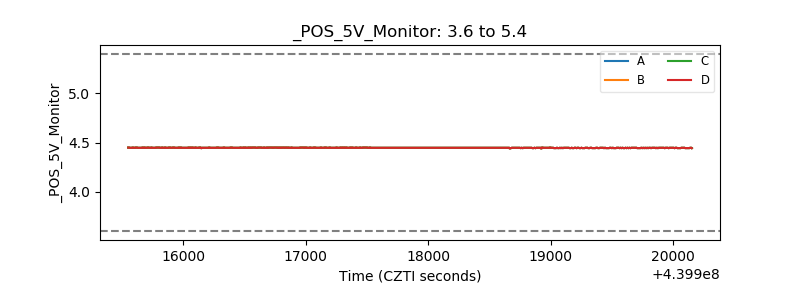 |
| _ROLL_ROT | 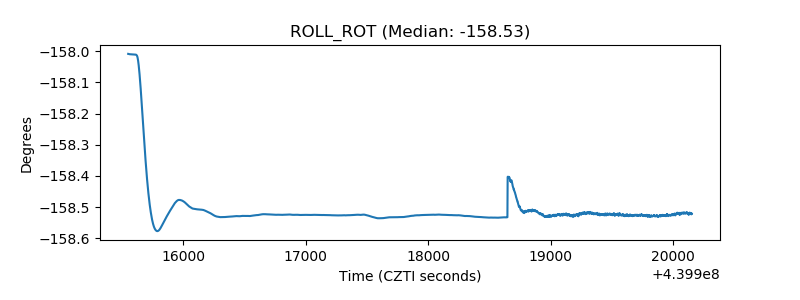 |
| _Roll_DEC | 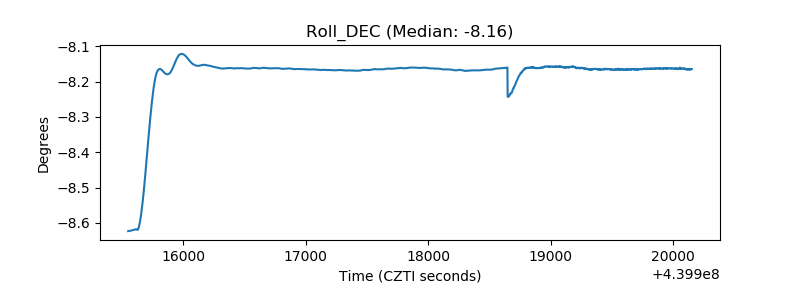 |
| _Roll_RA | 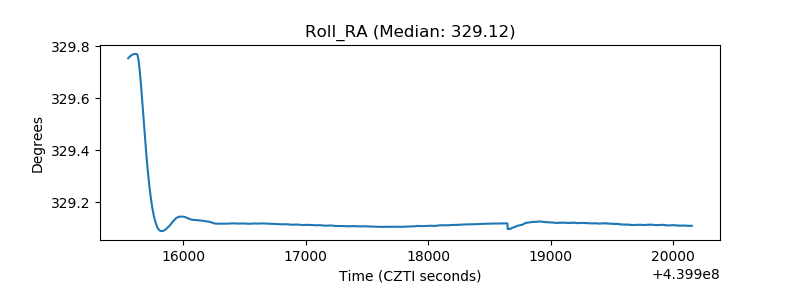 |
| Veto Counter | 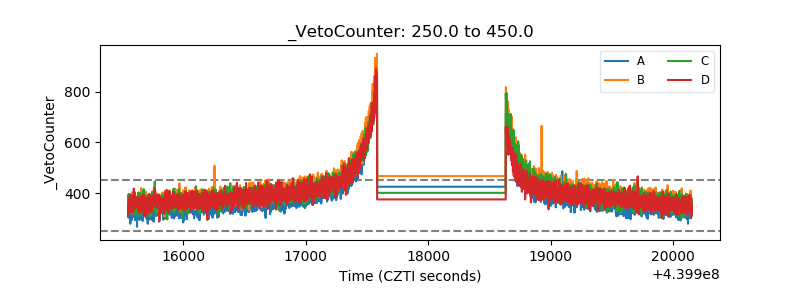 |