| Param | Original file | Final file |
|---|---|---|
| Filename | modeM0/AS1A13_008T06_9000005994_44346cztM0_level2.fits | modeM0/AS1A13_008T06_9000005994_44346cztM0_level2_quad_clean.evt |
| Size (bytes) | 461,615,040 | 101,692,800 |
| Size | 440.2 MB | 97.0 MB |
| Events in quadrant A | 4,764,769 | 685,049 |
| Events in quadrant B | 3,403,741 | 708,927 |
| Events in quadrant C | 3,242,410 | 672,431 |
| Events in quadrant D | 5,190,186 | 575,407 |
| Mode M9 | |||
|---|---|---|---|
| Quadrant | BADHDUFLAG | Total packets | Discarded packets |
| A | 0 | 8 | 0 |
| B | 0 | 8 | 0 |
| C | 0 | 8 | 0 |
| D | 0 | 8 | 0 |
| Mode SS | |||
|---|---|---|---|
| Quadrant | BADHDUFLAG | Total packets | Discarded packets |
| A | 0 | 128 | 0 |
| B | 0 | 128 | 0 |
| C | 0 | 128 | 0 |
| D | 0 | 128 | 0 |
| Mode M0 | |||
|---|---|---|---|
| Quadrant | BADHDUFLAG | Total packets | Discarded packets |
| A | 0 | 19236 | 1 |
| B | 0 | 14317 | 1 |
| C | 0 | 14191 | 1 |
| D | 0 | 19747 | 1 |
| Quadrant | Total seconds | Saturated seconds | Saturation percentage |
|---|---|---|---|
| A | 6261 | 197 | 3.146462% |
| B | 6261 | 97 | 1.549273% |
| C | 6262 | 137 | 2.187799% |
| D | 6262 | 637 | 10.172469% |
Noise dominated data is calculated using 1-second bins in cleaned event files. If a bin has >2000 counts, and if more than 50% of those come from <1% of pixels, then it is considered to be noise-dominated and hence unusable.
| Quadrant | # 1 sec bins | Bins with >0 counts | Bins with >2000 counts | High rate bins dominated by noise | Noise dominated (total time) | Noise dominated (detector-on time) | Marked lightcurve |
|---|---|---|---|---|---|---|---|
| A | 7111 | 6262 | 83 | 83 | 1.17% | 1.33% |  |
| B | 7111 | 6262 | 26 | 26 | 0.37% | 0.42% |  |
| C | 7112 | 6263 | 104 | 104 | 1.46% | 1.66% | 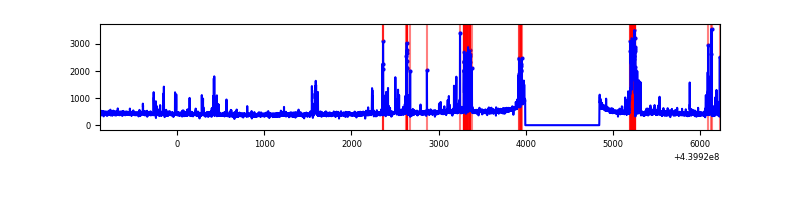 |
| D | 7112 | 6263 | 538 | 538 | 7.56% | 8.59% | 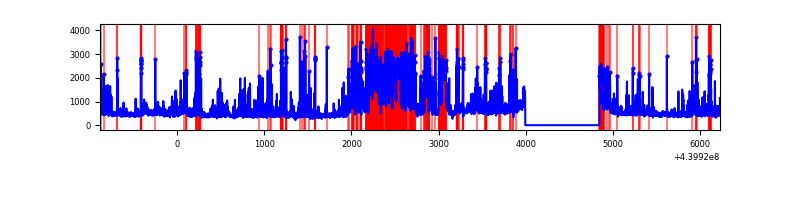 |
Top three noisy pixels from each quadrant. If the there are fewer than three noisy pixels in the level2.evt file, extra rows are filled as -1
| Pixel properties | Quadrant properties | ||||||
|---|---|---|---|---|---|---|---|
| Quadrant | DetID | PixID | Counts | Sigma | Mean | Median | Sigma |
| A | 10 | 83 | 1612261 | 10825.11 | 710 | 694 | 148.9 |
| A | 13 | 248 | 302708 | 2028.67 | 710 | 694 | 148.9 |
| A | 0 | 243 | 35810 | 235.88 | 710 | 694 | 148.9 |
| B | 0 | 219 | 118301 | 827.42 | 716 | 695 | 142.1 |
| B | 0 | 229 | 81425 | 567.98 | 716 | 695 | 142.1 |
| B | 4 | 173 | 76633 | 534.26 | 716 | 695 | 142.1 |
| C | 14 | 254 | 478085 | 2917.59 | 691 | 698 | 163.6 |
| C | 14 | 96 | 22940 | 135.93 | 691 | 698 | 163.6 |
| C | 1 | 3 | 12950 | 74.88 | 691 | 698 | 163.6 |
| D | 13 | 249 | 1004399 | 5935.04 | 666 | 647 | 169.1 |
| D | 1 | 52 | 631927 | 3732.67 | 666 | 647 | 169.1 |
| D | 5 | 222 | 364120 | 2149.16 | 666 | 647 | 169.1 |
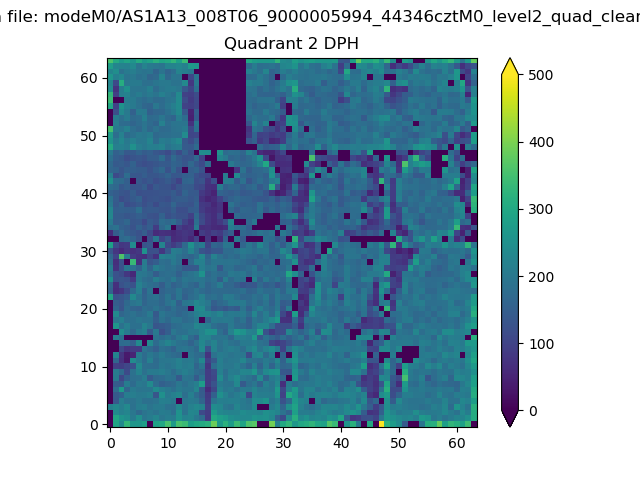
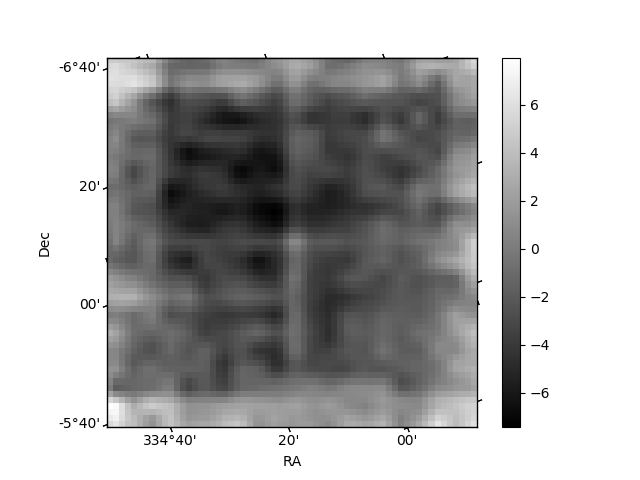
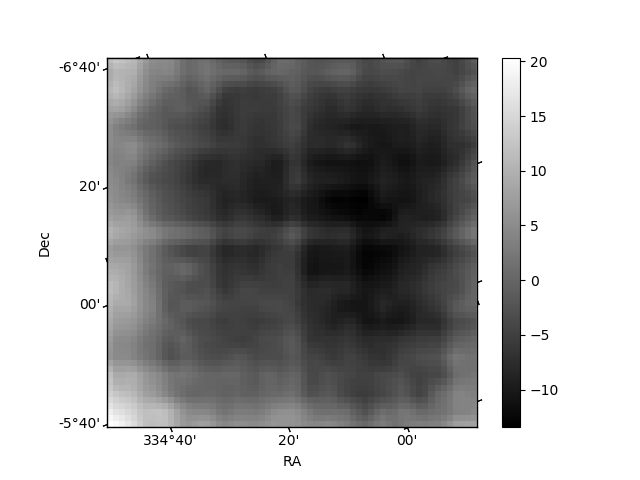
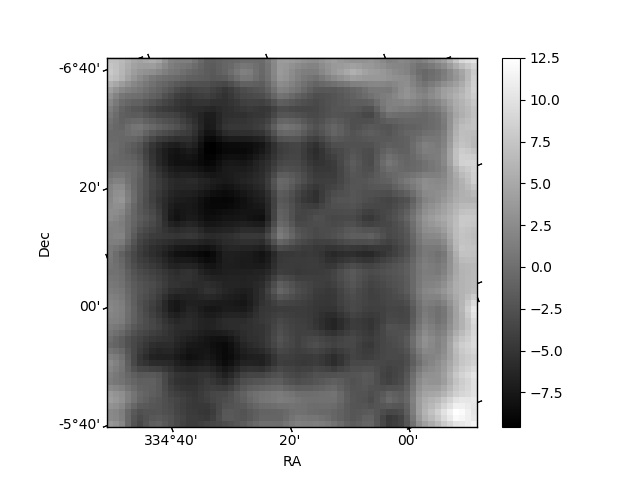
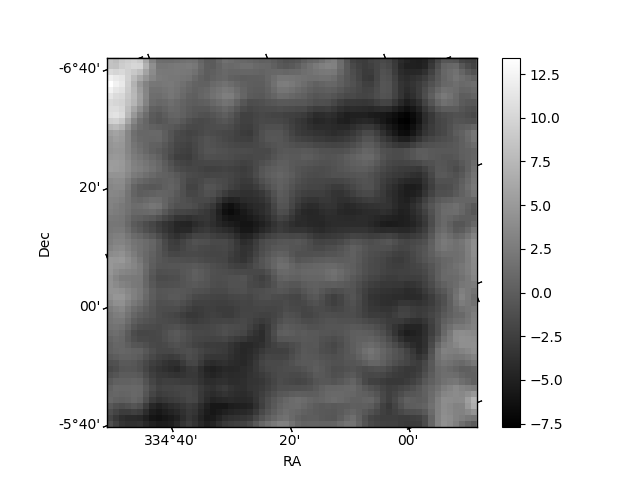
Histogram calculated using DETX and DETY for each event in the final _common_clean file
| Quadrant A | 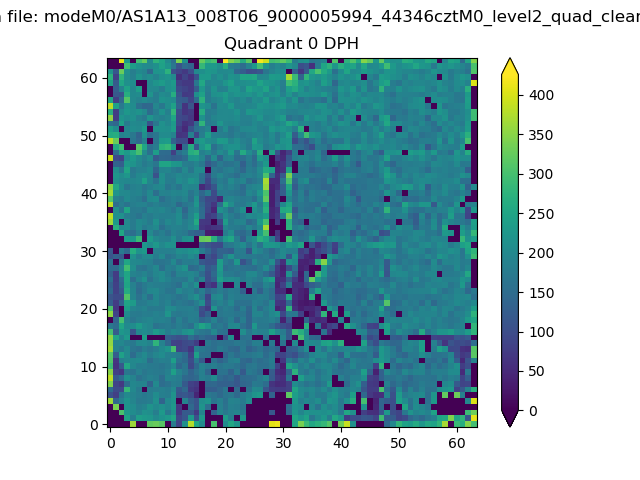 |
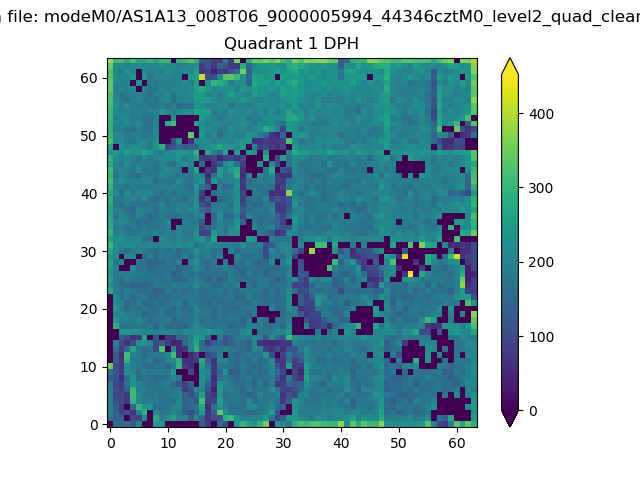 |
Quadrant B |
|---|---|---|---|
| Quadrant D | 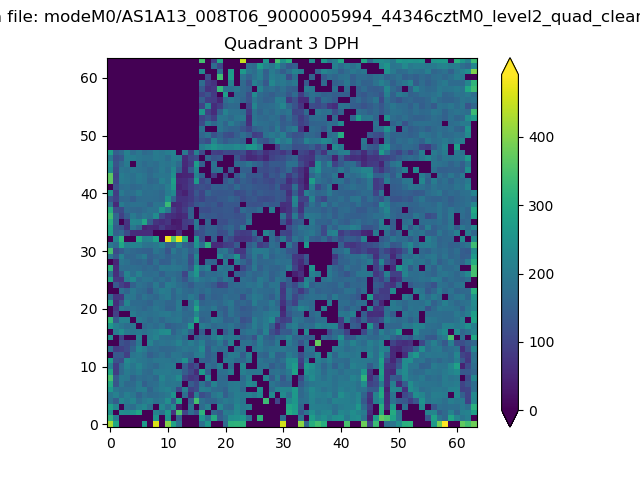 |
 |
Quadrant C |
| Plot type | Count rate plots | Images |
|---|---|---|
| Comparison with Poisson distribution Blue bars denote a histogram of data divided into 1 sec bins. Red curve is a Poisson curve with rate = median count rate of data. |
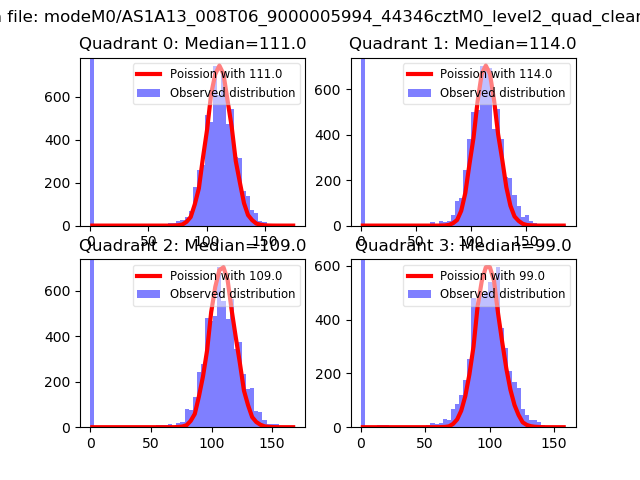 |
 |
| Quadrant-wise count rates Data is divided into 100 sec bins |
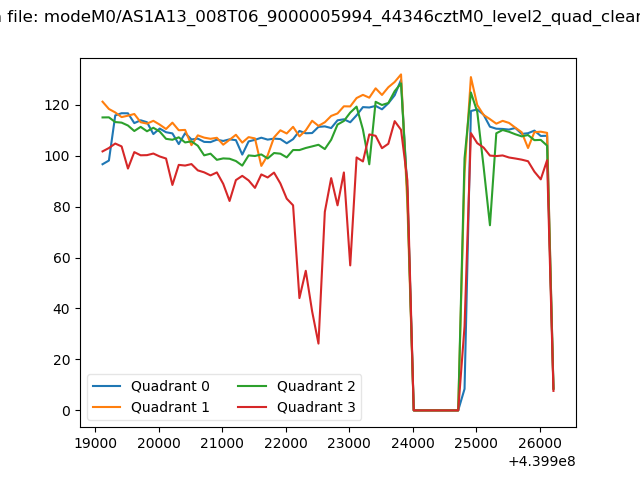 |
|
| Module-wise count rates for Quadrant A Data is divided into 100 sec bins |
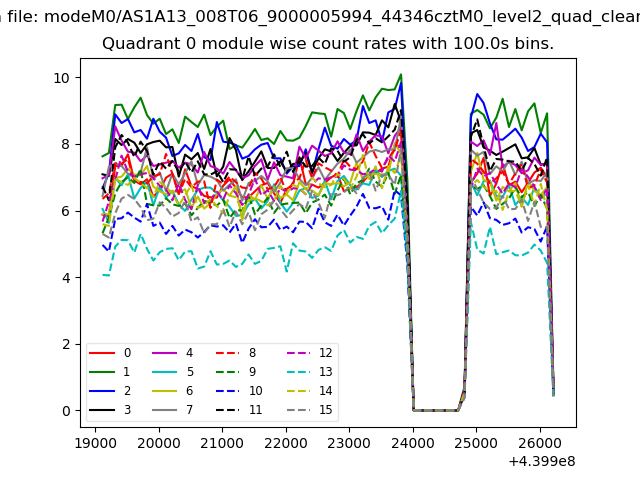 |
 |
| Module-wise count rates for Quadrant B Data is divided into 100 sec bins |
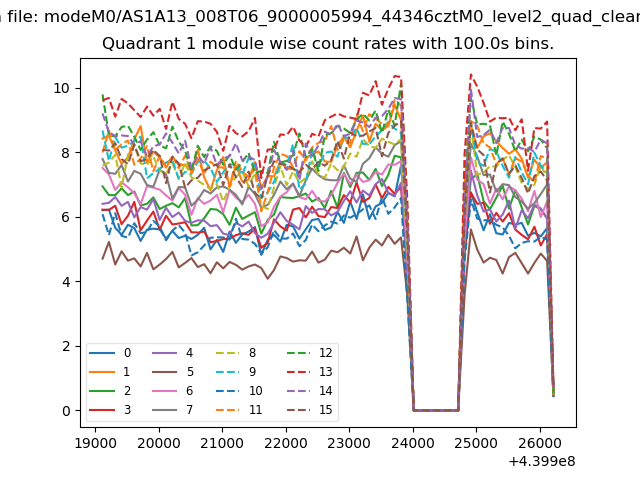 |
 |
| Module-wise count rates for Quadrant C Data is divided into 100 sec bins |
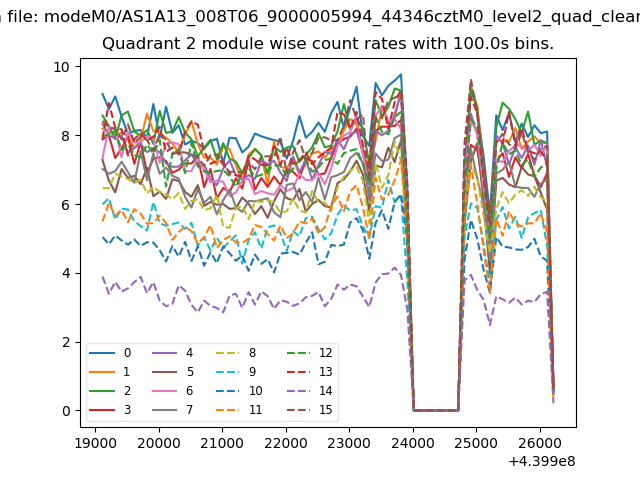 |
 |
| Module-wise count rates for Quadrant D Data is divided into 100 sec bins |
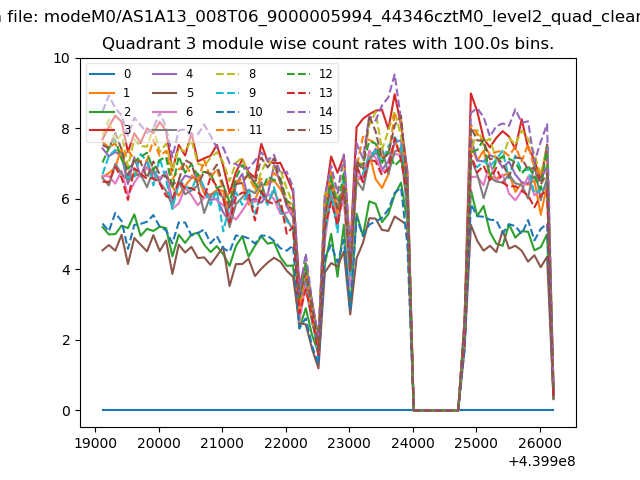 |
 |
| Parameter | Plot |
|---|---|
| CZT HV Monitor | 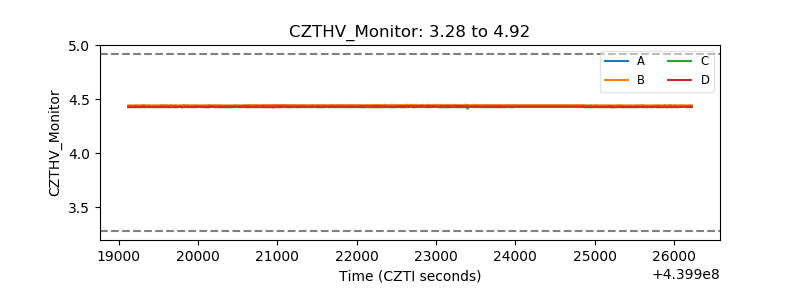 |
| D_VDD | 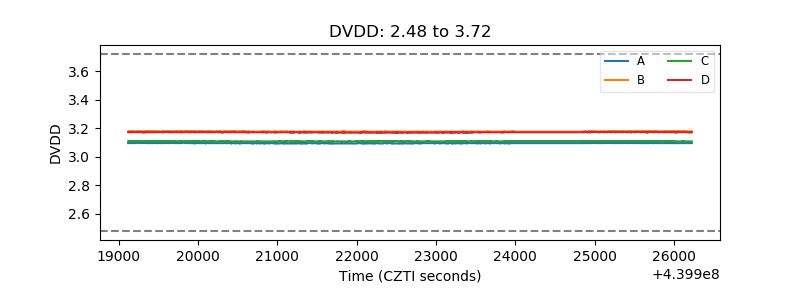 |
| Temperature 1 | 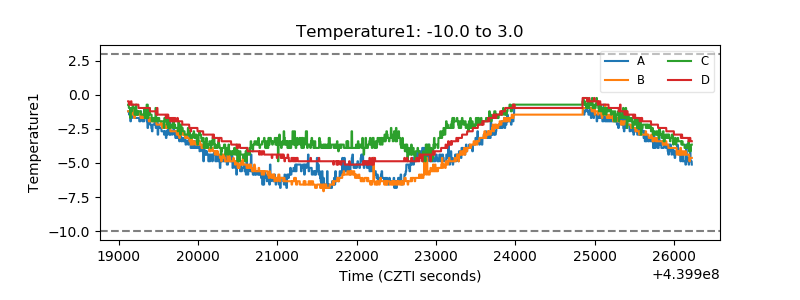 |
| Veto HV Monitor | 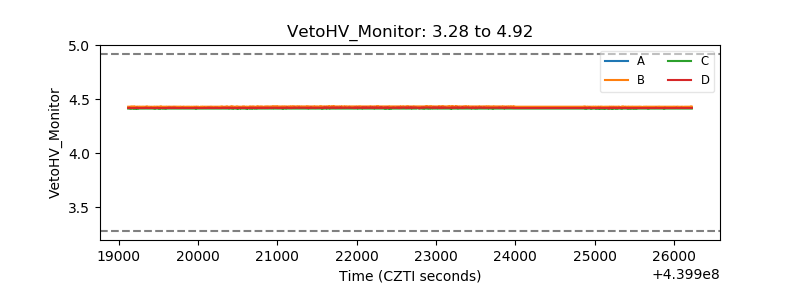 |
| Veto LLD | 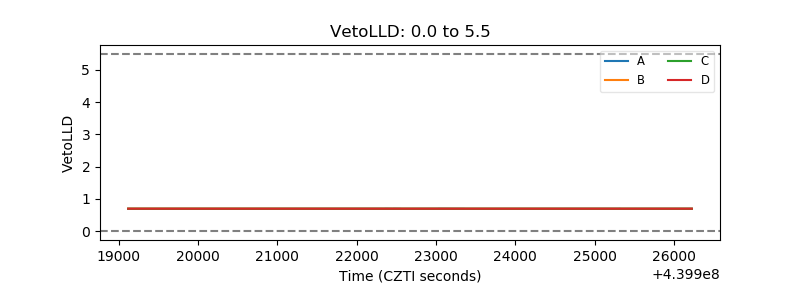 |
| Alpha Counter | 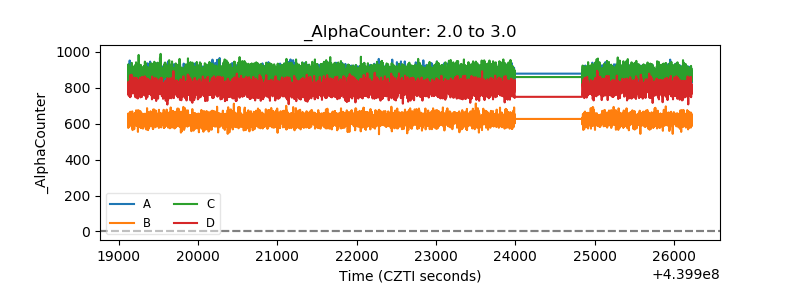 |
| _CPM_Rate | 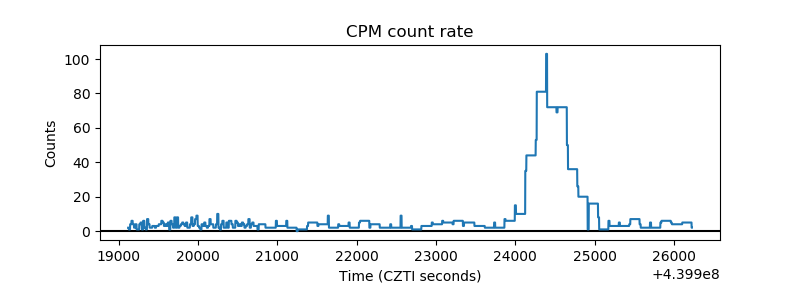 |
| CZT Counter | 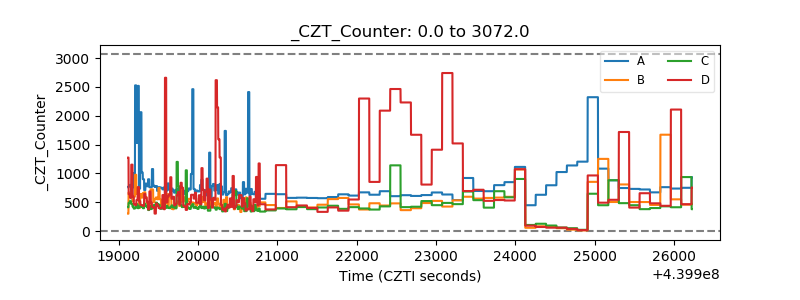 |
| +2.5 Volts monitor | 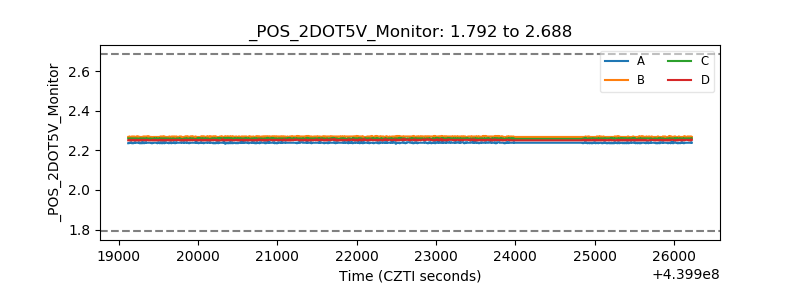 |
| +5 Volts monitor | 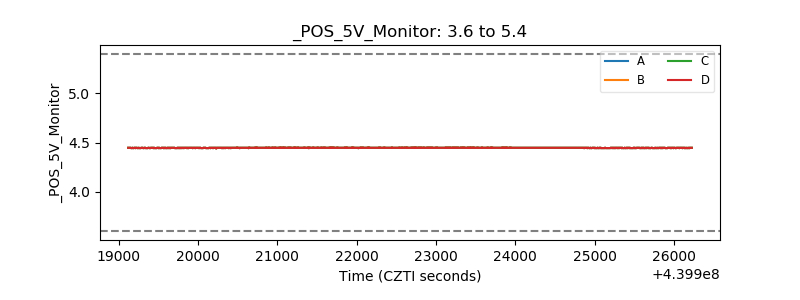 |
| _ROLL_ROT | 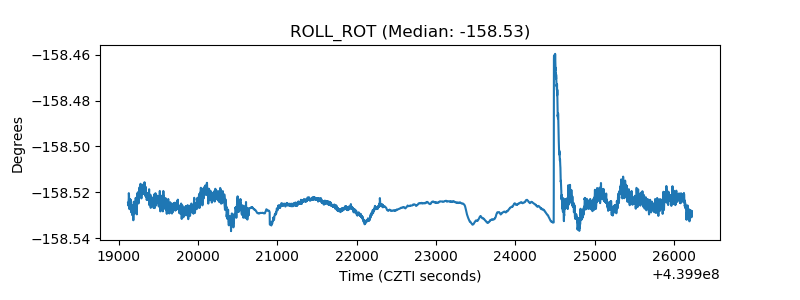 |
| _Roll_DEC | 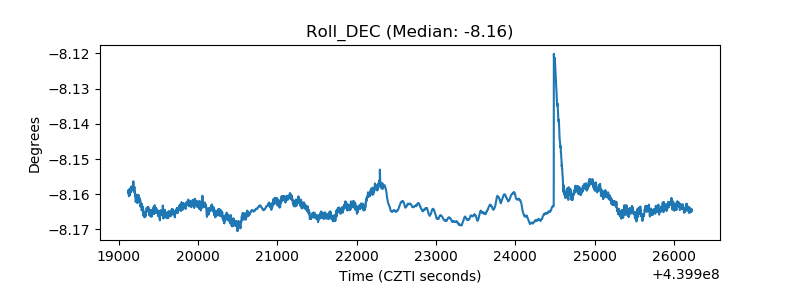 |
| _Roll_RA | 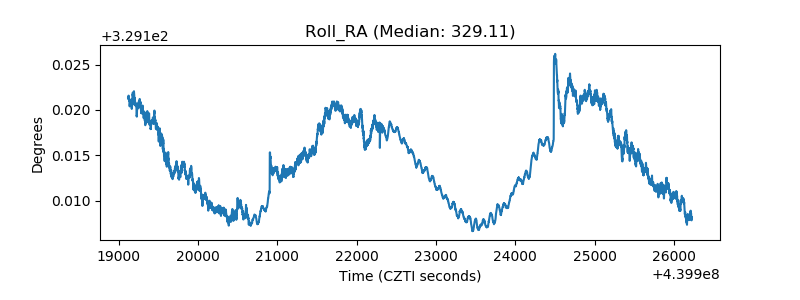 |
| Veto Counter | 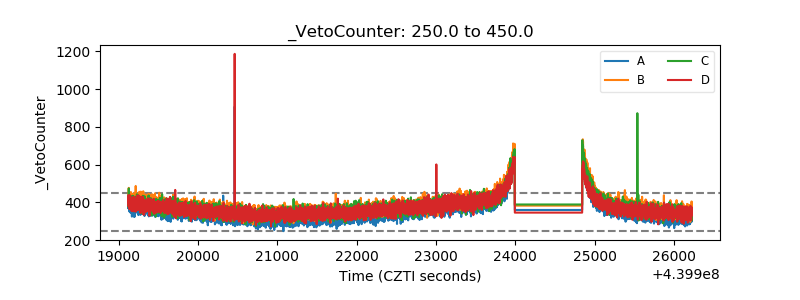 |