| Param | Original file | Final file |
|---|---|---|
| Filename | modeM0/AS1A13_008T06_9000005994_44347cztM0_level2.fits | modeM0/AS1A13_008T06_9000005994_44347cztM0_level2_quad_clean.evt |
| Size (bytes) | 398,162,880 | 93,456,000 |
| Size | 379.7 MB | 89.1 MB |
| Events in quadrant A | 4,451,220 | 619,780 |
| Events in quadrant B | 2,984,375 | 638,292 |
| Events in quadrant C | 2,896,309 | 610,984 |
| Events in quadrant D | 3,951,995 | 551,903 |
| Mode M9 | |||
|---|---|---|---|
| Quadrant | BADHDUFLAG | Total packets | Discarded packets |
| A | 1 | 139687015467048 | 139685221367854 |
| B | 1 | -1 | -1 |
| C | 1 | -1 | -1 |
| D | 1 | -1 | -1 |
| Mode SS | |||
|---|---|---|---|
| Quadrant | BADHDUFLAG | Total packets | Discarded packets |
| A | 0 | 117 | 1 |
| B | 0 | 116 | 0 |
| C | 0 | 117 | 1 |
| D | 0 | 116 | 0 |
| Mode M0 | |||
|---|---|---|---|
| Quadrant | BADHDUFLAG | Total packets | Discarded packets |
| A | 0 | 17920 | 99 |
| B | 0 | 12915 | 66 |
| C | 0 | 12930 | 61 |
| D | 0 | 15974 | 81 |
| Quadrant | Total seconds | Saturated seconds | Saturation percentage |
|---|---|---|---|
| A | 5850 | 108 | 1.846154% |
| B | 5853 | 50 | 0.854263% |
| C | 5855 | 61 | 1.041845% |
| D | 5847 | 217 | 3.711305% |
Noise dominated data is calculated using 1-second bins in cleaned event files. If a bin has >2000 counts, and if more than 50% of those come from <1% of pixels, then it is considered to be noise-dominated and hence unusable.
| Quadrant | # 1 sec bins | Bins with >0 counts | Bins with >2000 counts | High rate bins dominated by noise | Noise dominated (total time) | Noise dominated (detector-on time) | Marked lightcurve |
|---|---|---|---|---|---|---|---|
| A | 7288 | 5859 | 115 | 115 | 1.58% | 1.96% | 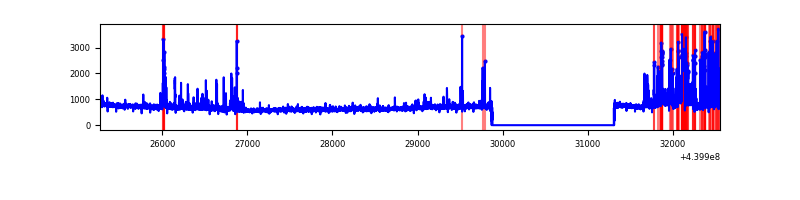 |
| B | 7287 | 5858 | 38 | 38 | 0.52% | 0.65% | 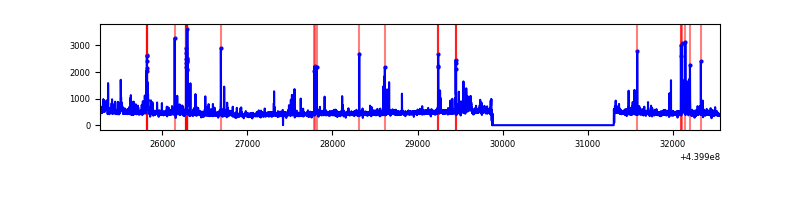 |
| C | 7287 | 5859 | 53 | 53 | 0.73% | 0.90% | 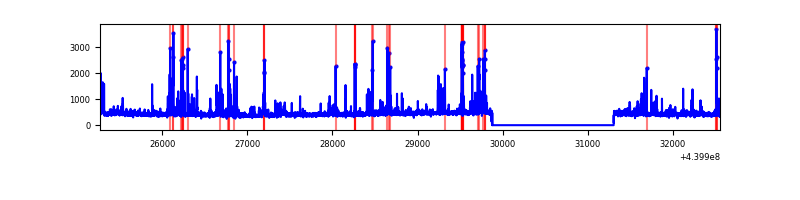 |
| D | 7288 | 5856 | 200 | 200 | 2.74% | 3.42% | 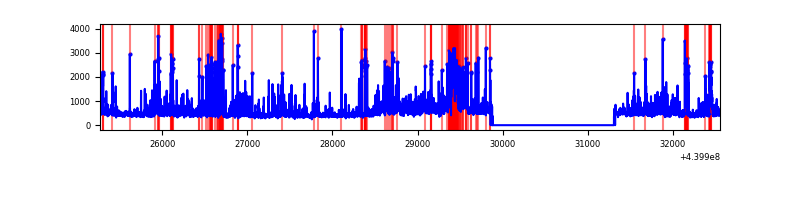 |
Top three noisy pixels from each quadrant. If the there are fewer than three noisy pixels in the level2.evt file, extra rows are filled as -1
| Pixel properties | Quadrant properties | ||||||
|---|---|---|---|---|---|---|---|
| Quadrant | DetID | PixID | Counts | Sigma | Mean | Median | Sigma |
| A | 10 | 83 | 1345039 | 10253.36 | 629 | 616 | 131.1 |
| A | 15 | 223 | 472600 | 3599.63 | 629 | 616 | 131.1 |
| A | 13 | 248 | 156815 | 1191.26 | 629 | 616 | 131.1 |
| B | 0 | 219 | 93816 | 743.47 | 632 | 613 | 125.4 |
| B | 5 | 255 | 82621 | 654.16 | 632 | 613 | 125.4 |
| B | 0 | 190 | 64062 | 506.12 | 632 | 613 | 125.4 |
| C | 14 | 254 | 437177 | 2982.19 | 618 | 622 | 146.4 |
| C | 1 | 3 | 22208 | 147.46 | 618 | 622 | 146.4 |
| C | 3 | 233 | 7254 | 45.3 | 618 | 622 | 146.4 |
| D | 7 | 96 | 430578 | 2782.52 | 610 | 591 | 154.5 |
| D | 2 | 153 | 265435 | 1713.85 | 610 | 591 | 154.5 |
| D | 13 | 249 | 196798 | 1269.69 | 610 | 591 | 154.5 |
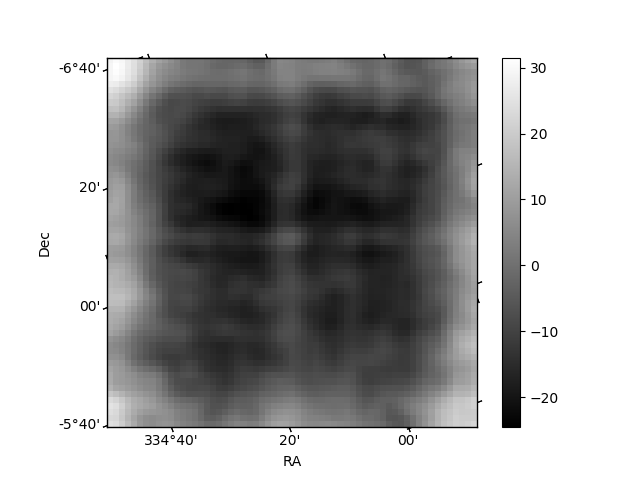
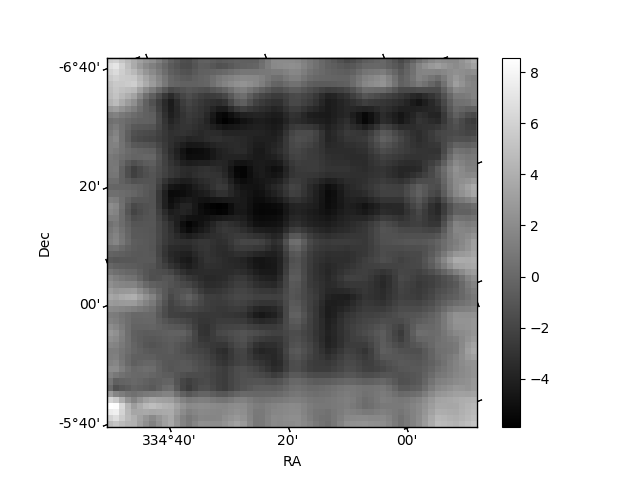
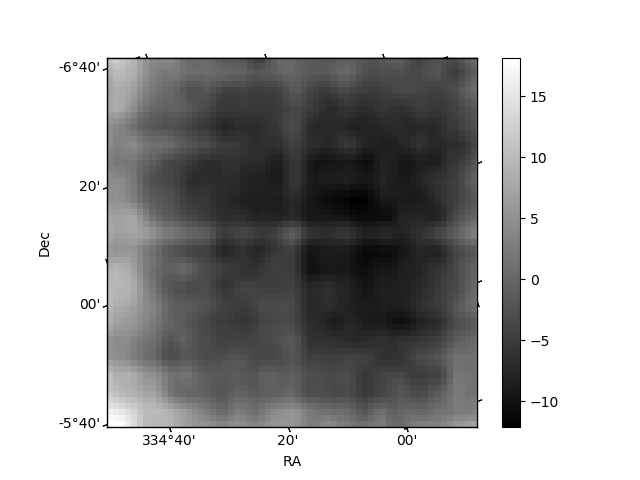
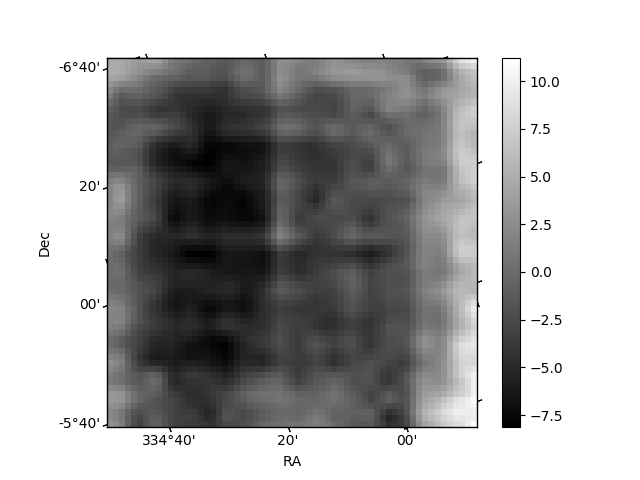
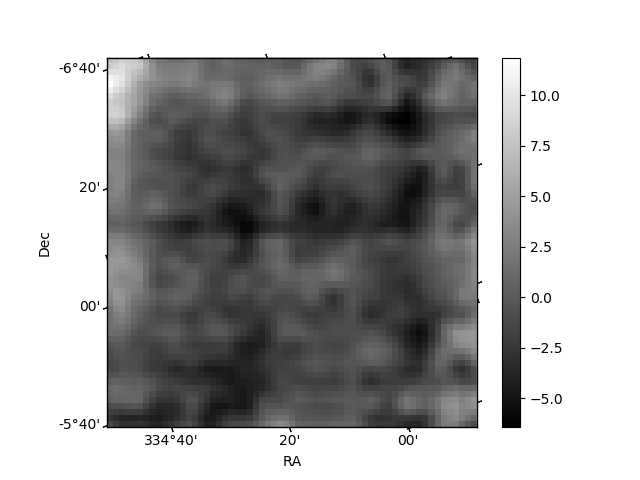
Histogram calculated using DETX and DETY for each event in the final _common_clean file
| Quadrant A | 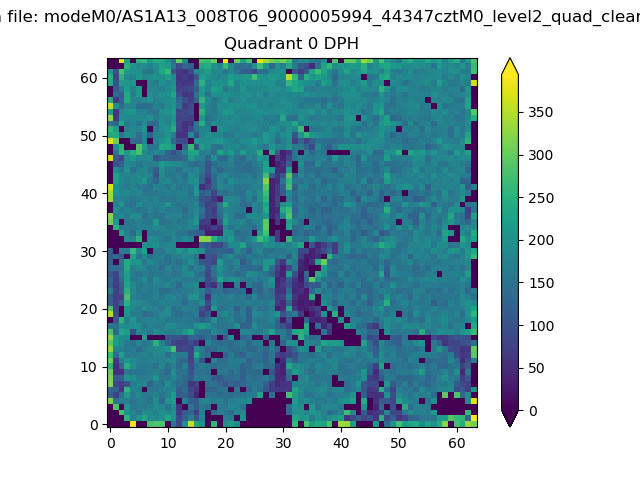 |
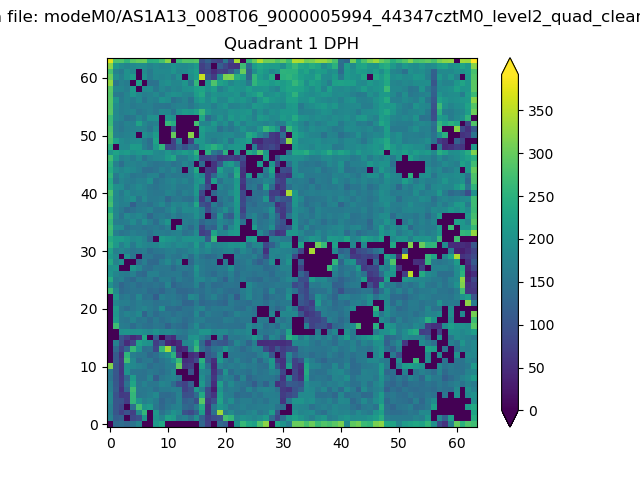 |
Quadrant B |
|---|---|---|---|
| Quadrant D | 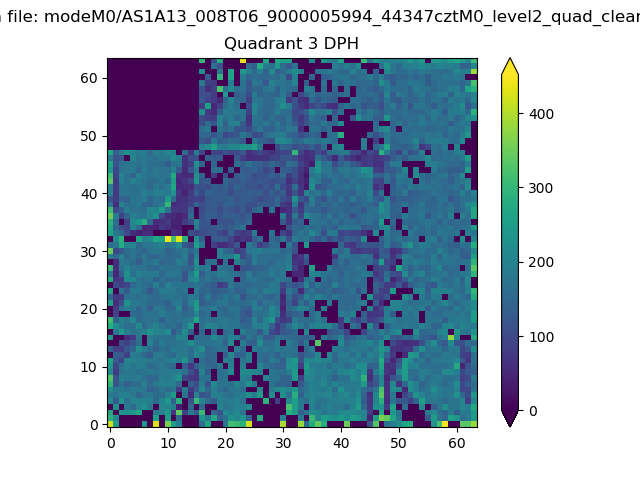 |
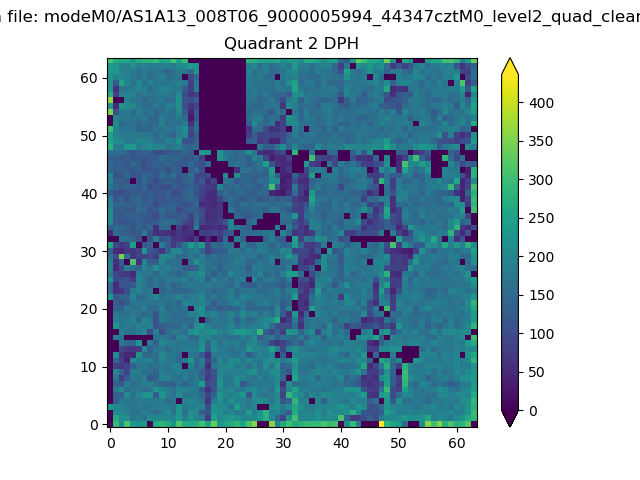 |
Quadrant C |
| Plot type | Count rate plots | Images |
|---|---|---|
| Comparison with Poisson distribution Blue bars denote a histogram of data divided into 1 sec bins. Red curve is a Poisson curve with rate = median count rate of data. |
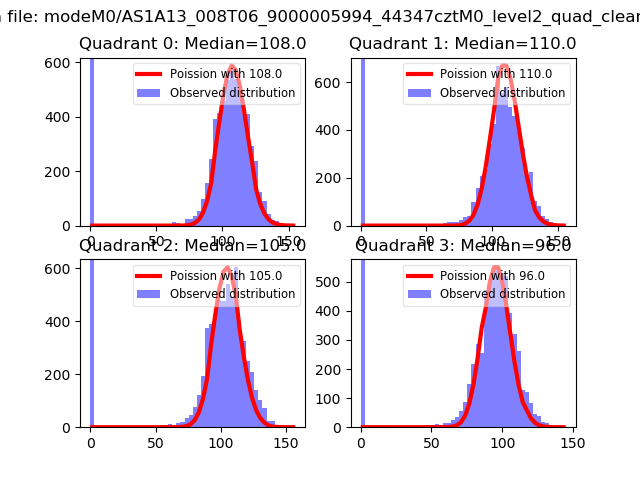 |
 |
| Quadrant-wise count rates Data is divided into 100 sec bins |
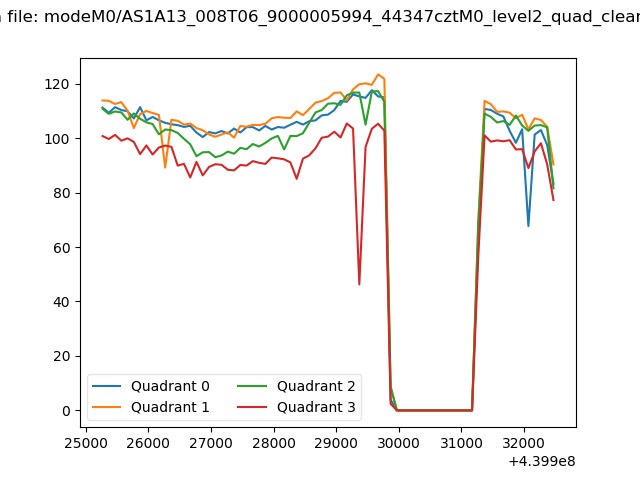 |
|
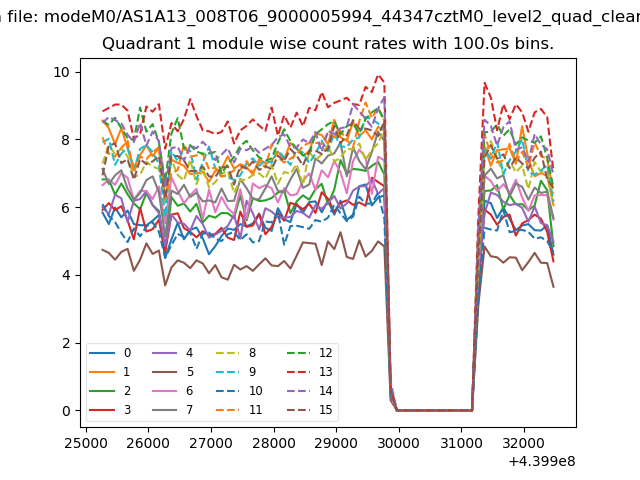
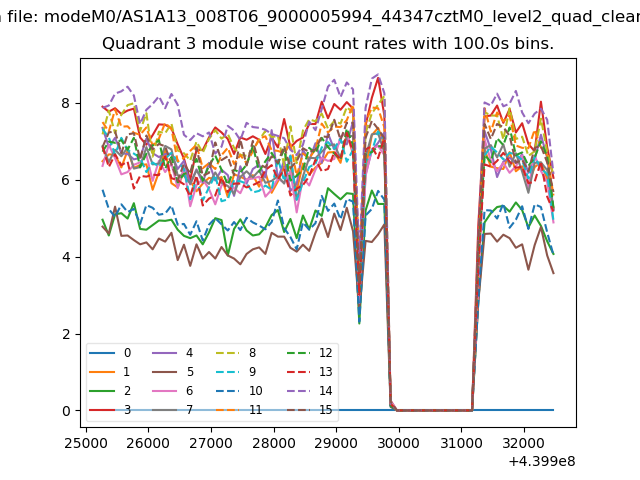
| Module-wise count rates for Quadrant A Data is divided into 100 sec bins |
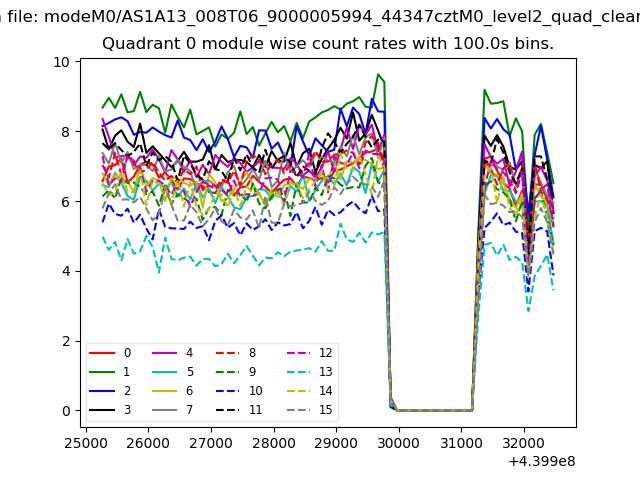 |
 |
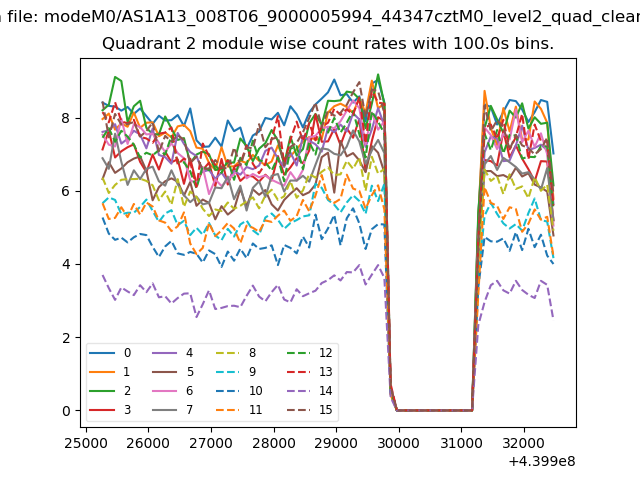
| Module-wise count rates for Quadrant B Data is divided into 100 sec bins |
 |
 |
| Module-wise count rates for Quadrant C Data is divided into 100 sec bins |
 |
 |
| Module-wise count rates for Quadrant D Data is divided into 100 sec bins |
 |
 |
| Parameter | Plot |
|---|---|
| CZT HV Monitor | 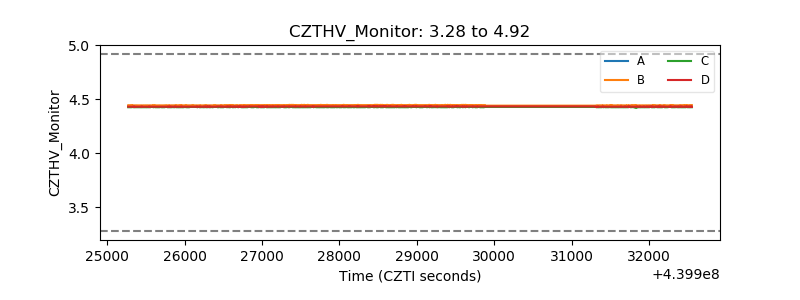 |
| D_VDD | 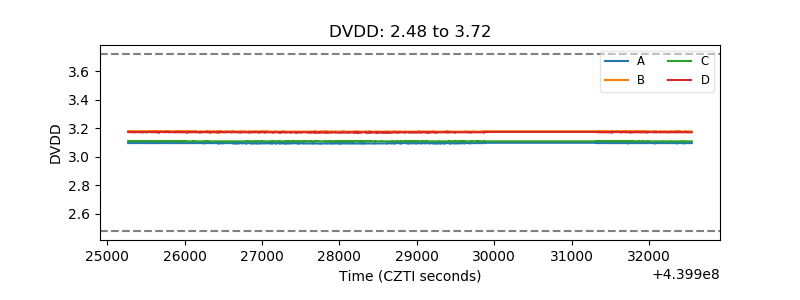 |
| Temperature 1 | 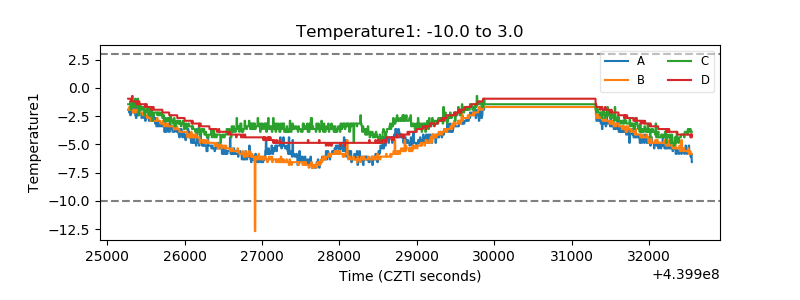 |
| Veto HV Monitor | 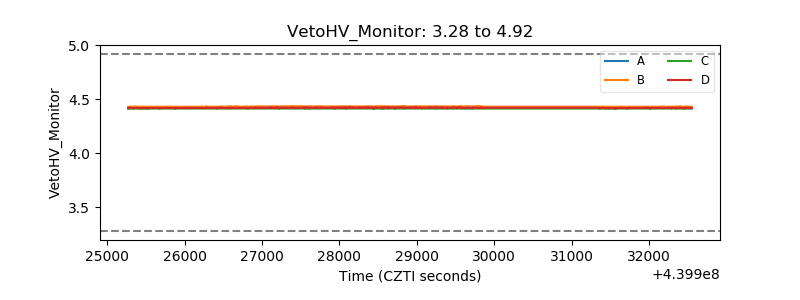 |
| Veto LLD | 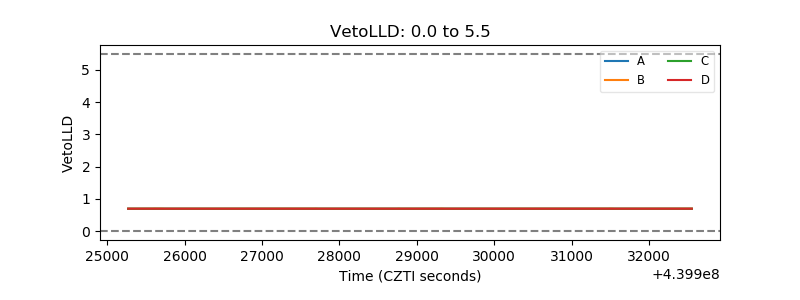 |
| Alpha Counter | 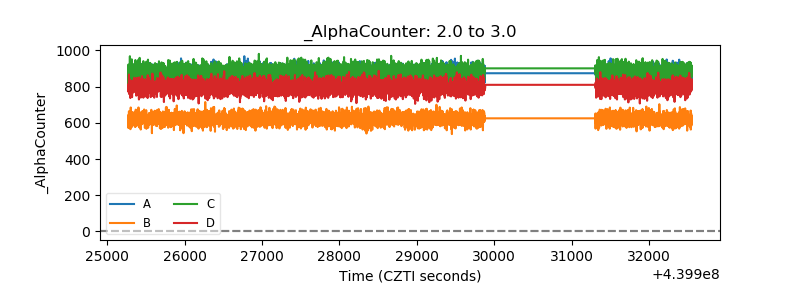 |
| _CPM_Rate | 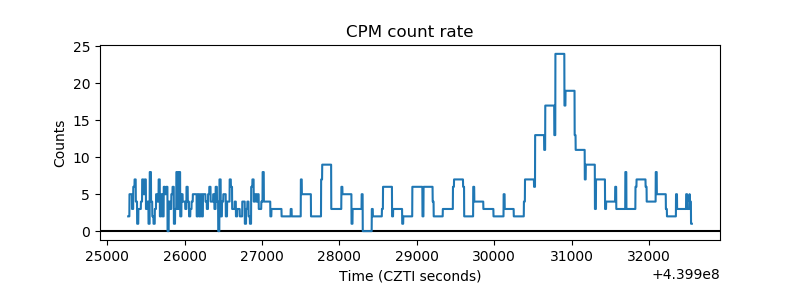 |
| CZT Counter | 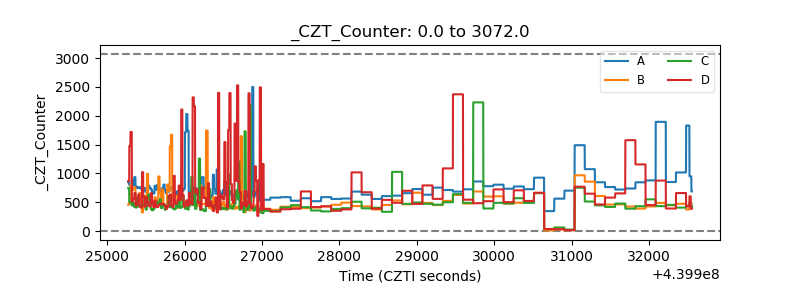 |
| +2.5 Volts monitor | 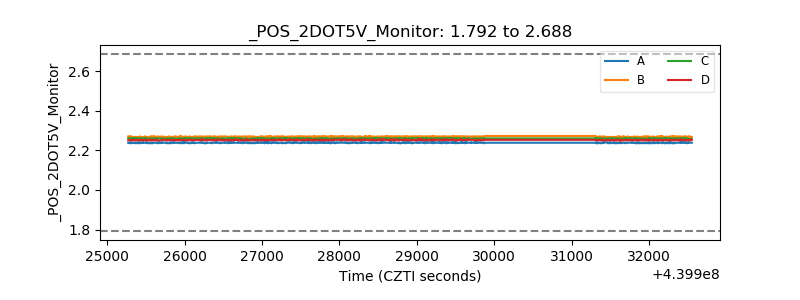 |
| +5 Volts monitor | 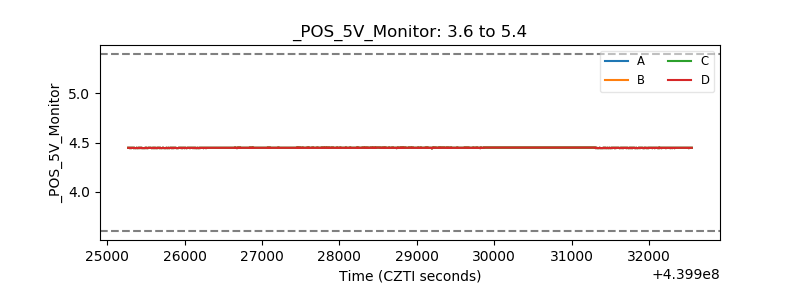 |
| _ROLL_ROT | 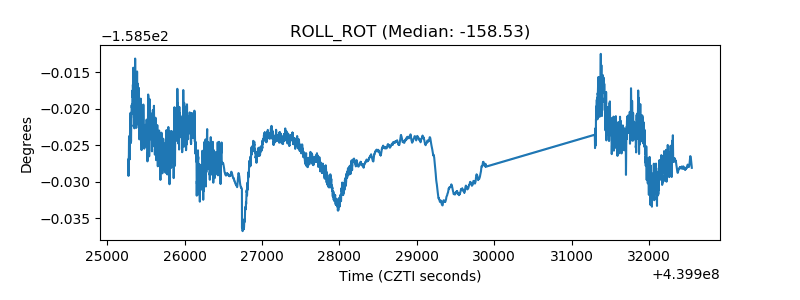 |
| _Roll_DEC | 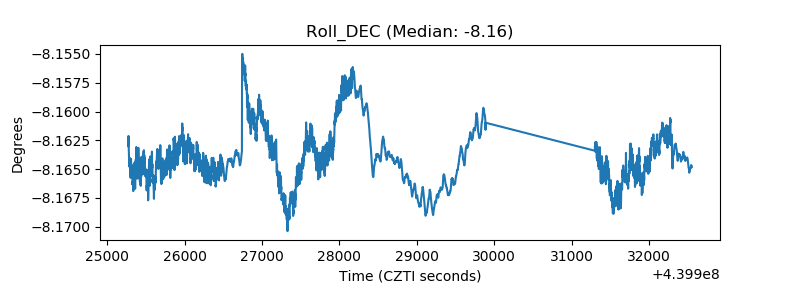 |
| _Roll_RA | 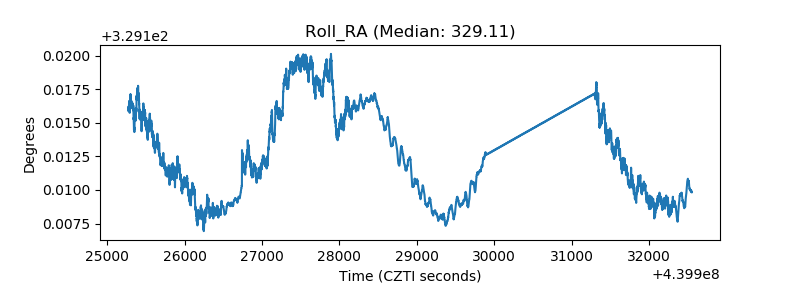 |
| Veto Counter | 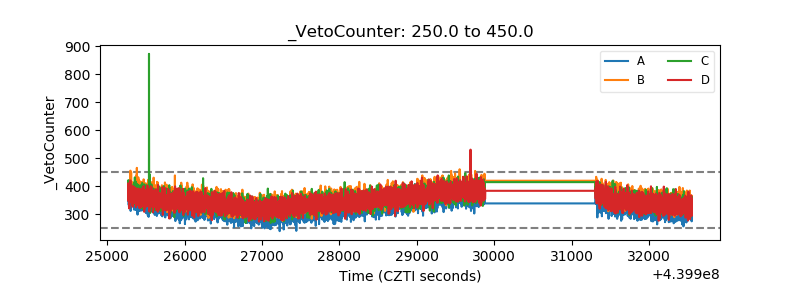 |