| Param | Original file | Final file |
|---|---|---|
| Filename | modeM0/AS1A13_008T06_9000005994_44348cztM0_level2.fits | modeM0/AS1A13_008T06_9000005994_44348cztM0_level2_quad_clean.evt |
| Size (bytes) | 638,821,440 | 119,229,120 |
| Size | 609.2 MB | 113.7 MB |
| Events in quadrant A | 9,593,563 | 675,778 |
| Events in quadrant B | 4,008,172 | 853,853 |
| Events in quadrant C | 3,804,431 | 821,925 |
| Events in quadrant D | 5,638,380 | 718,115 |
| Mode SS | |||
|---|---|---|---|
| Quadrant | BADHDUFLAG | Total packets | Discarded packets |
| A | 0 | 154 | 0 |
| B | 0 | 154 | 0 |
| C | 0 | 154 | 0 |
| D | 0 | 154 | 0 |
| Mode M0 | |||
|---|---|---|---|
| Quadrant | BADHDUFLAG | Total packets | Discarded packets |
| A | 0 | 34218 | 0 |
| B | 0 | 17201 | 0 |
| C | 0 | 16978 | 1 |
| D | 0 | 22152 | 0 |
| Quadrant | Total seconds | Saturated seconds | Saturation percentage |
|---|---|---|---|
| A | 7772 | 1627 | 20.934122% |
| B | 7773 | 92 | 1.183584% |
| C | 7772 | 49 | 0.630468% |
| D | 7772 | 520 | 6.690685% |
Noise dominated data is calculated using 1-second bins in cleaned event files. If a bin has >2000 counts, and if more than 50% of those come from <1% of pixels, then it is considered to be noise-dominated and hence unusable.
| Quadrant | # 1 sec bins | Bins with >0 counts | Bins with >2000 counts | High rate bins dominated by noise | Noise dominated (total time) | Noise dominated (detector-on time) | Marked lightcurve |
|---|---|---|---|---|---|---|---|
| A | 7772 | 7772 | 1396 | 1396 | 17.96% | 17.96% | 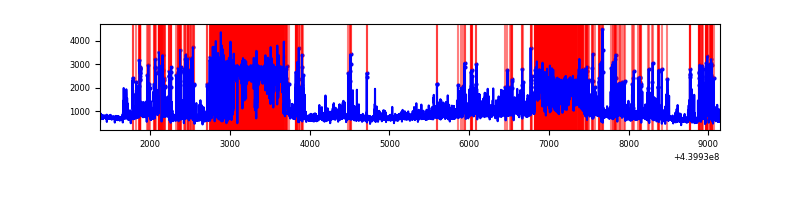 |
| B | 7773 | 7773 | 31 | 31 | 0.40% | 0.40% |  |
| C | 7772 | 7772 | 33 | 33 | 0.42% | 0.42% | 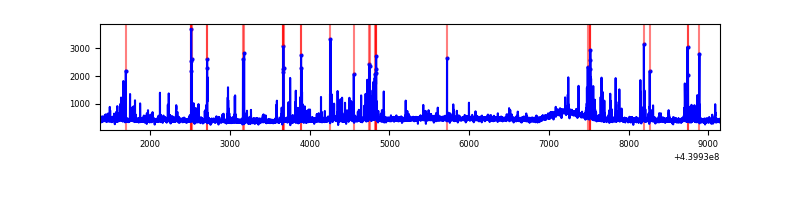 |
| D | 7772 | 7772 | 465 | 465 | 5.98% | 5.98% | 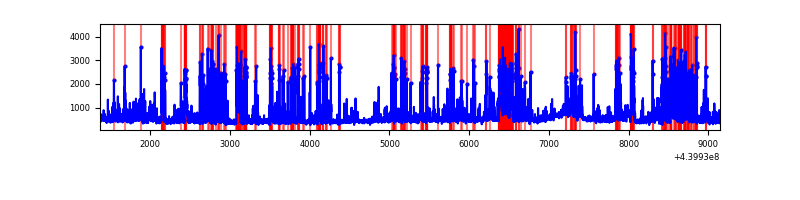 |
Top three noisy pixels from each quadrant. If the there are fewer than three noisy pixels in the level2.evt file, extra rows are filled as -1
| Pixel properties | Quadrant properties | ||||||
|---|---|---|---|---|---|---|---|
| Quadrant | DetID | PixID | Counts | Sigma | Mean | Median | Sigma |
| A | 15 | 223 | 3644131 | 22279.91 | 789 | 772 | 163.5 |
| A | 10 | 83 | 1584963 | 9687.66 | 789 | 772 | 163.5 |
| A | 13 | 248 | 1253764 | 7662.31 | 789 | 772 | 163.5 |
| B | 0 | 219 | 117245 | 666.08 | 878 | 851 | 174.7 |
| B | 5 | 172 | 101360 | 575.18 | 878 | 851 | 174.7 |
| B | 0 | 190 | 77238 | 437.13 | 878 | 851 | 174.7 |
| C | 14 | 254 | 338584 | 1656.78 | 859 | 865 | 203.8 |
| C | 14 | 96 | 37558 | 180.01 | 859 | 865 | 203.8 |
| C | 1 | 3 | 34989 | 167.41 | 859 | 865 | 203.8 |
| D | 5 | 235 | 815244 | 3838.95 | 837 | 811 | 212.2 |
| D | 13 | 249 | 668751 | 3148.43 | 837 | 811 | 212.2 |
| D | 2 | 153 | 174725 | 819.77 | 837 | 811 | 212.2 |
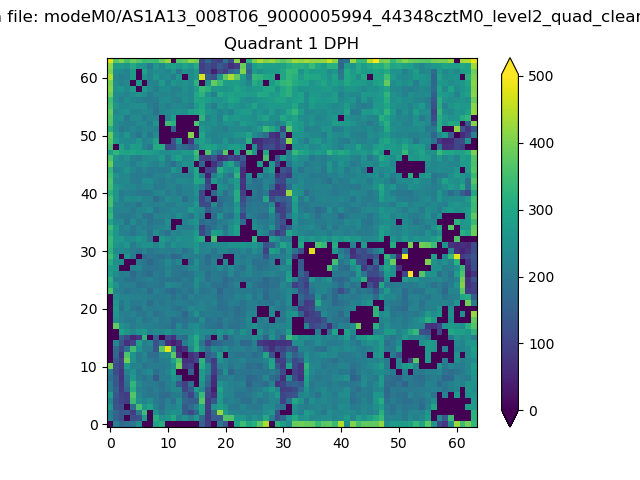
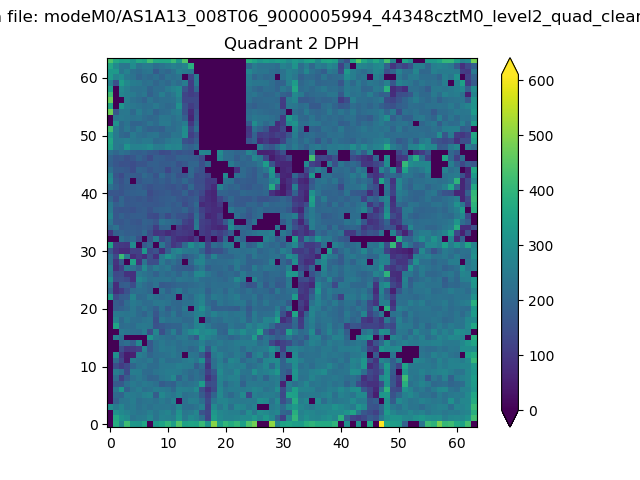
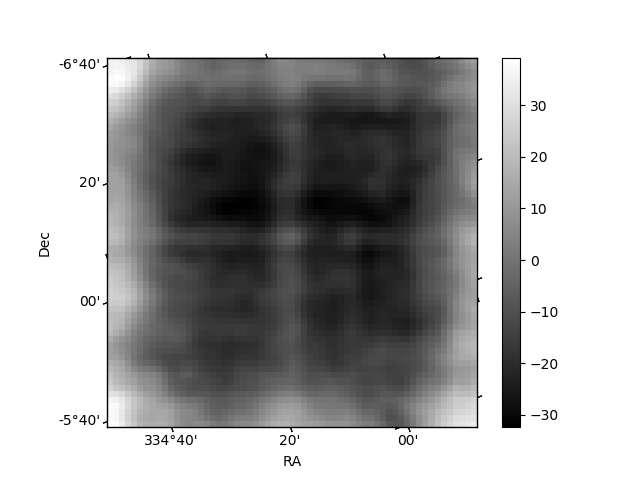
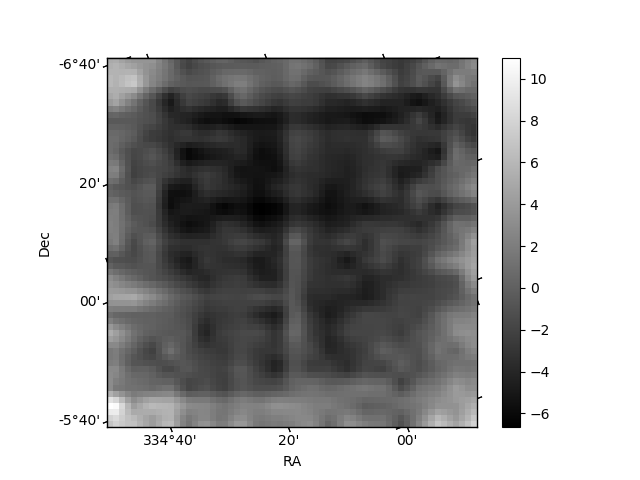
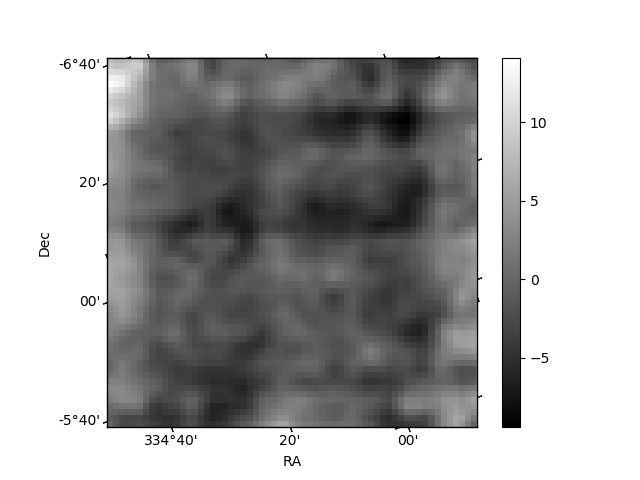
Histogram calculated using DETX and DETY for each event in the final _common_clean file
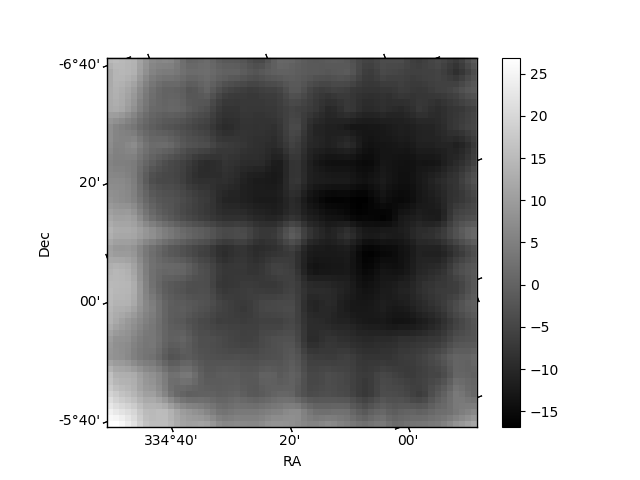
| Quadrant A | 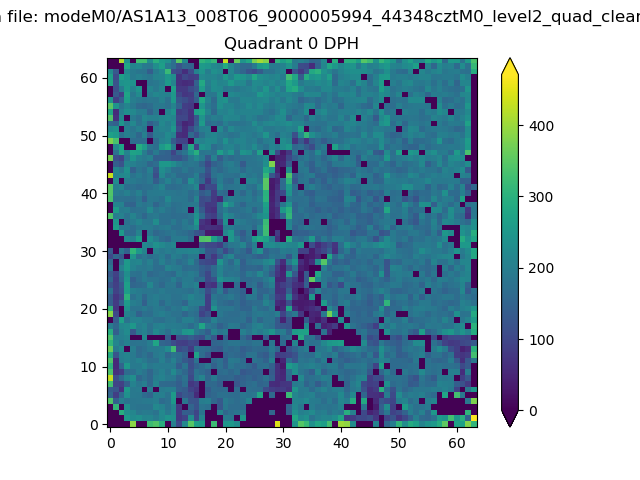 |
 |
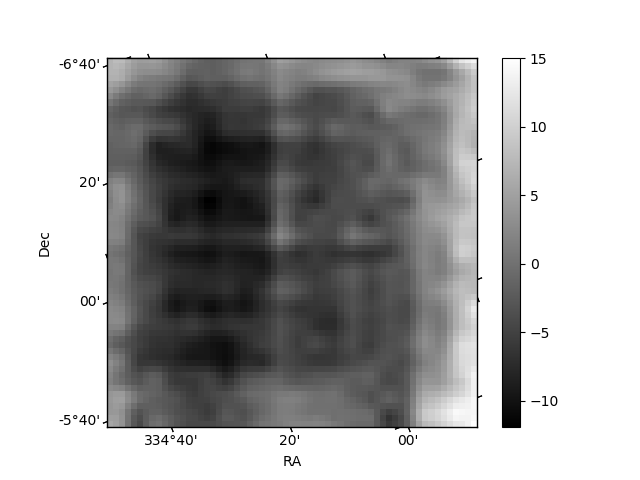
Quadrant B |
|---|---|---|---|
| Quadrant D | 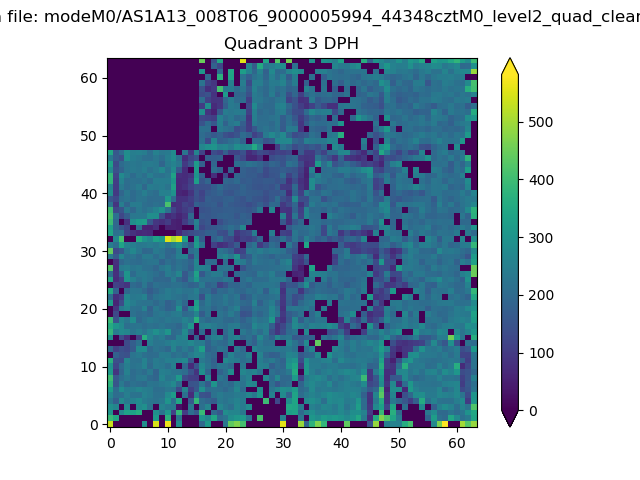 |
 |
Quadrant C |
| Plot type | Count rate plots | Images |
|---|---|---|
| Comparison with Poisson distribution Blue bars denote a histogram of data divided into 1 sec bins. Red curve is a Poisson curve with rate = median count rate of data. |
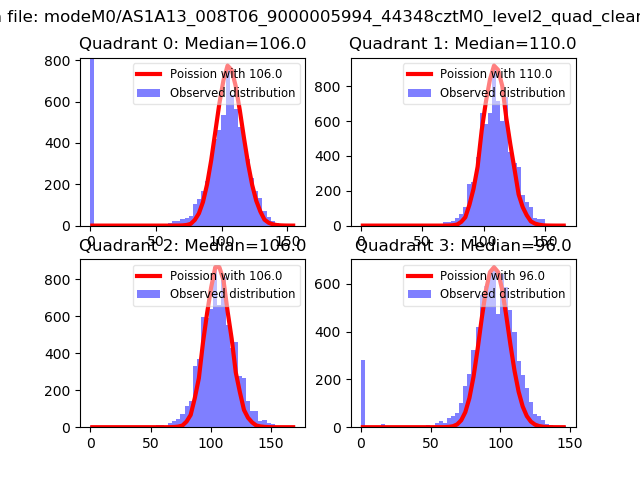 |
 |
| Quadrant-wise count rates Data is divided into 100 sec bins |
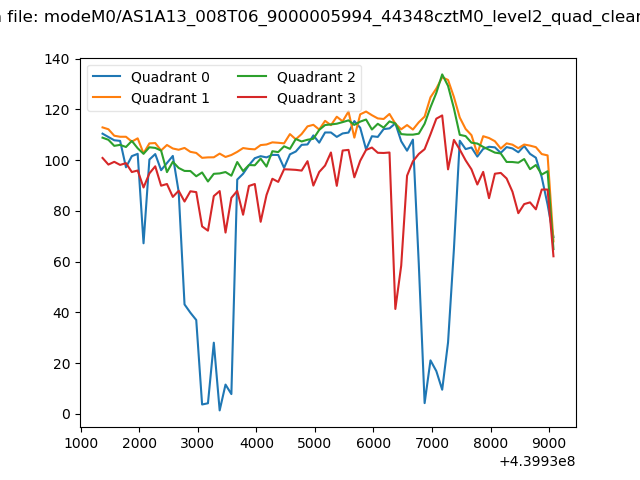 |
|
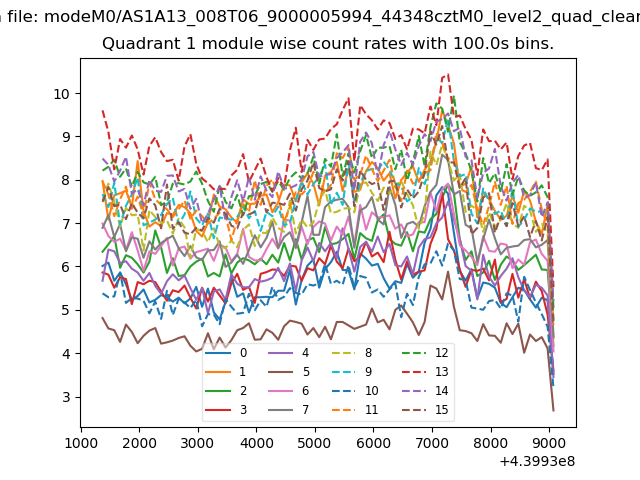
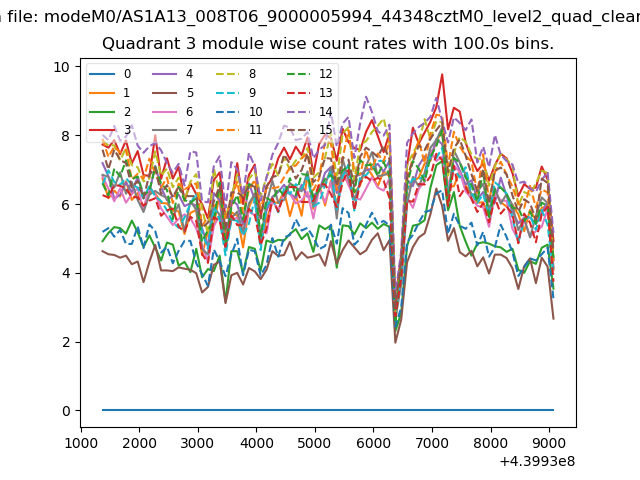
| Module-wise count rates for Quadrant A Data is divided into 100 sec bins |
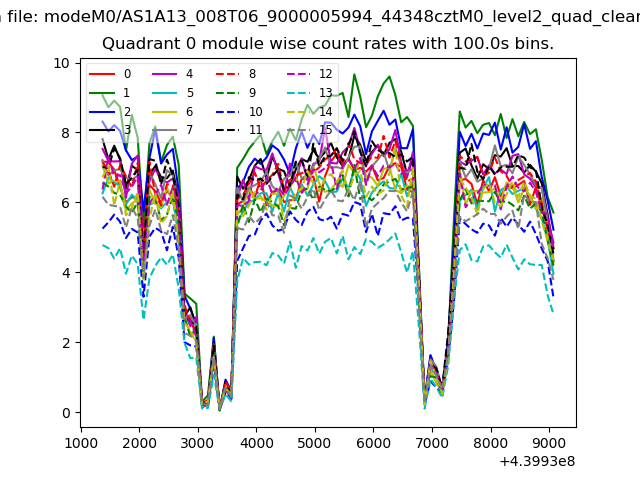 |
 |
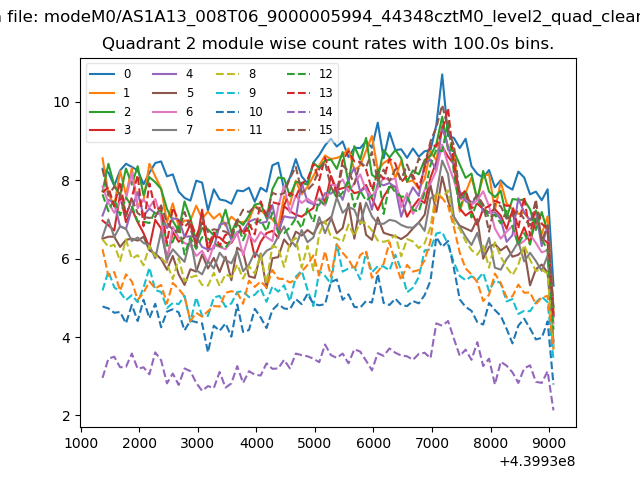
| Module-wise count rates for Quadrant B Data is divided into 100 sec bins |
 |
 |
| Module-wise count rates for Quadrant C Data is divided into 100 sec bins |
 |
 |
| Module-wise count rates for Quadrant D Data is divided into 100 sec bins |
 |
 |
| Parameter | Plot |
|---|---|
| CZT HV Monitor | 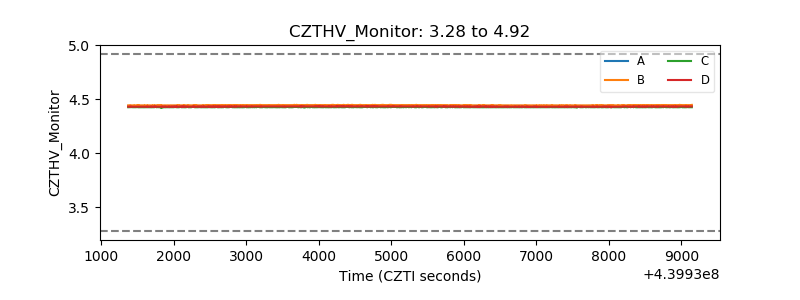 |
| D_VDD | 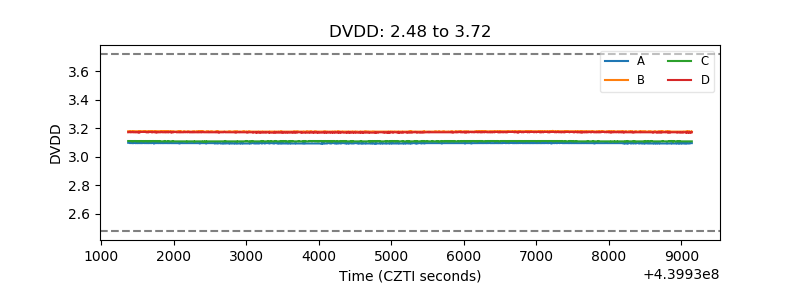 |
| Temperature 1 | 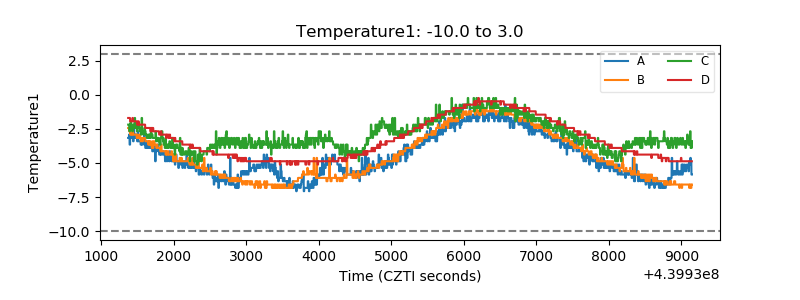 |
| Veto HV Monitor |  |
| Veto LLD | 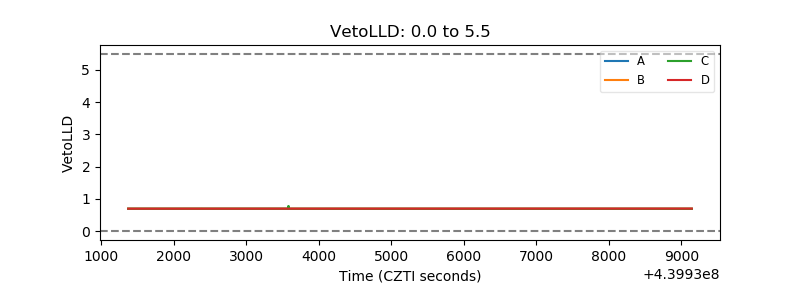 |
| Alpha Counter | 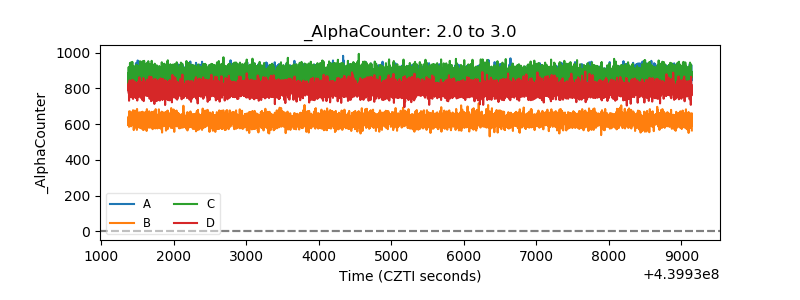 |
| _CPM_Rate | 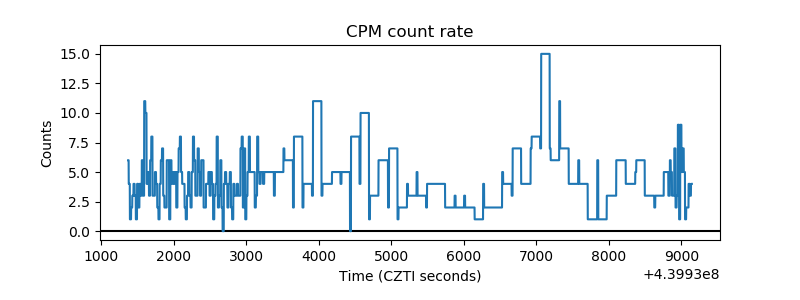 |
| CZT Counter | 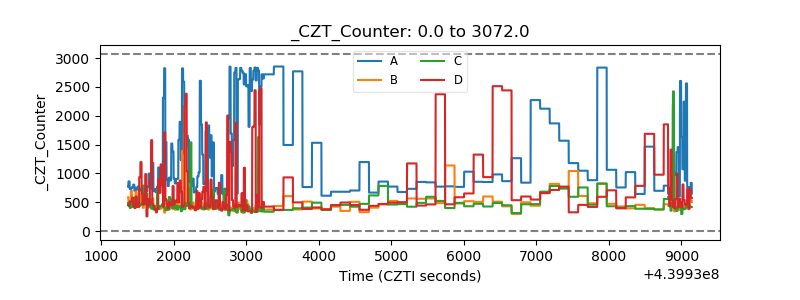 |
| +2.5 Volts monitor | 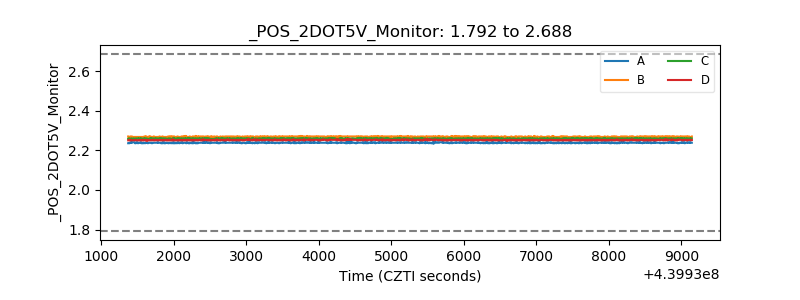 |
| +5 Volts monitor | 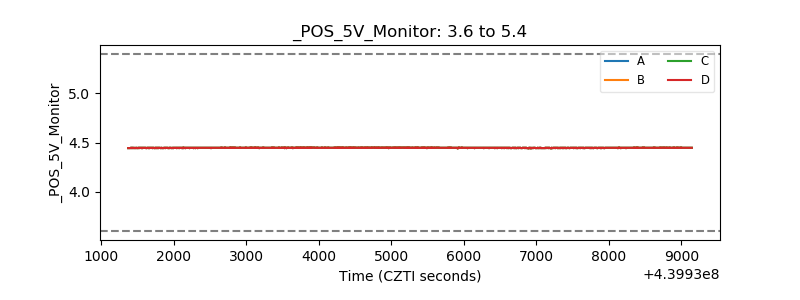 |
| _ROLL_ROT | 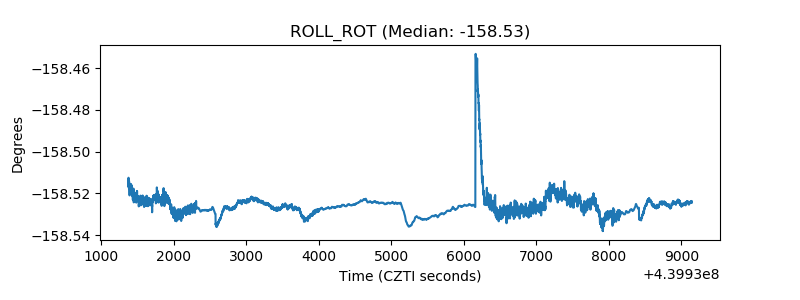 |
| _Roll_DEC | 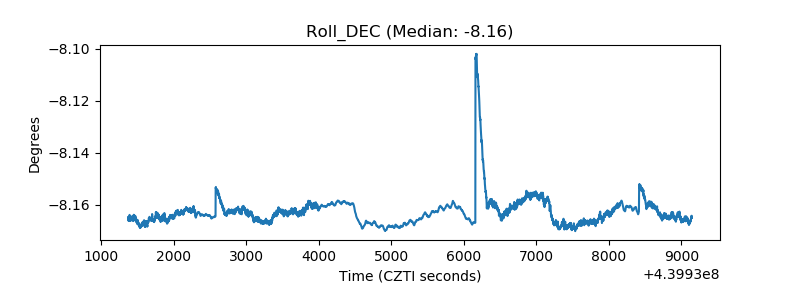 |
| _Roll_RA | 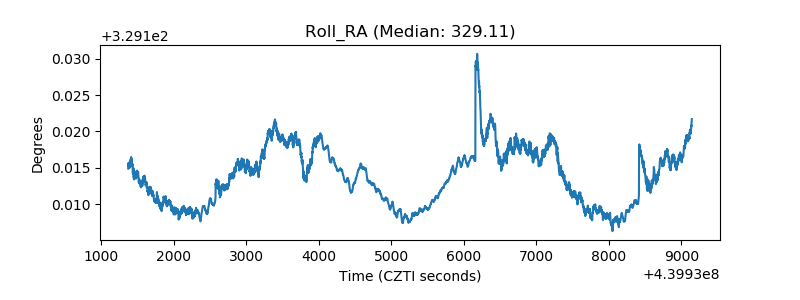 |
| Veto Counter | 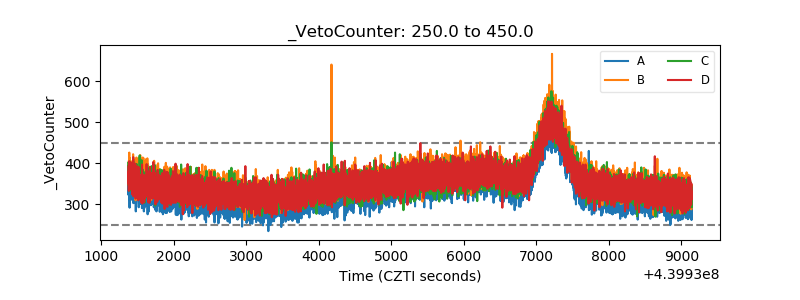 |