| Param | Original file | Final file |
|---|---|---|
| Filename | modeM0/AS1A13_008T06_9000005994_44349cztM0_level2.fits | modeM0/AS1A13_008T06_9000005994_44349cztM0_level2_quad_clean.evt |
| Size (bytes) | 666,515,520 | 128,024,640 |
| Size | 635.6 MB | 122.1 MB |
| Events in quadrant A | 8,136,902 | 803,728 |
| Events in quadrant B | 4,588,713 | 890,715 |
| Events in quadrant C | 4,541,414 | 856,563 |
| Events in quadrant D | 6,772,615 | 758,160 |
| Mode M9 | |||
|---|---|---|---|
| Quadrant | BADHDUFLAG | Total packets | Discarded packets |
| A | 0 | 1 | 0 |
| B | 0 | 1 | 0 |
| C | 0 | 1 | 0 |
| D | 0 | 1 | 0 |
| Mode SS | |||
|---|---|---|---|
| Quadrant | BADHDUFLAG | Total packets | Discarded packets |
| A | 0 | 162 | 0 |
| B | 0 | 162 | 0 |
| C | 0 | 162 | 0 |
| D | 0 | 162 | 0 |
| Mode M0 | |||
|---|---|---|---|
| Quadrant | BADHDUFLAG | Total packets | Discarded packets |
| A | 0 | 30419 | 1 |
| B | 0 | 19134 | 1 |
| C | 0 | 19377 | 1 |
| D | 0 | 25782 | 4 |
| Quadrant | Total seconds | Saturated seconds | Saturation percentage |
|---|---|---|---|
| A | 8168 | 857 | 10.492165% |
| B | 8169 | 192 | 2.350349% |
| C | 8169 | 144 | 1.762762% |
| D | 8168 | 576 | 7.051910% |
Noise dominated data is calculated using 1-second bins in cleaned event files. If a bin has >2000 counts, and if more than 50% of those come from <1% of pixels, then it is considered to be noise-dominated and hence unusable.
| Quadrant | # 1 sec bins | Bins with >0 counts | Bins with >2000 counts | High rate bins dominated by noise | Noise dominated (total time) | Noise dominated (detector-on time) | Marked lightcurve |
|---|---|---|---|---|---|---|---|
| A | 8183 | 8169 | 515 | 515 | 6.29% | 6.30% | 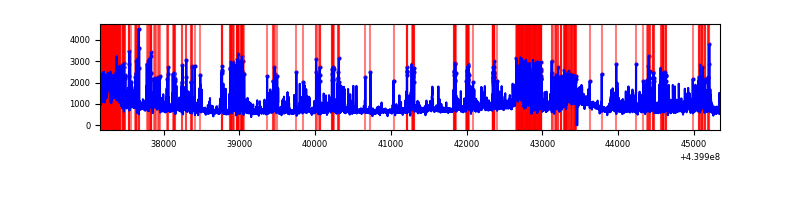 |
| B | 8184 | 8170 | 47 | 47 | 0.57% | 0.58% | 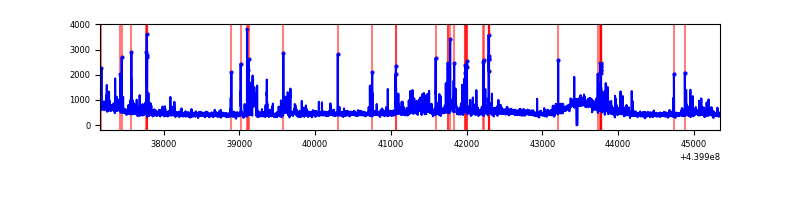 |
| C | 8184 | 8170 | 112 | 112 | 1.37% | 1.37% | 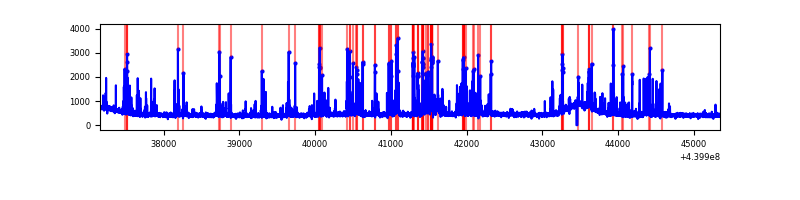 |
| D | 8183 | 8169 | 531 | 531 | 6.49% | 6.50% | 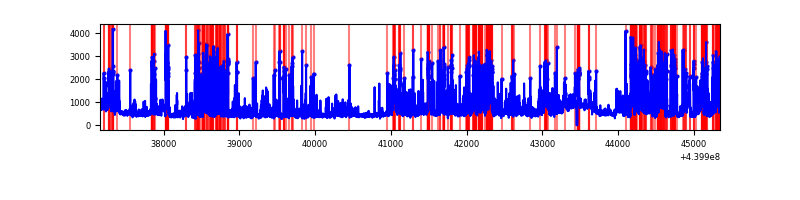 |
Top three noisy pixels from each quadrant. If the there are fewer than three noisy pixels in the level2.evt file, extra rows are filled as -1
| Pixel properties | Quadrant properties | ||||||
|---|---|---|---|---|---|---|---|
| Quadrant | DetID | PixID | Counts | Sigma | Mean | Median | Sigma |
| A | 15 | 223 | 1807418 | 9493.77 | 911 | 891 | 190.3 |
| A | 10 | 83 | 1734395 | 9110.02 | 911 | 891 | 190.3 |
| A | 13 | 248 | 1016204 | 5335.73 | 911 | 891 | 190.3 |
| B | 0 | 190 | 189183 | 992.91 | 946 | 917 | 189.6 |
| B | 0 | 219 | 180653 | 947.92 | 946 | 917 | 189.6 |
| B | 4 | 170 | 158922 | 833.31 | 946 | 917 | 189.6 |
| C | 14 | 254 | 709509 | 3198.28 | 927 | 932 | 221.5 |
| C | 14 | 96 | 88273 | 394.23 | 927 | 932 | 221.5 |
| C | 15 | 208 | 61220 | 272.12 | 927 | 932 | 221.5 |
| D | 13 | 249 | 1091720 | 4781.73 | 906 | 878 | 228.1 |
| D | 5 | 235 | 638147 | 2793.48 | 906 | 878 | 228.1 |
| D | 13 | 171 | 216320 | 944.39 | 906 | 878 | 228.1 |
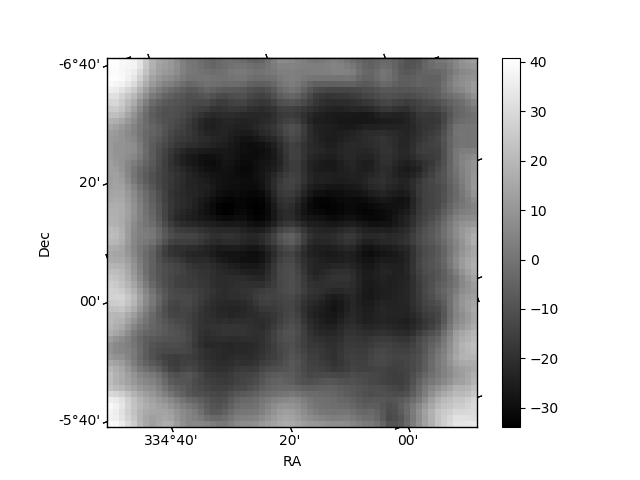
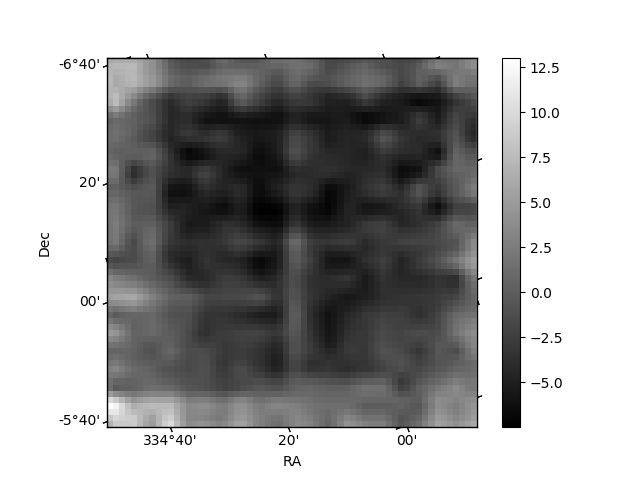
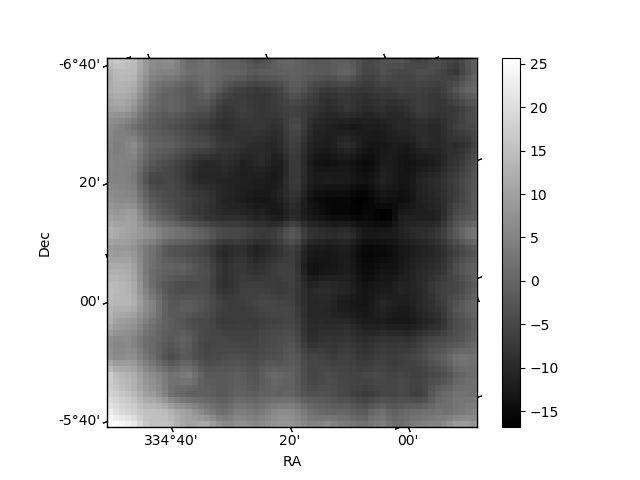
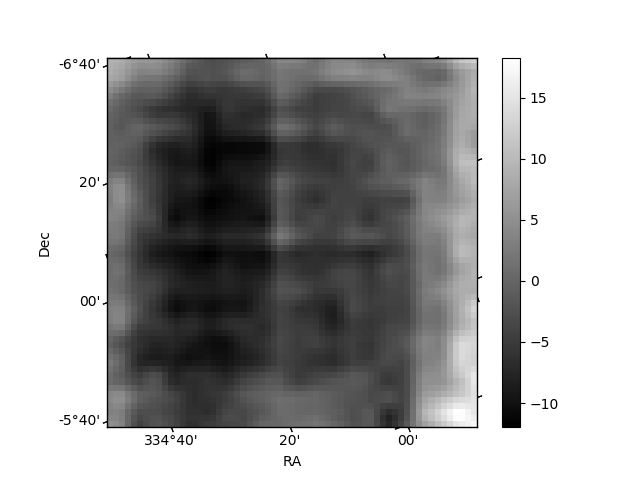
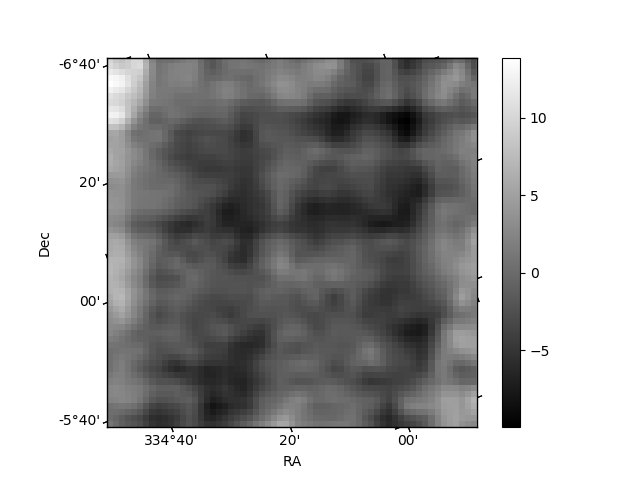
Histogram calculated using DETX and DETY for each event in the final _common_clean file
| Quadrant A | 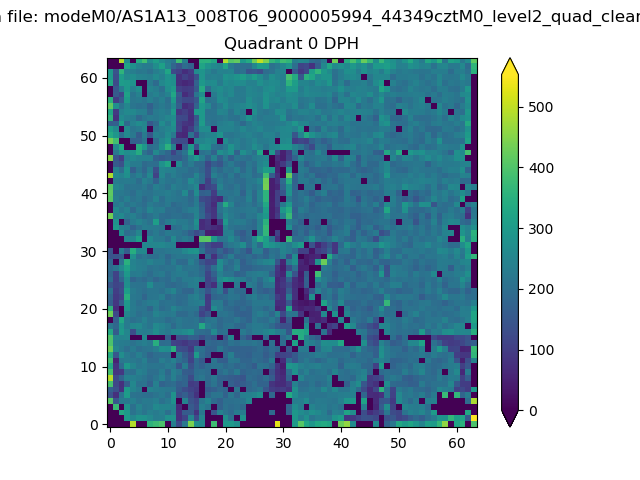 |
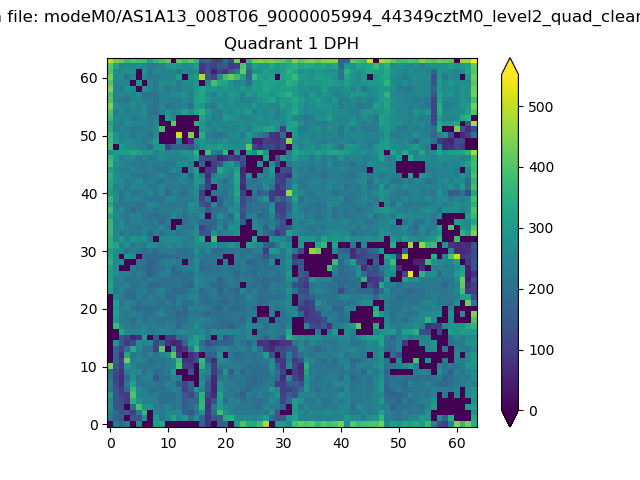 |
Quadrant B |
|---|---|---|---|
| Quadrant D | 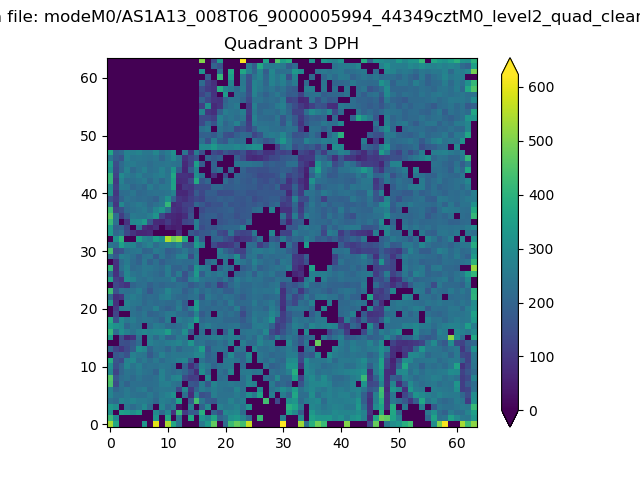 |
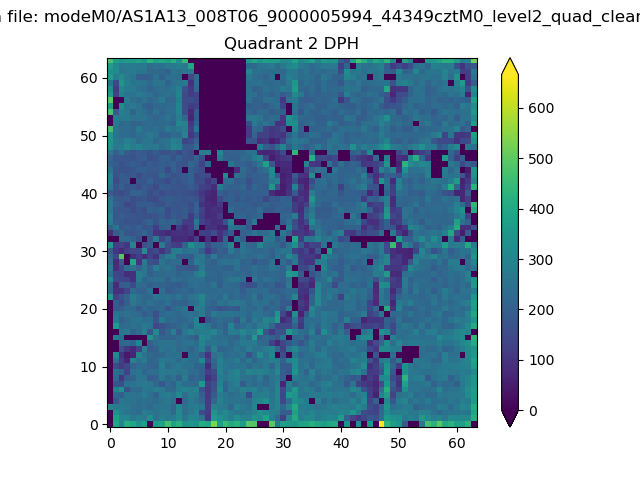 |
Quadrant C |
| Plot type | Count rate plots | Images |
|---|---|---|
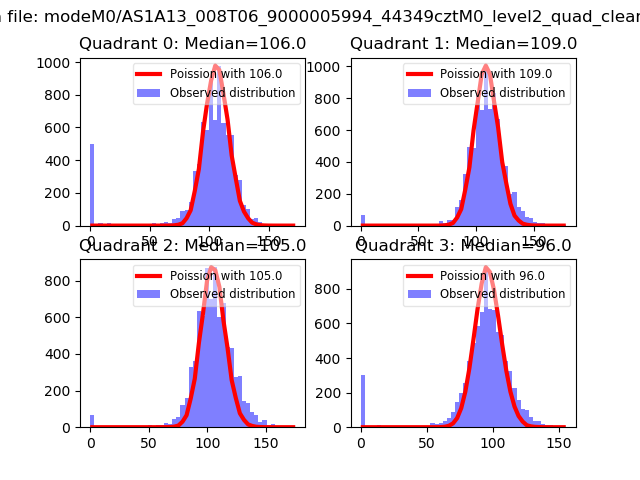
| Comparison with Poisson distribution Blue bars denote a histogram of data divided into 1 sec bins. Red curve is a Poisson curve with rate = median count rate of data. |
 |
 |
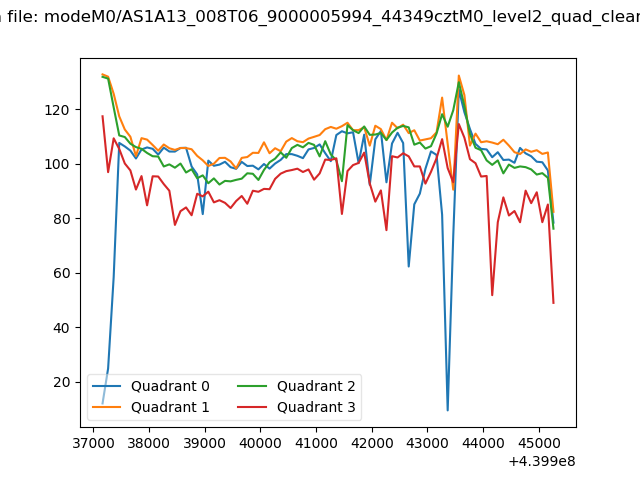
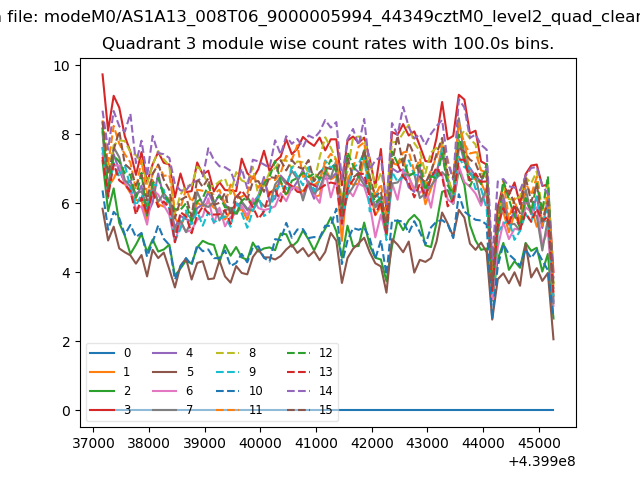
| Quadrant-wise count rates Data is divided into 100 sec bins |
 |
|
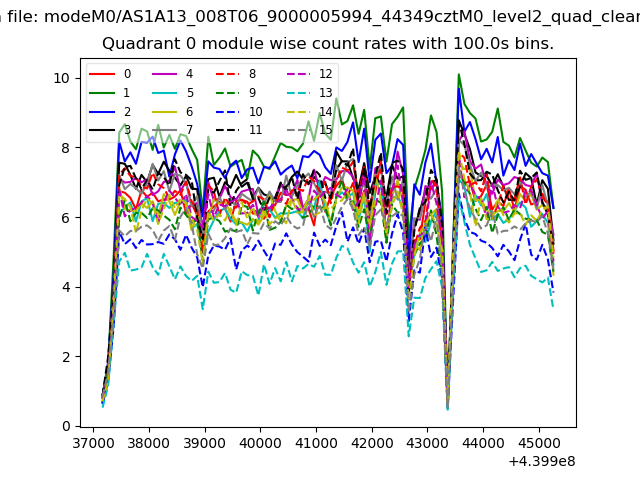
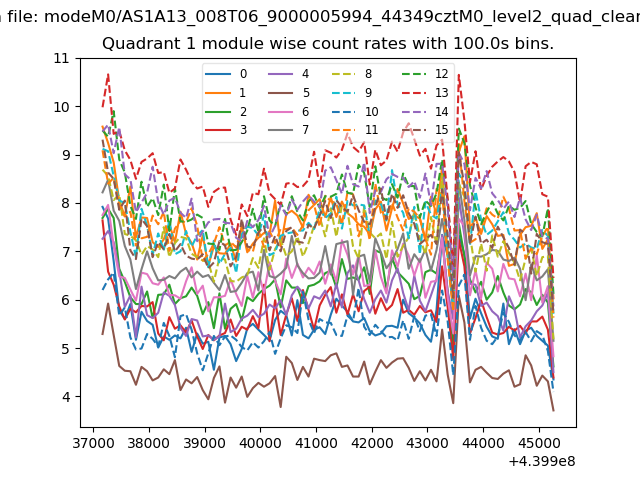
| Module-wise count rates for Quadrant A Data is divided into 100 sec bins |
 |
 |
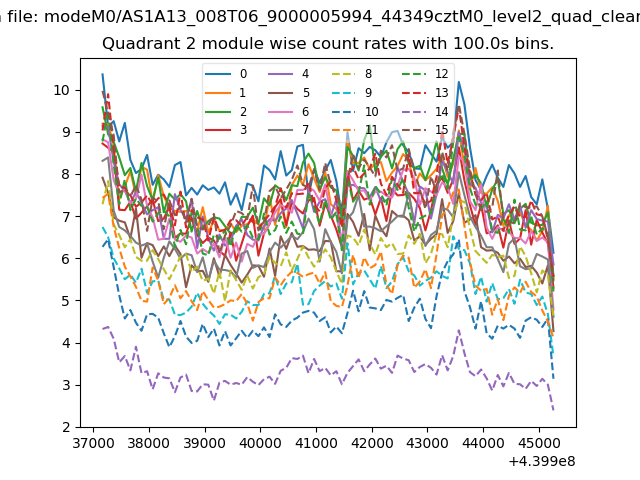
| Module-wise count rates for Quadrant B Data is divided into 100 sec bins |
 |
 |
| Module-wise count rates for Quadrant C Data is divided into 100 sec bins |
 |
 |
| Module-wise count rates for Quadrant D Data is divided into 100 sec bins |
 |
 |
| Parameter | Plot |
|---|---|
| CZT HV Monitor | 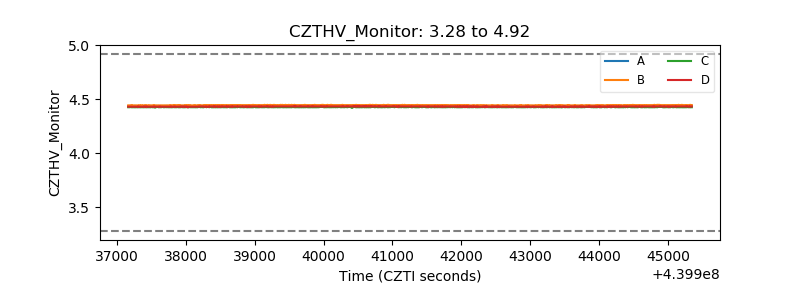 |
| D_VDD | 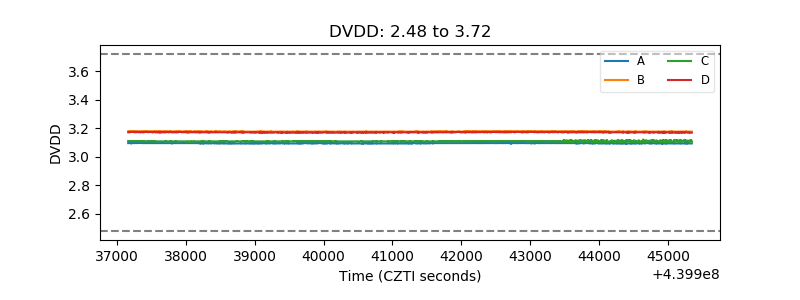 |
| Temperature 1 | 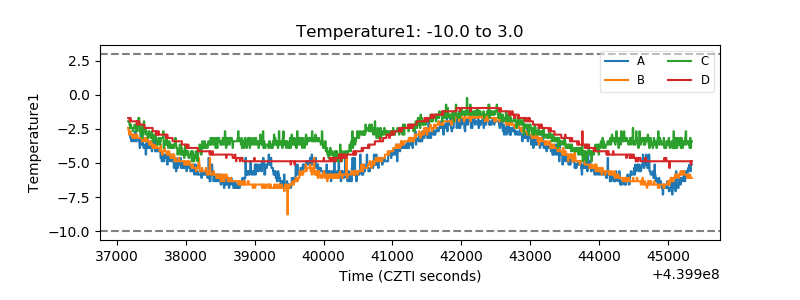 |
| Veto HV Monitor | 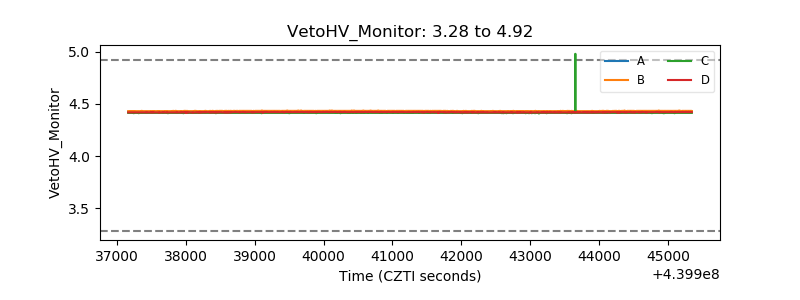 |
| Veto LLD | 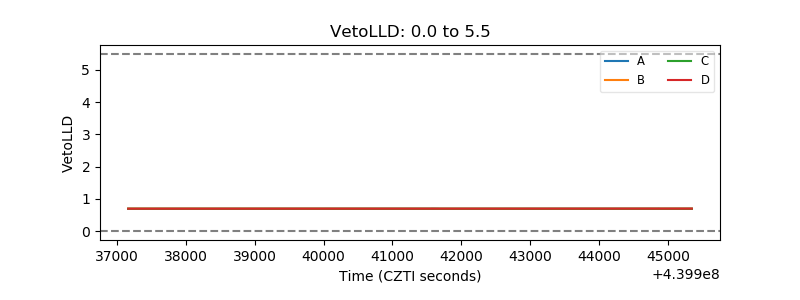 |
| Alpha Counter | 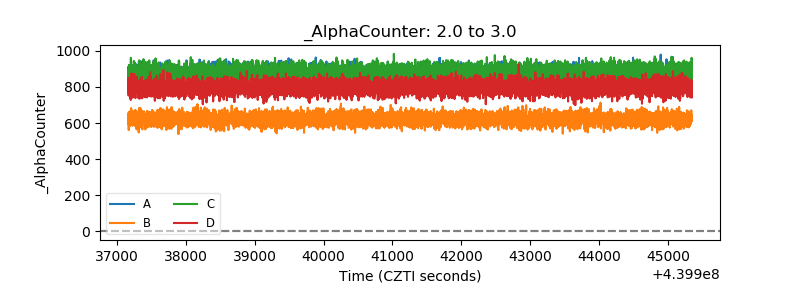 |
| _CPM_Rate | 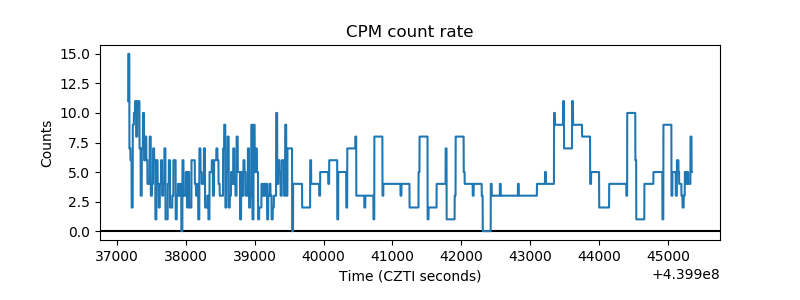 |
| CZT Counter | 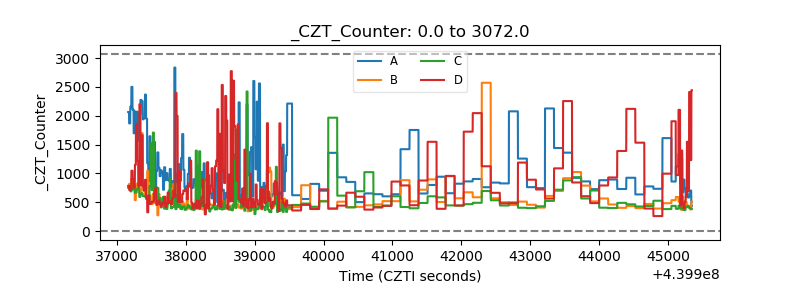 |
| +2.5 Volts monitor | 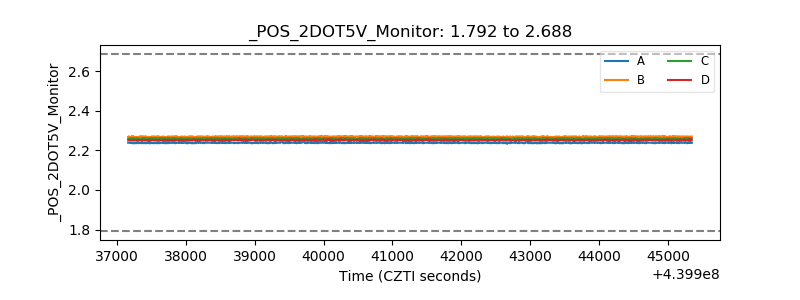 |
| +5 Volts monitor | 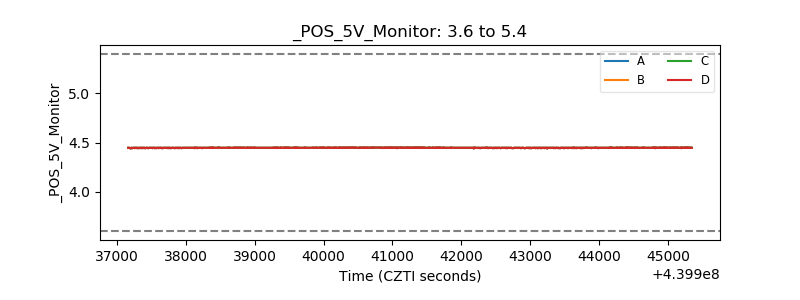 |
| _ROLL_ROT | 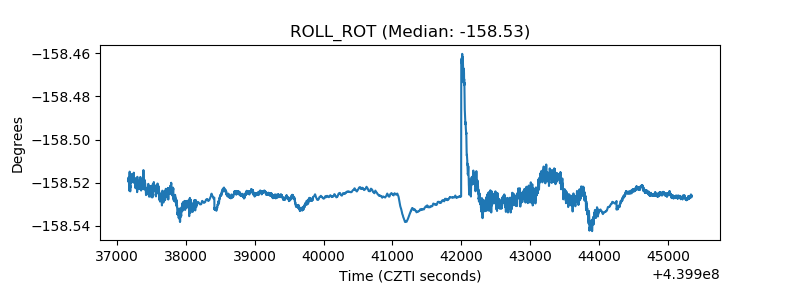 |
| _Roll_DEC | 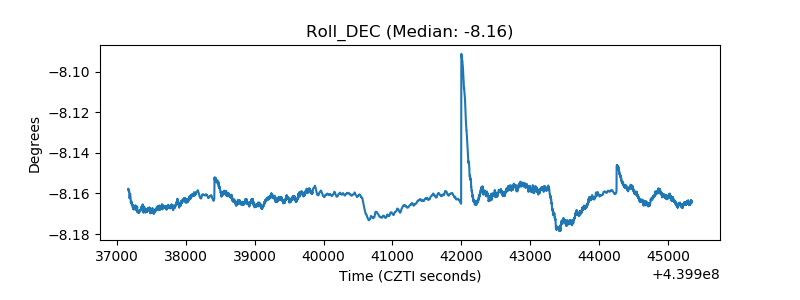 |
| _Roll_RA | 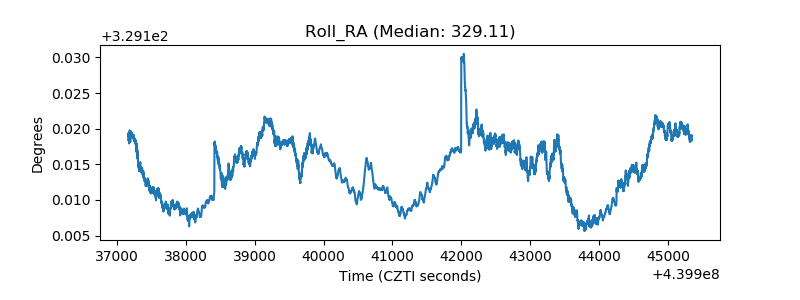 |
| Veto Counter | 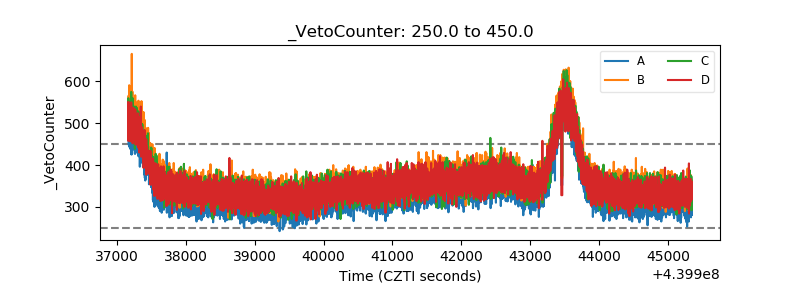 |