| Param | Original file | Final file |
|---|---|---|
| Filename | modeM0/AS1A13_008T06_9000005994_44352cztM0_level2.fits | modeM0/AS1A13_008T06_9000005994_44352cztM0_level2_quad_clean.evt |
| Size (bytes) | 1,503,642,240 | 301,659,840 |
| Size | 1.4 GB | 287.7 MB |
| Events in quadrant A | 17,831,610 | 1,947,530 |
| Events in quadrant B | 11,031,279 | 2,071,996 |
| Events in quadrant C | 10,557,495 | 2,024,096 |
| Events in quadrant D | 14,725,006 | 1,738,956 |
| Mode M9 | |||
|---|---|---|---|
| Quadrant | BADHDUFLAG | Total packets | Discarded packets |
| A | 0 | 16 | 0 |
| B | 0 | 16 | 0 |
| C | 0 | 16 | 0 |
| D | 0 | 16 | 0 |
| Mode SS | |||
|---|---|---|---|
| Quadrant | BADHDUFLAG | Total packets | Discarded packets |
| A | 0 | 400 | 0 |
| B | 0 | 400 | 0 |
| C | 0 | 400 | 0 |
| D | 0 | 400 | 0 |
| Mode M0 | |||
|---|---|---|---|
| Quadrant | BADHDUFLAG | Total packets | Discarded packets |
| A | 0 | 68388 | 10 |
| B | 0 | 45558 | 4 |
| C | 0 | 45213 | 4 |
| D | 0 | 57026 | 4 |
| Quadrant | Total seconds | Saturated seconds | Saturation percentage |
|---|---|---|---|
| A | 19603 | 1442 | 7.356017% |
| B | 19603 | 705 | 3.596388% |
| C | 19604 | 452 | 2.305652% |
| D | 19604 | 1643 | 8.380943% |
Noise dominated data is calculated using 1-second bins in cleaned event files. If a bin has >2000 counts, and if more than 50% of those come from <1% of pixels, then it is considered to be noise-dominated and hence unusable.
| Quadrant | # 1 sec bins | Bins with >0 counts | Bins with >2000 counts | High rate bins dominated by noise | Noise dominated (total time) | Noise dominated (detector-on time) | Marked lightcurve |
|---|---|---|---|---|---|---|---|
| A | 21062 | 19603 | 728 | 728 | 3.46% | 3.71% | 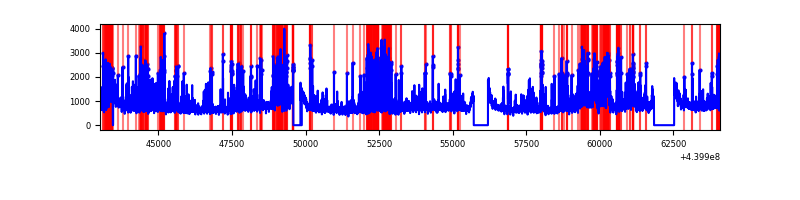 |
| B | 21063 | 19604 | 177 | 177 | 0.84% | 0.90% | 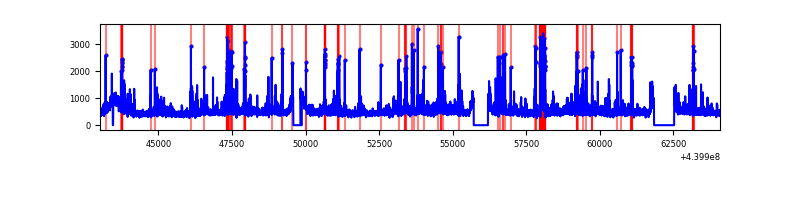 |
| C | 21064 | 19607 | 221 | 221 | 1.05% | 1.13% | 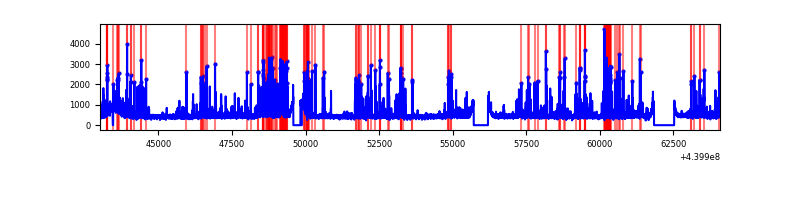 |
| D | 21064 | 19606 | 1254 | 1254 | 5.95% | 6.40% | 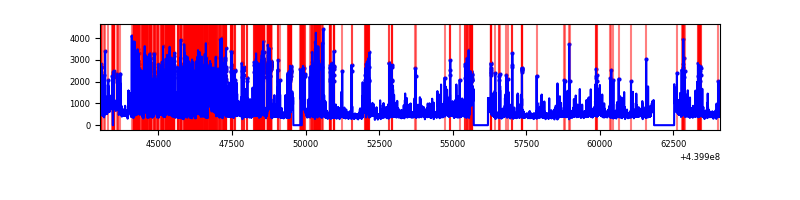 |
Top three noisy pixels from each quadrant. If the there are fewer than three noisy pixels in the level2.evt file, extra rows are filled as -1
| Pixel properties | Quadrant properties | ||||||
|---|---|---|---|---|---|---|---|
| Quadrant | DetID | PixID | Counts | Sigma | Mean | Median | Sigma |
| A | 10 | 83 | 4402625 | 9500.18 | 2224 | 2176 | 463.2 |
| A | 15 | 223 | 2825847 | 6096.06 | 2224 | 2176 | 463.2 |
| A | 13 | 248 | 1719643 | 3707.86 | 2224 | 2176 | 463.2 |
| B | 0 | 219 | 476710 | 1053.04 | 2255 | 2185 | 450.6 |
| B | 5 | 255 | 275139 | 605.73 | 2255 | 2185 | 450.6 |
| B | 0 | 190 | 251416 | 553.08 | 2255 | 2185 | 450.6 |
| C | 14 | 254 | 1219776 | 2280.33 | 2227 | 2242 | 533.9 |
| C | 15 | 158 | 397581 | 740.43 | 2227 | 2242 | 533.9 |
| C | 15 | 208 | 75162 | 136.57 | 2227 | 2242 | 533.9 |
| D | 13 | 249 | 2943679 | 5443.24 | 2153 | 2092 | 540.4 |
| D | 1 | 52 | 790331 | 1458.59 | 2153 | 2092 | 540.4 |
| D | 5 | 235 | 513958 | 947.18 | 2153 | 2092 | 540.4 |
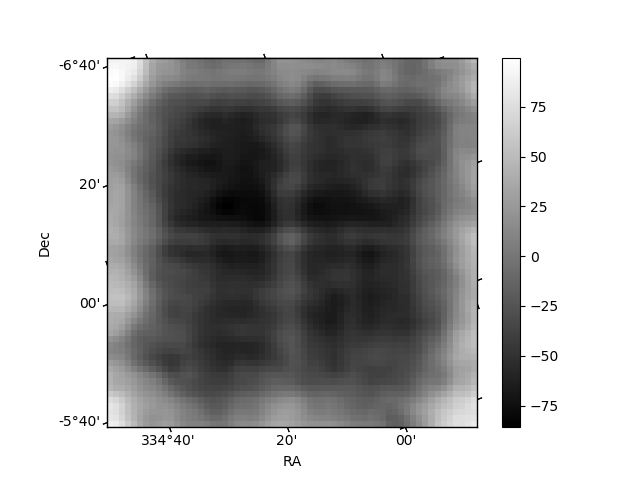
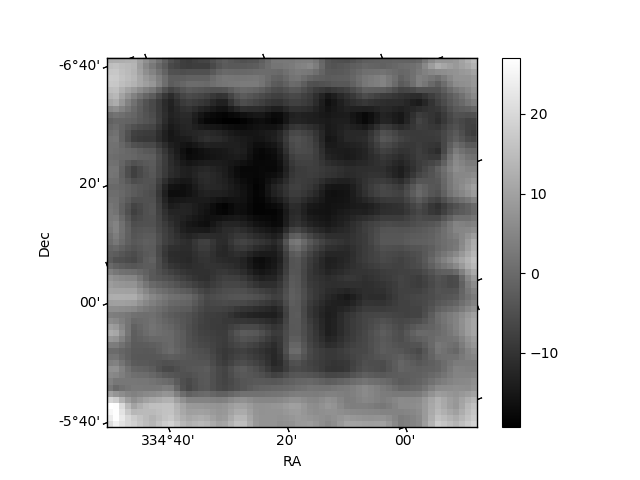
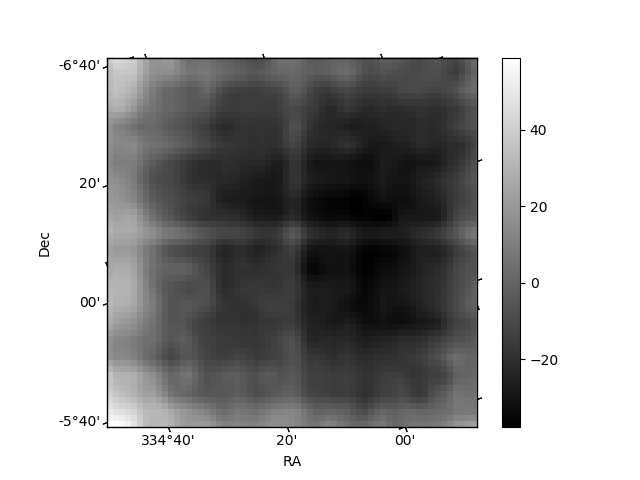
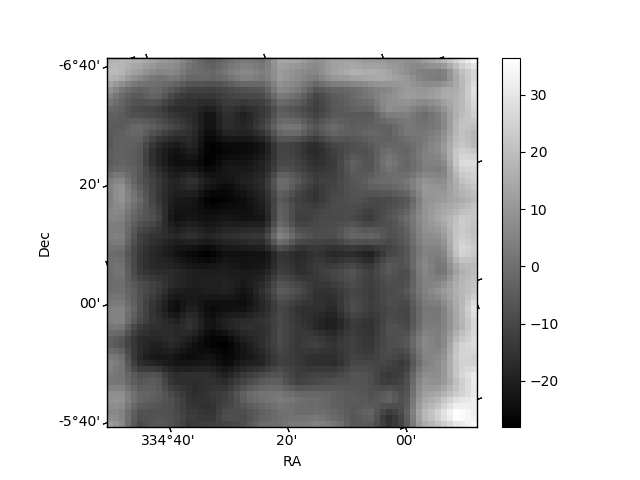
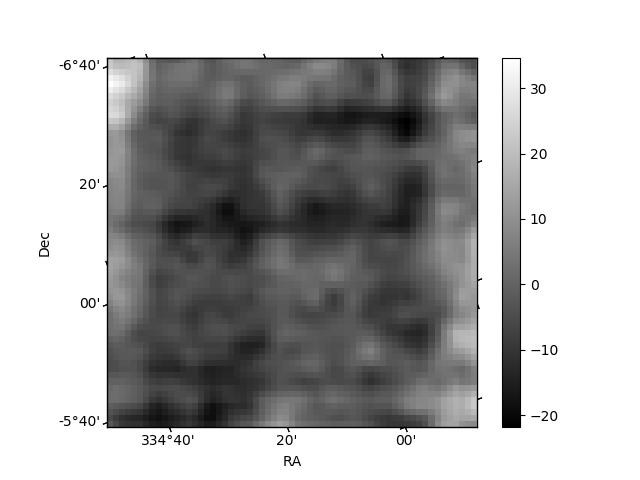
Histogram calculated using DETX and DETY for each event in the final _common_clean file
| Quadrant A | 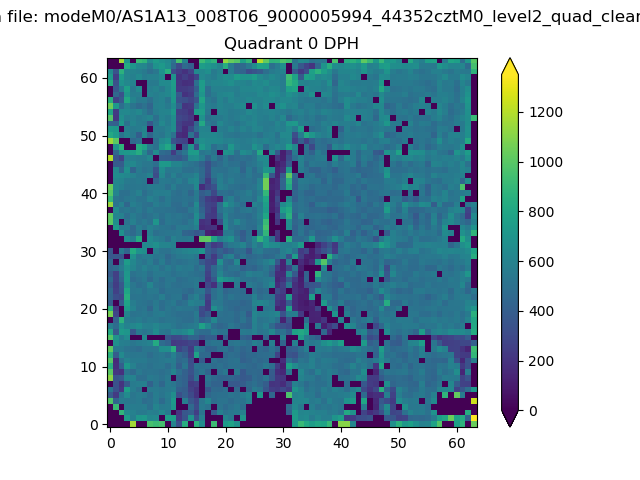 |
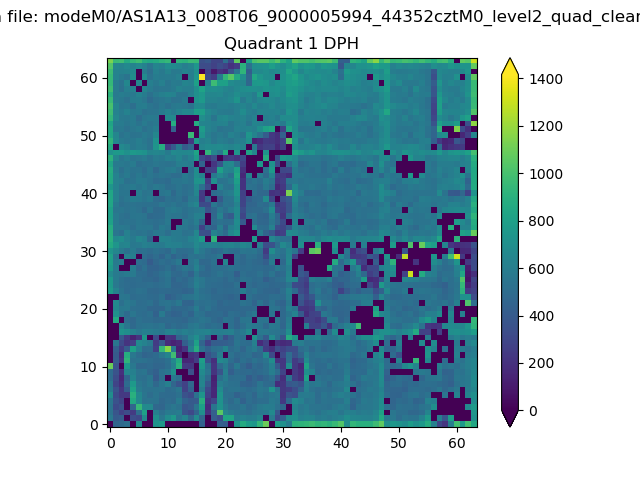 |
Quadrant B |
|---|---|---|---|
| Quadrant D | 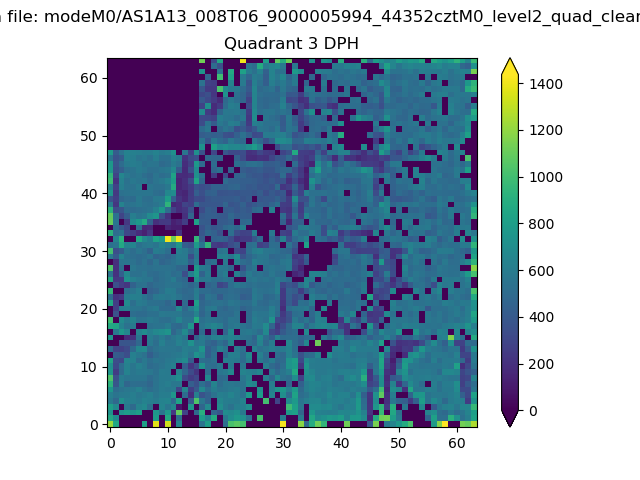 |
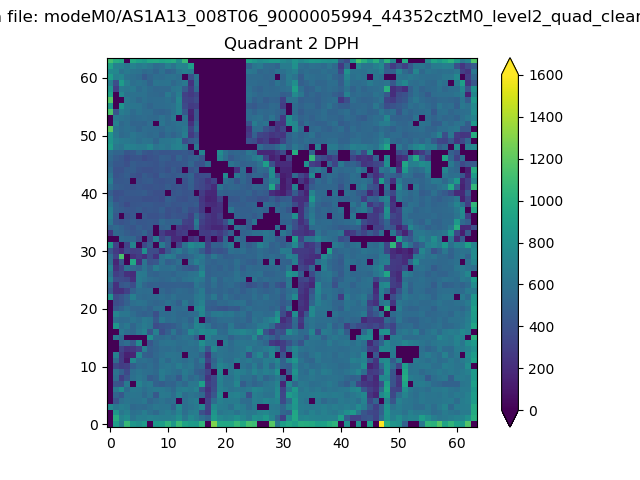 |
Quadrant C |
| Plot type | Count rate plots | Images |
|---|---|---|
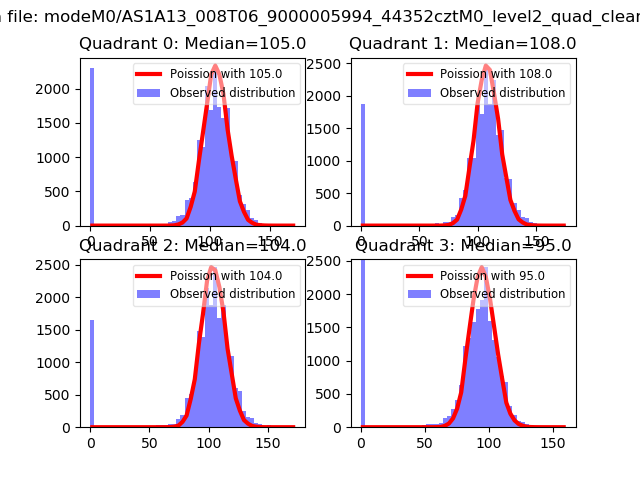
| Comparison with Poisson distribution Blue bars denote a histogram of data divided into 1 sec bins. Red curve is a Poisson curve with rate = median count rate of data. |
 |
 |
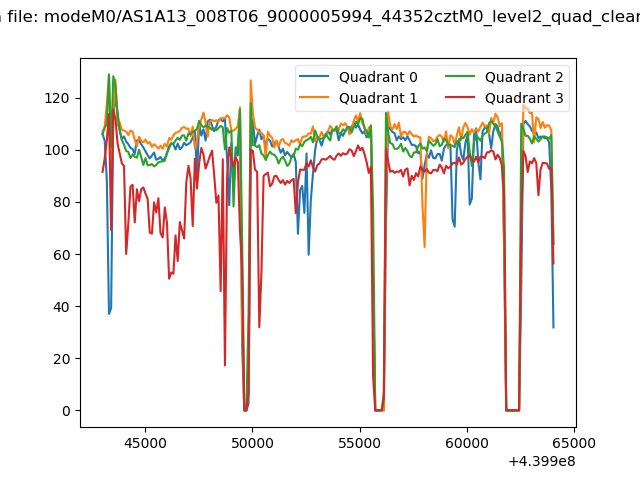
| Quadrant-wise count rates Data is divided into 100 sec bins |
 |
|
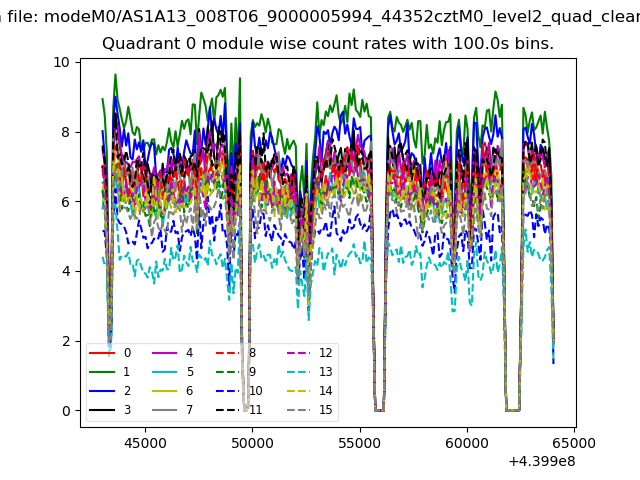
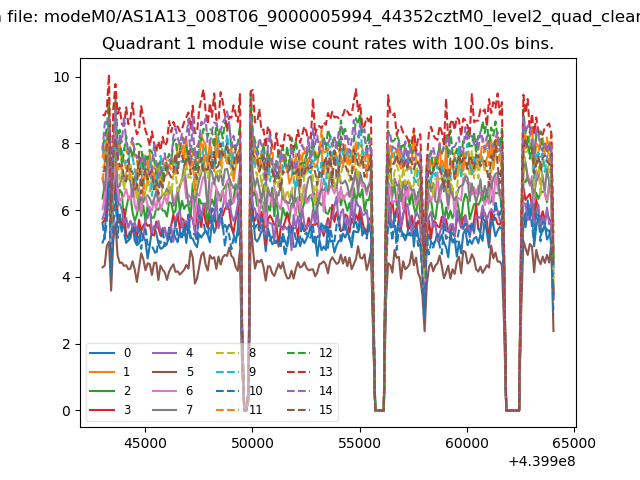
| Module-wise count rates for Quadrant A Data is divided into 100 sec bins |
 |
 |
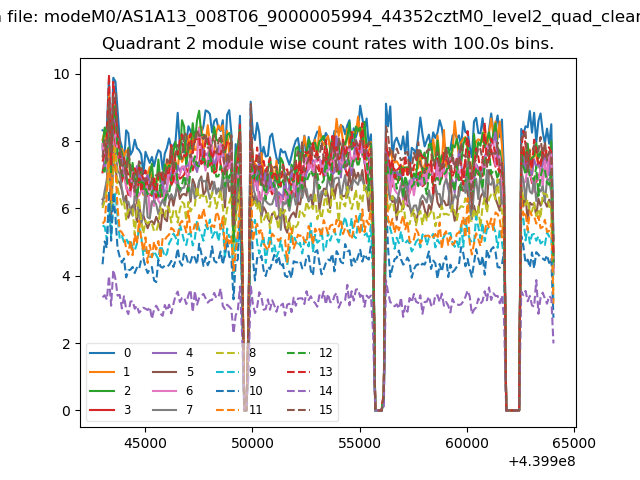
| Module-wise count rates for Quadrant B Data is divided into 100 sec bins |
 |
 |
| Module-wise count rates for Quadrant C Data is divided into 100 sec bins |
 |
 |
| Module-wise count rates for Quadrant D Data is divided into 100 sec bins |
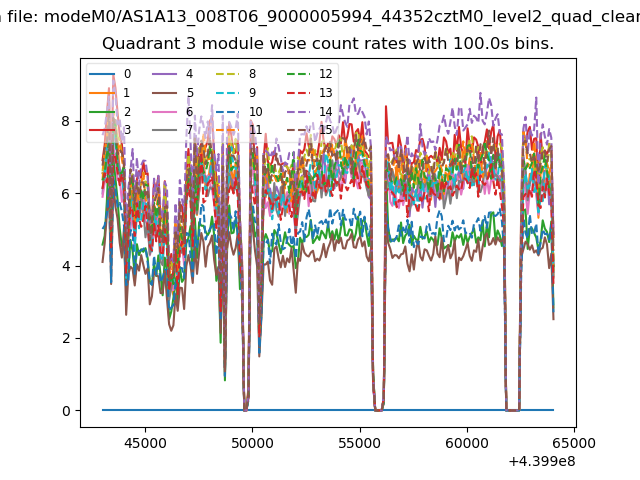 |
 |
| Parameter | Plot |
|---|---|
| CZT HV Monitor | 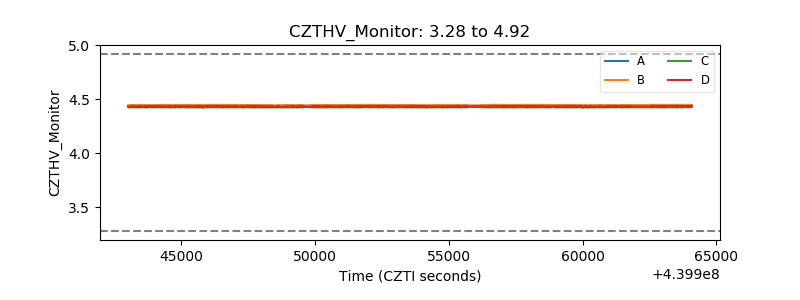 |
| D_VDD | 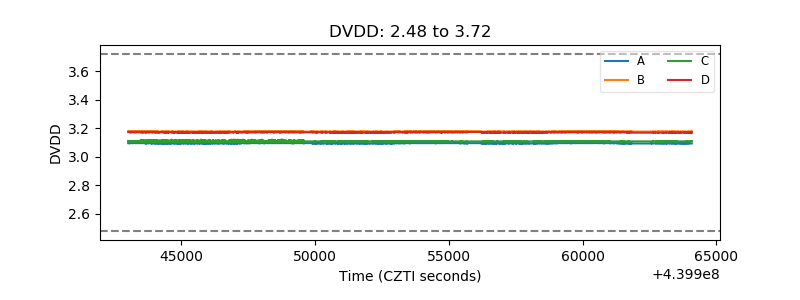 |
| Temperature 1 | 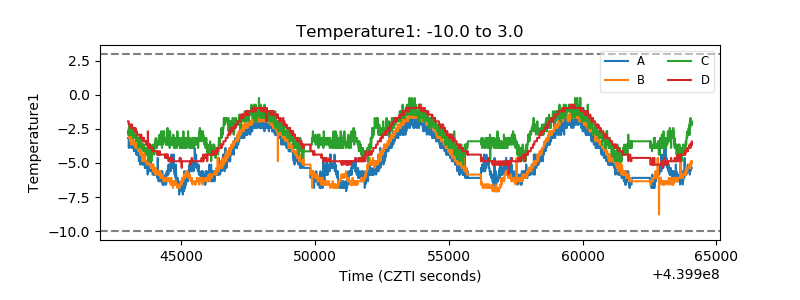 |
| Veto HV Monitor | 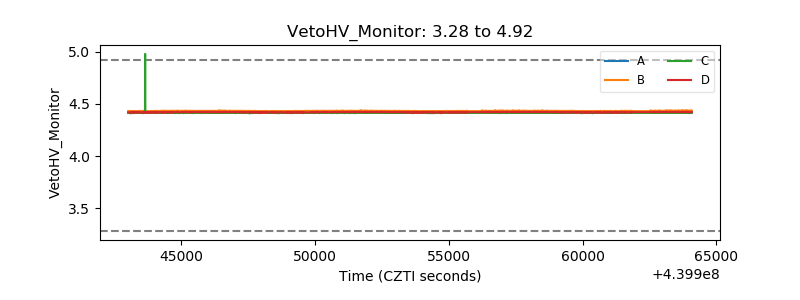 |
| Veto LLD | 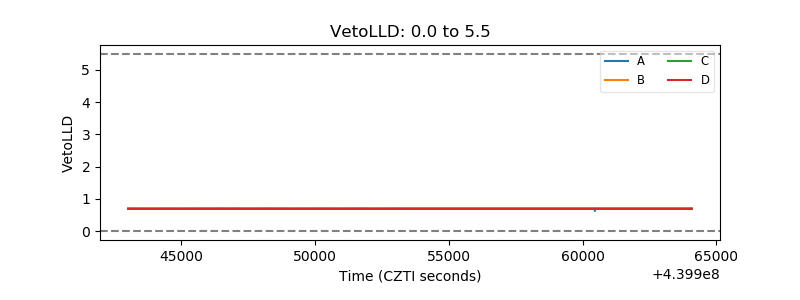 |
| Alpha Counter | 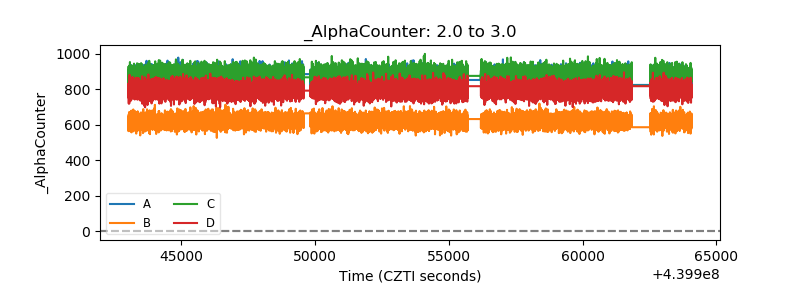 |
| _CPM_Rate | 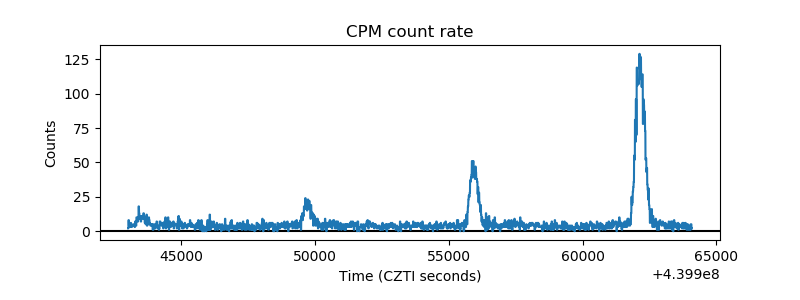 |
| CZT Counter | 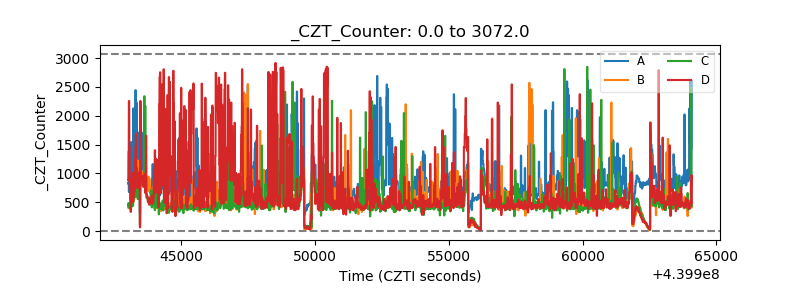 |
| +2.5 Volts monitor | 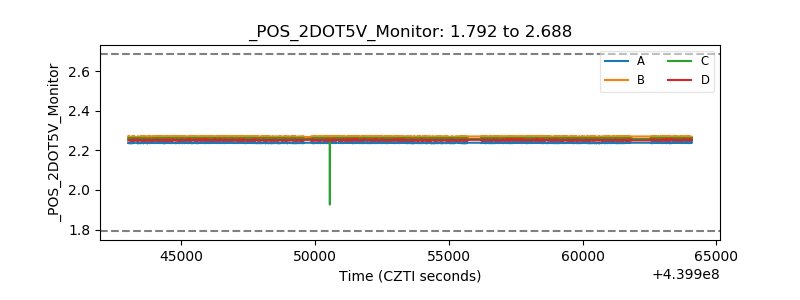 |
| +5 Volts monitor | 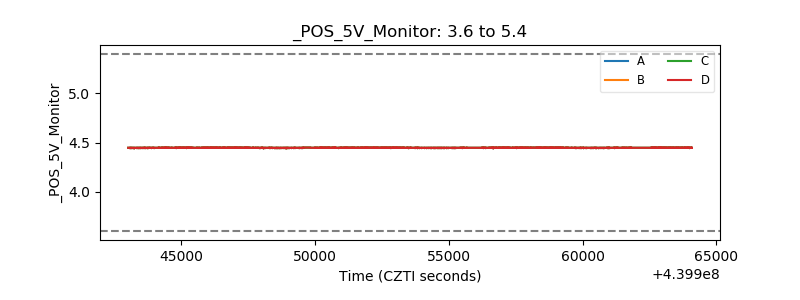 |
| _ROLL_ROT | 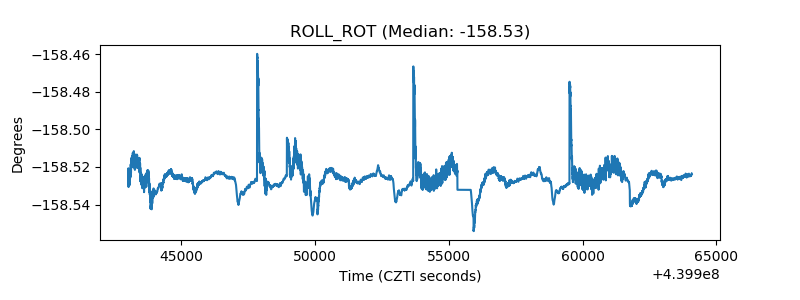 |
| _Roll_DEC | 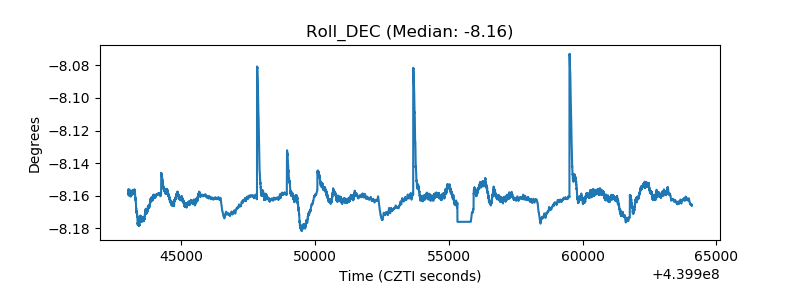 |
| _Roll_RA | 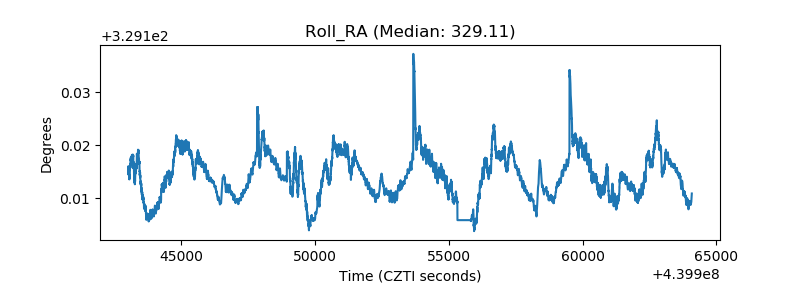 |
| Veto Counter | 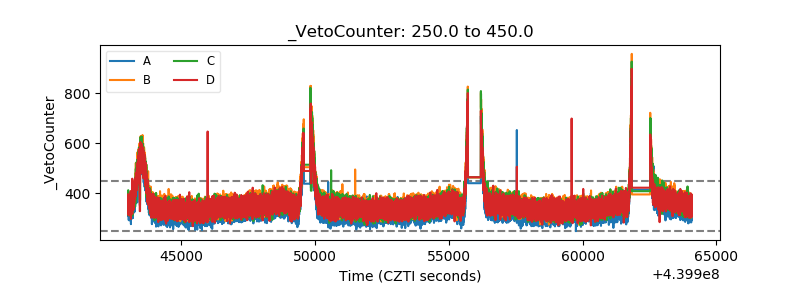 |