| Param | Original file | Final file |
|---|---|---|
| Filename | modeM0/AS1A13_008T06_9000005994_44353cztM0_level2.fits | modeM0/AS1A13_008T06_9000005994_44353cztM0_level2_quad_clean.evt |
| Size (bytes) | 627,966,720 | 104,299,200 |
| Size | 598.9 MB | 99.5 MB |
| Events in quadrant A | 10,613,587 | 533,884 |
| Events in quadrant B | 3,891,222 | 755,900 |
| Events in quadrant C | 3,476,374 | 732,589 |
| Events in quadrant D | 4,730,743 | 655,619 |
| Mode M9 | |||
|---|---|---|---|
| Quadrant | BADHDUFLAG | Total packets | Discarded packets |
| A | 0 | 8 | 0 |
| B | 0 | 8 | 0 |
| C | 0 | 8 | 0 |
| D | 0 | 8 | 0 |
| Mode SS | |||
|---|---|---|---|
| Quadrant | BADHDUFLAG | Total packets | Discarded packets |
| A | 0 | 142 | 0 |
| B | 0 | 142 | 0 |
| C | 0 | 142 | 0 |
| D | 0 | 142 | 0 |
| Mode M0 | |||
|---|---|---|---|
| Quadrant | BADHDUFLAG | Total packets | Discarded packets |
| A | 0 | 36310 | 1 |
| B | 0 | 15890 | 2 |
| C | 0 | 14969 | 2 |
| D | 0 | 18595 | 2 |
| Quadrant | Total seconds | Saturated seconds | Saturation percentage |
|---|---|---|---|
| A | 6874 | 2334 | 33.954030% |
| B | 6875 | 195 | 2.836364% |
| C | 6875 | 88 | 1.280000% |
| D | 6875 | 296 | 4.305455% |
Noise dominated data is calculated using 1-second bins in cleaned event files. If a bin has >2000 counts, and if more than 50% of those come from <1% of pixels, then it is considered to be noise-dominated and hence unusable.
| Quadrant | # 1 sec bins | Bins with >0 counts | Bins with >2000 counts | High rate bins dominated by noise | Noise dominated (total time) | Noise dominated (detector-on time) | Marked lightcurve |
|---|---|---|---|---|---|---|---|
| A | 7759 | 6874 | 2045 | 2045 | 26.36% | 29.75% | 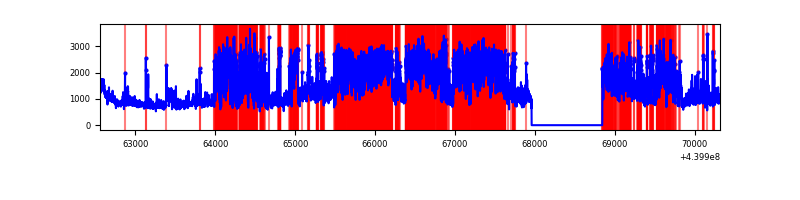 |
| B | 7760 | 6875 | 83 | 83 | 1.07% | 1.21% | 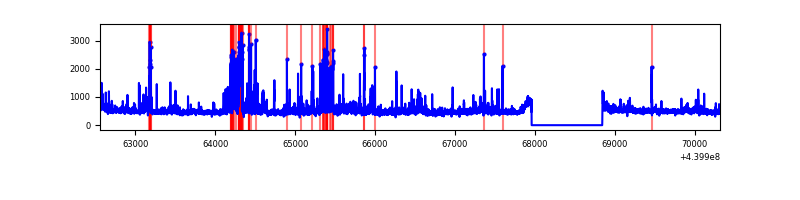 |
| C | 7760 | 6875 | 38 | 38 | 0.49% | 0.55% | 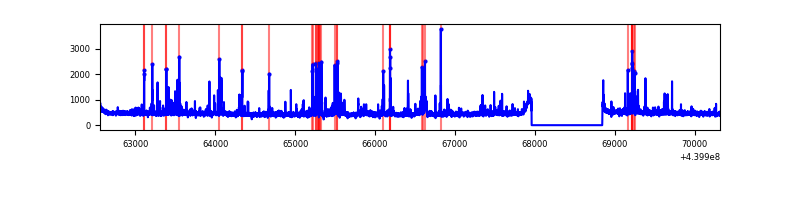 |
| D | 7760 | 6875 | 231 | 231 | 2.98% | 3.36% | 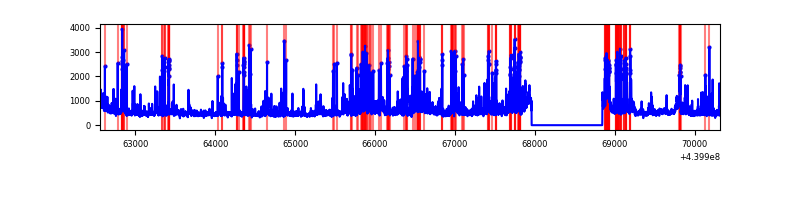 |
Top three noisy pixels from each quadrant. If the there are fewer than three noisy pixels in the level2.evt file, extra rows are filled as -1
| Pixel properties | Quadrant properties | ||||||
|---|---|---|---|---|---|---|---|
| Quadrant | DetID | PixID | Counts | Sigma | Mean | Median | Sigma |
| A | 15 | 223 | 4945368 | 33340.99 | 715 | 700 | 148.3 |
| A | 10 | 83 | 1570159 | 10582.57 | 715 | 700 | 148.3 |
| A | 13 | 248 | 1259940 | 8490.82 | 715 | 700 | 148.3 |
| B | 5 | 255 | 303102 | 1945.07 | 784 | 762 | 155.4 |
| B | 5 | 172 | 173196 | 1109.33 | 784 | 762 | 155.4 |
| B | 4 | 170 | 80987 | 516.12 | 784 | 762 | 155.4 |
| C | 14 | 254 | 299031 | 1617.24 | 774 | 780 | 184.4 |
| C | 3 | 233 | 51729 | 276.27 | 774 | 780 | 184.4 |
| C | 14 | 220 | 39751 | 211.32 | 774 | 780 | 184.4 |
| D | 13 | 249 | 678195 | 3495.94 | 765 | 741 | 193.8 |
| D | 1 | 52 | 217366 | 1117.87 | 765 | 741 | 193.8 |
| D | 2 | 153 | 195294 | 1003.97 | 765 | 741 | 193.8 |
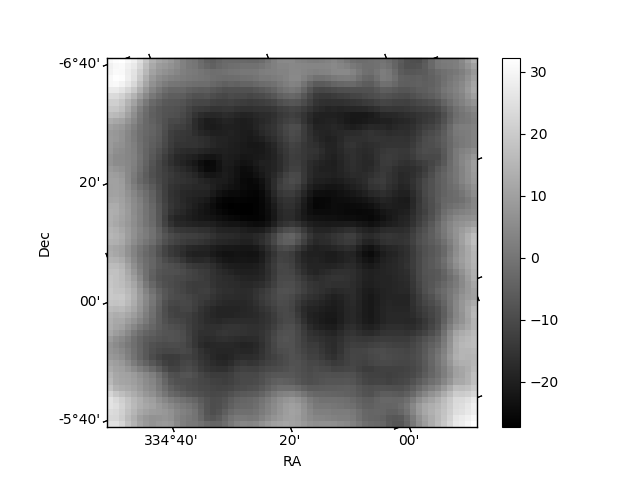
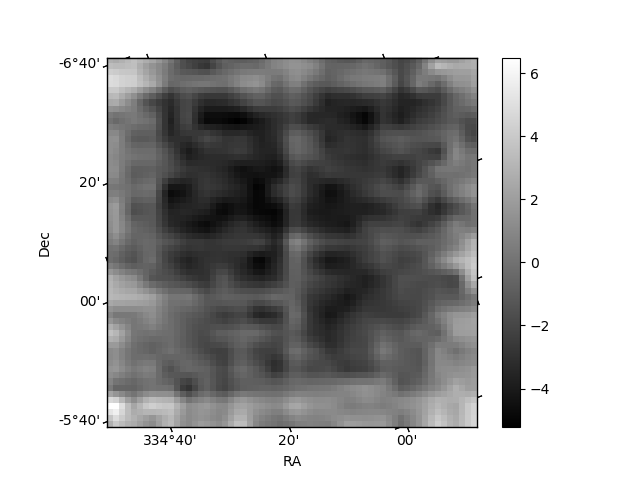
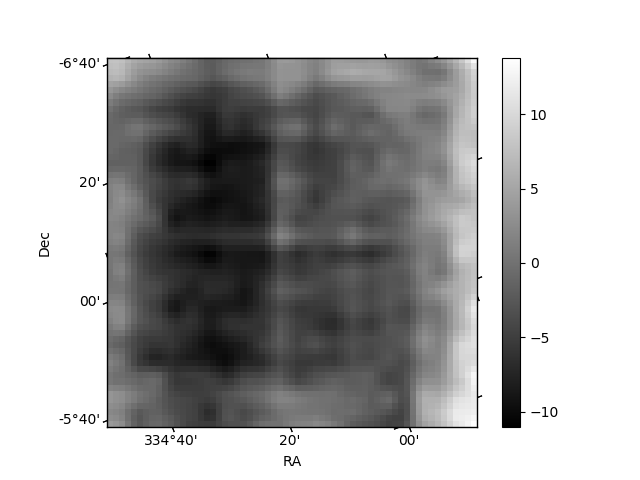
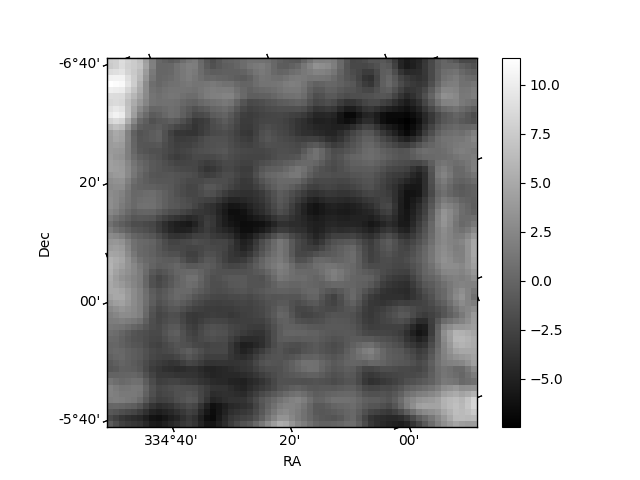
Histogram calculated using DETX and DETY for each event in the final _common_clean file
| Quadrant A | 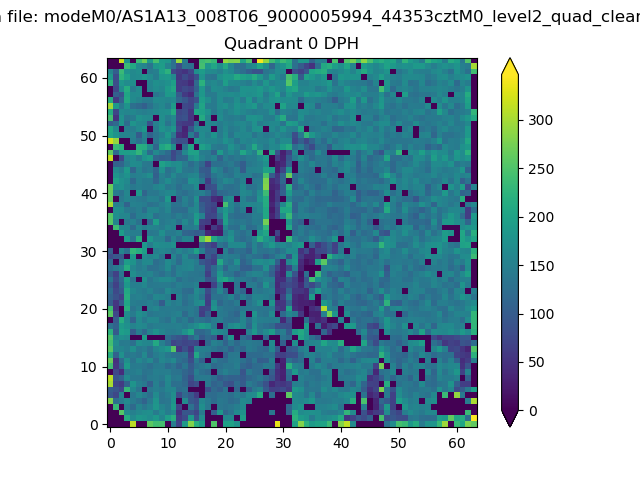 |
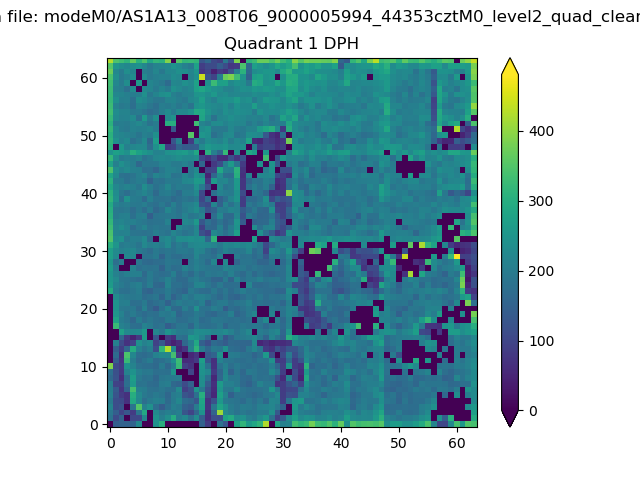 |
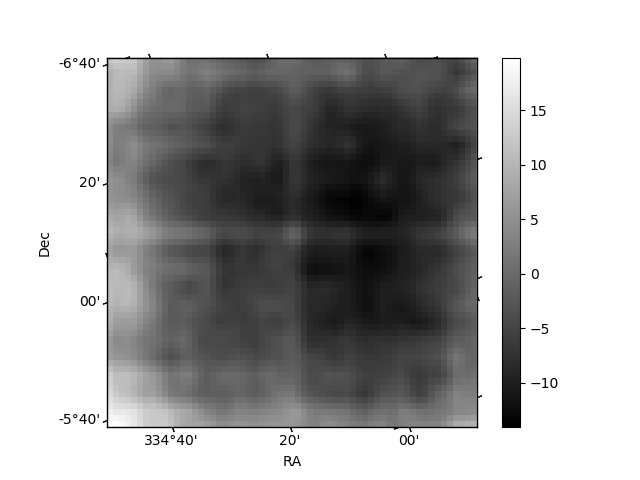
Quadrant B |
|---|---|---|---|
| Quadrant D | 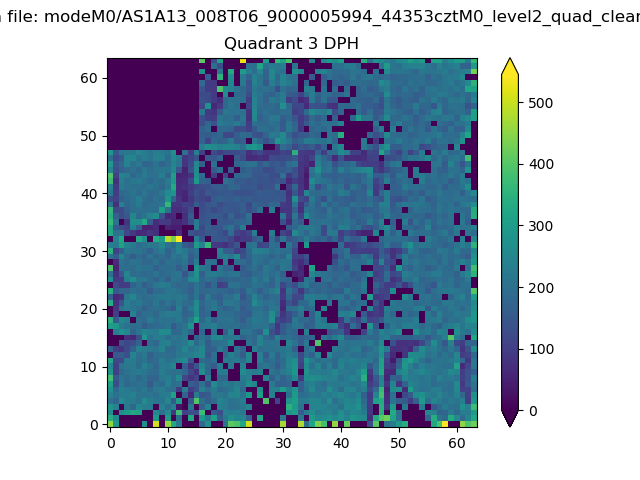 |
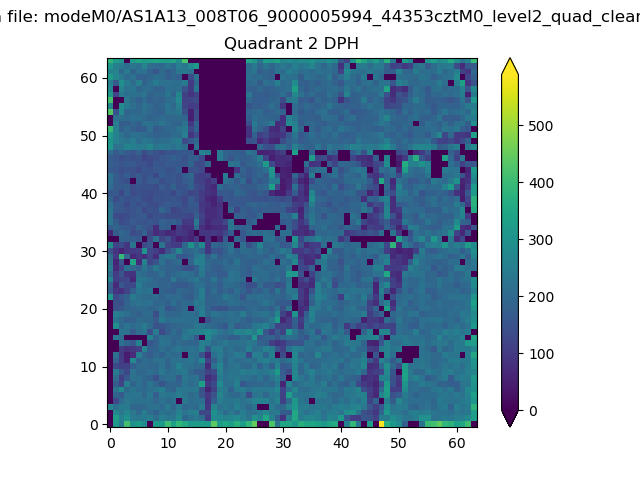 |
Quadrant C |
| Plot type | Count rate plots | Images |
|---|---|---|
| Comparison with Poisson distribution Blue bars denote a histogram of data divided into 1 sec bins. Red curve is a Poisson curve with rate = median count rate of data. |
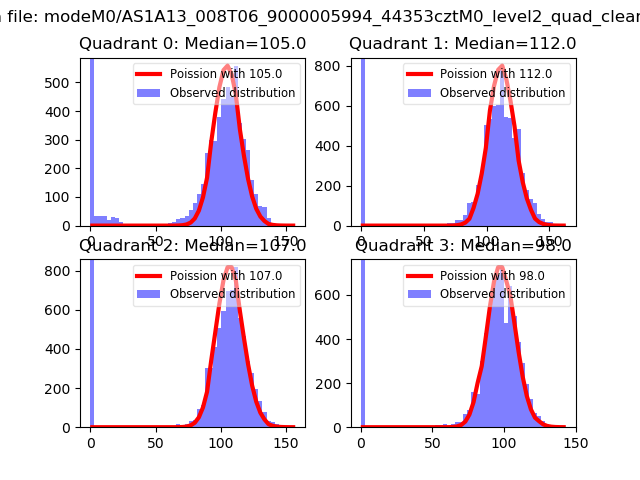 |
 |
| Quadrant-wise count rates Data is divided into 100 sec bins |
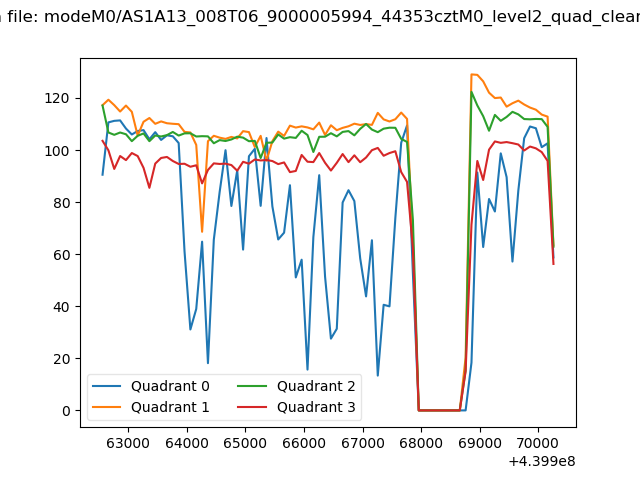 |
|
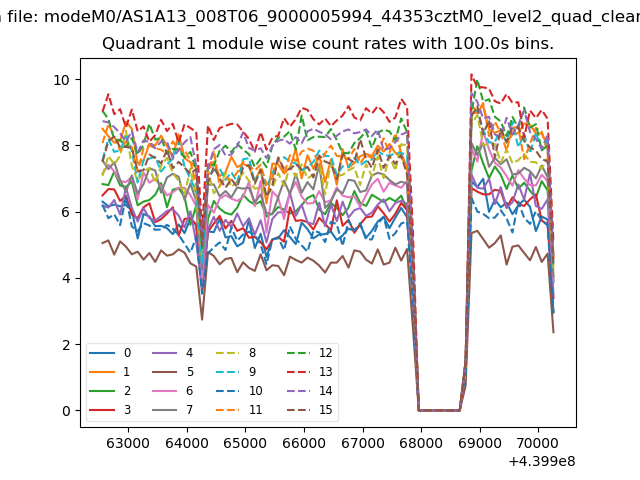
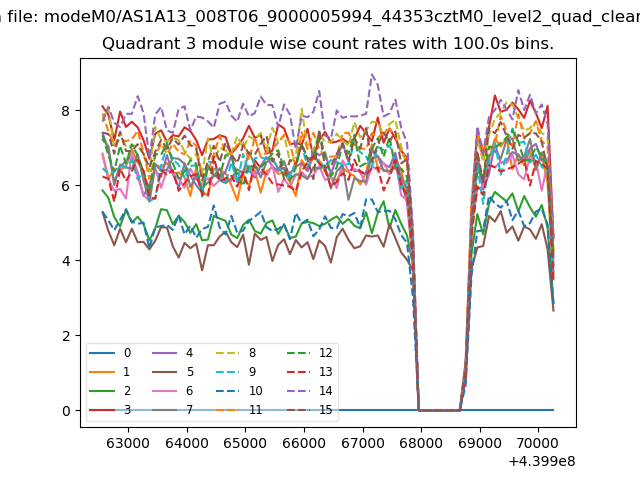
| Module-wise count rates for Quadrant A Data is divided into 100 sec bins |
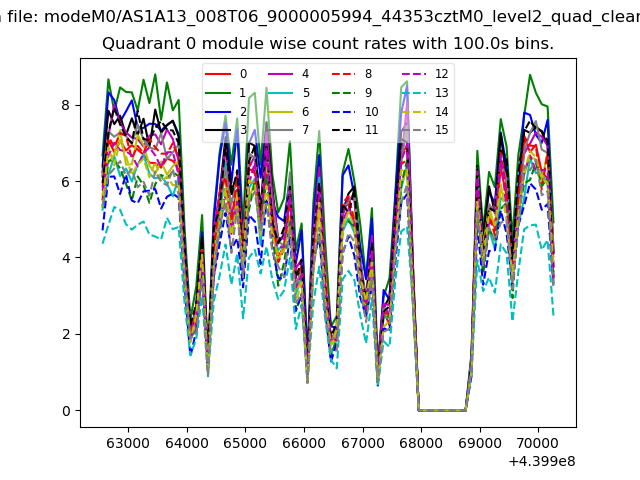 |
 |
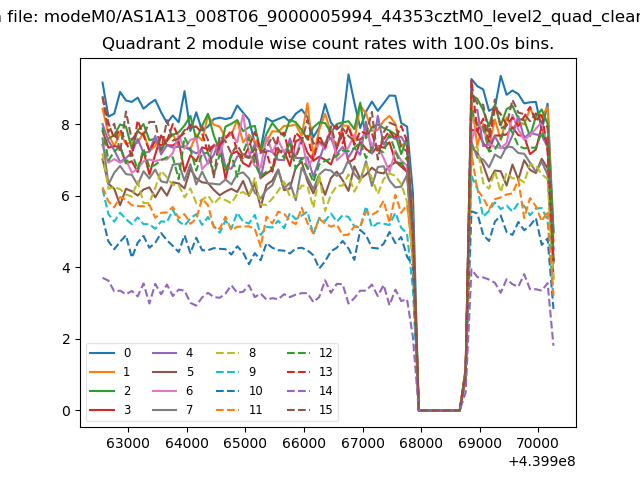
| Module-wise count rates for Quadrant B Data is divided into 100 sec bins |
 |
 |
| Module-wise count rates for Quadrant C Data is divided into 100 sec bins |
 |
 |
| Module-wise count rates for Quadrant D Data is divided into 100 sec bins |
 |
 |
| Parameter | Plot |
|---|---|
| CZT HV Monitor | 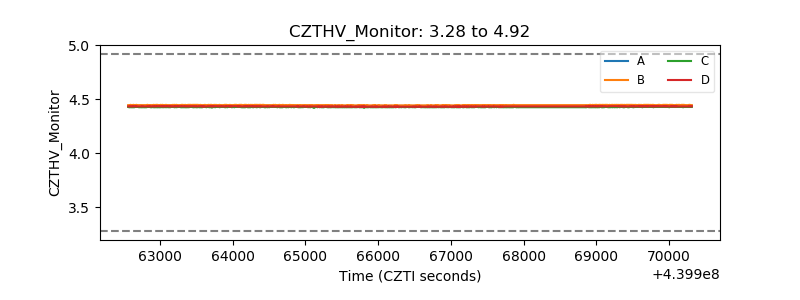 |
| D_VDD | 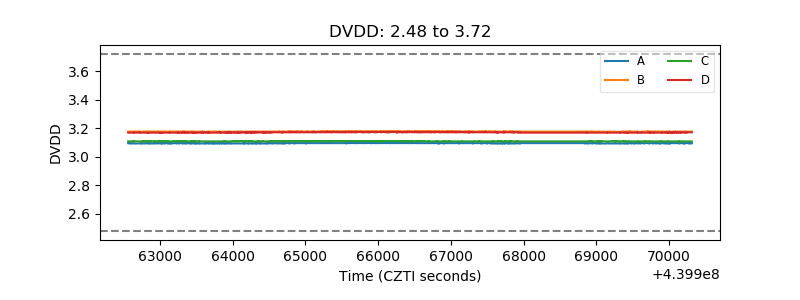 |
| Temperature 1 | 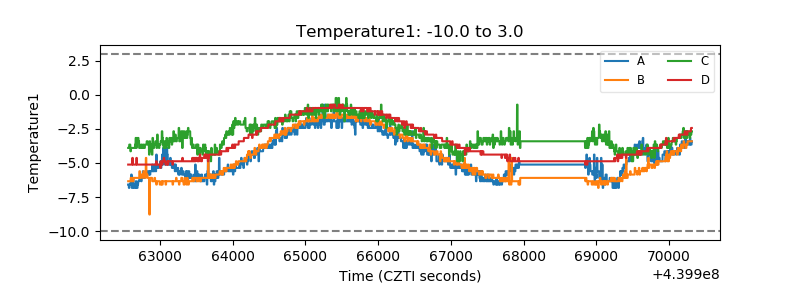 |
| Veto HV Monitor |  |
| Veto LLD | 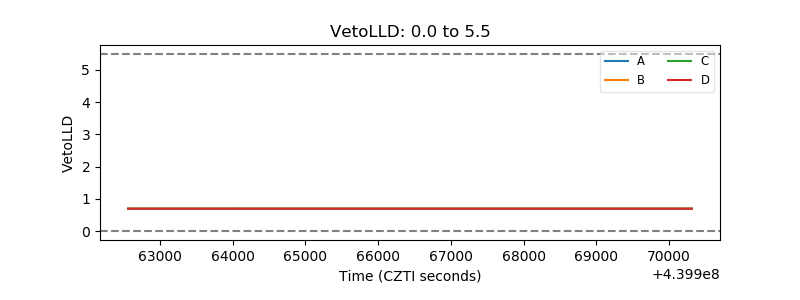 |
| Alpha Counter | 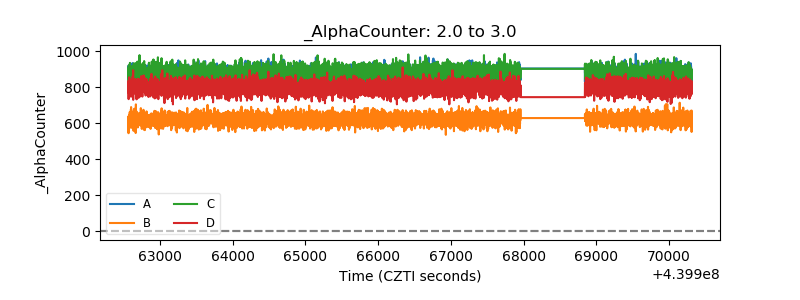 |
| _CPM_Rate | 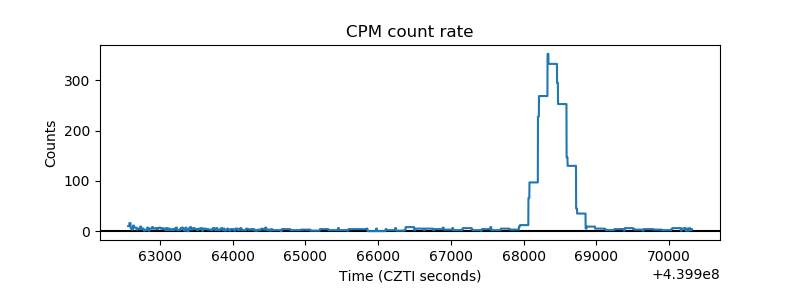 |
| CZT Counter | 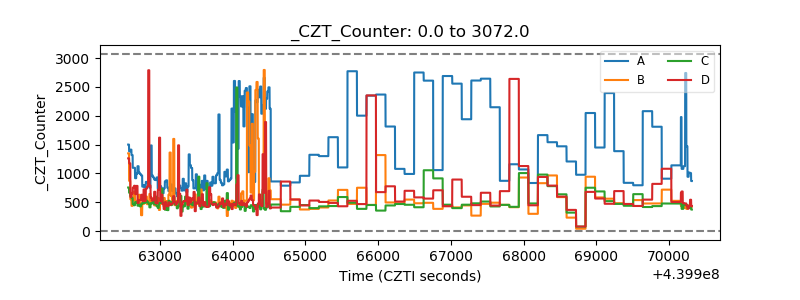 |
| +2.5 Volts monitor | 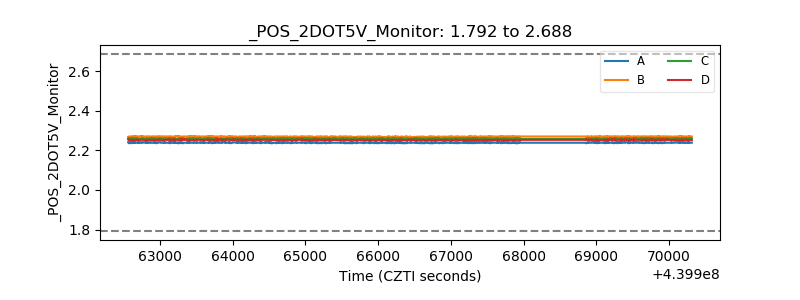 |
| +5 Volts monitor | 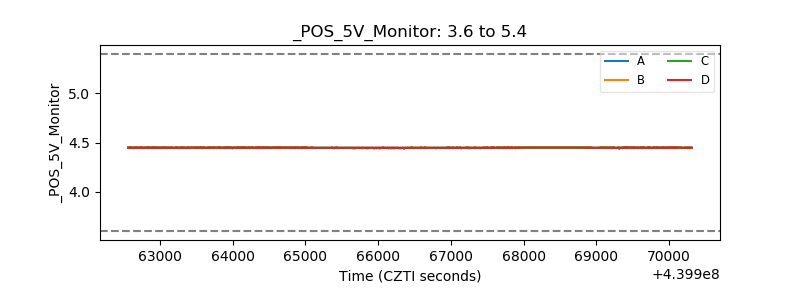 |
| _ROLL_ROT | 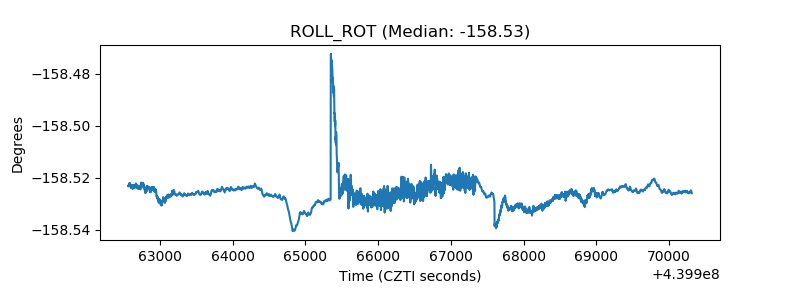 |
| _Roll_DEC | 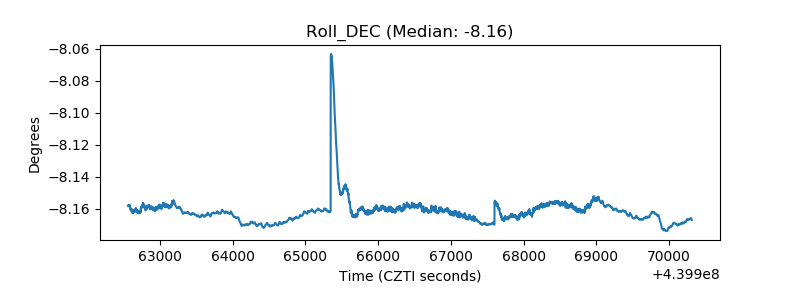 |
| _Roll_RA | 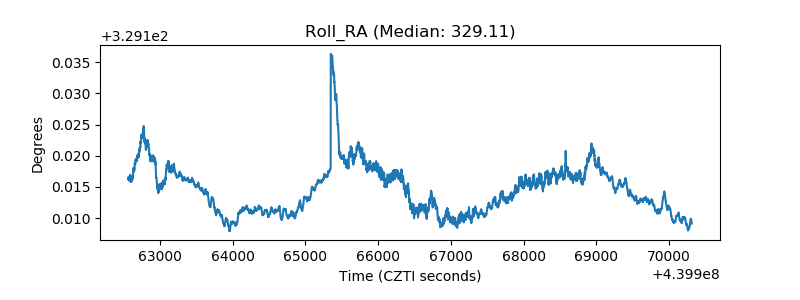 |
| Veto Counter | 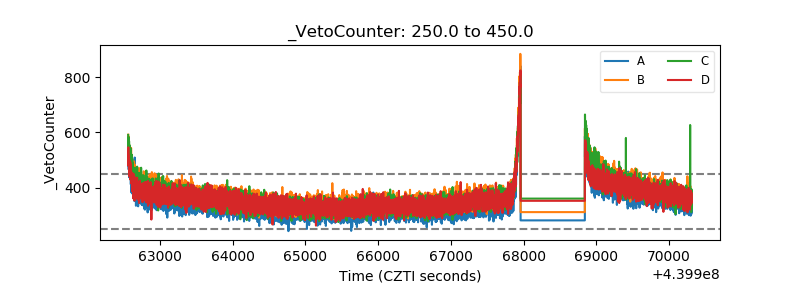 |