| Param | Original file | Final file |
|---|---|---|
| Filename | modeM0/AS1A13_008T06_9000005994_44358cztM0_level2.fits | modeM0/AS1A13_008T06_9000005994_44358cztM0_level2_quad_clean.evt |
| Size (bytes) | 625,968,000 | 108,866,880 |
| Size | 597.0 MB | 103.8 MB |
| Events in quadrant A | 9,208,394 | 675,733 |
| Events in quadrant B | 3,742,261 | 787,528 |
| Events in quadrant C | 3,431,685 | 753,768 |
| Events in quadrant D | 6,285,158 | 625,364 |
| Mode M9 | |||
|---|---|---|---|
| Quadrant | BADHDUFLAG | Total packets | Discarded packets |
| A | 0 | 11 | 0 |
| B | 0 | 11 | 0 |
| C | 0 | 11 | 0 |
| D | 0 | 11 | 0 |
| Mode SS | |||
|---|---|---|---|
| Quadrant | BADHDUFLAG | Total packets | Discarded packets |
| A | 0 | 134 | 0 |
| B | 0 | 134 | 0 |
| C | 0 | 134 | 0 |
| D | 0 | 134 | 0 |
| Mode M0 | |||
|---|---|---|---|
| Quadrant | BADHDUFLAG | Total packets | Discarded packets |
| A | 0 | 31912 | 1 |
| B | 0 | 15275 | 1 |
| C | 0 | 14619 | 1 |
| D | 0 | 23048 | 6 |
| Quadrant | Total seconds | Saturated seconds | Saturation percentage |
|---|---|---|---|
| A | 6503 | 1290 | 19.836998% |
| B | 6504 | 236 | 3.628536% |
| C | 6504 | 148 | 2.275523% |
| D | 6503 | 931 | 14.316469% |
Noise dominated data is calculated using 1-second bins in cleaned event files. If a bin has >2000 counts, and if more than 50% of those come from <1% of pixels, then it is considered to be noise-dominated and hence unusable.
| Quadrant | # 1 sec bins | Bins with >0 counts | Bins with >2000 counts | High rate bins dominated by noise | Noise dominated (total time) | Noise dominated (detector-on time) | Marked lightcurve |
|---|---|---|---|---|---|---|---|
| A | 7668 | 6503 | 991 | 991 | 12.92% | 15.24% | 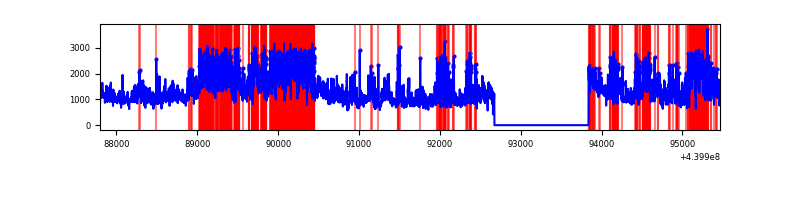 |
| B | 7669 | 6504 | 85 | 85 | 1.11% | 1.31% | 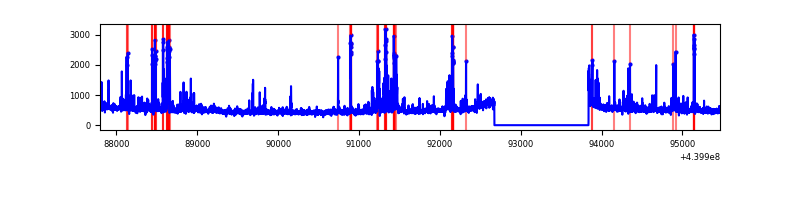 |
| C | 7669 | 6504 | 76 | 76 | 0.99% | 1.17% | 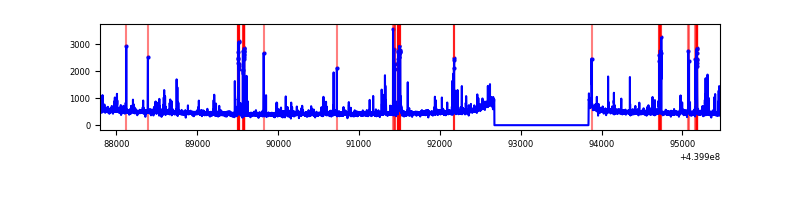 |
| D | 7668 | 6503 | 818 | 818 | 10.67% | 12.58% | 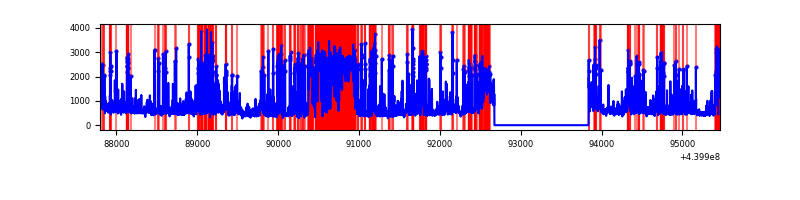 |
Top three noisy pixels from each quadrant. If the there are fewer than three noisy pixels in the level2.evt file, extra rows are filled as -1
| Pixel properties | Quadrant properties | ||||||
|---|---|---|---|---|---|---|---|
| Quadrant | DetID | PixID | Counts | Sigma | Mean | Median | Sigma |
| A | 15 | 223 | 3507527 | 22300.21 | 754 | 740 | 157.3 |
| A | 10 | 83 | 1668401 | 10604.92 | 754 | 740 | 157.3 |
| A | 13 | 248 | 1058860 | 6728.75 | 754 | 740 | 157.3 |
| B | 5 | 172 | 191612 | 1252.87 | 779 | 757 | 152.3 |
| B | 7 | 221 | 147335 | 962.22 | 779 | 757 | 152.3 |
| B | 0 | 219 | 109799 | 715.81 | 779 | 757 | 152.3 |
| C | 14 | 254 | 264836 | 1475.4 | 758 | 762 | 179.0 |
| C | 15 | 208 | 76495 | 423.12 | 758 | 762 | 179.0 |
| C | 1 | 3 | 55854 | 307.8 | 758 | 762 | 179.0 |
| D | 5 | 235 | 1064560 | 5918.23 | 717 | 696 | 179.8 |
| D | 13 | 249 | 832888 | 4629.45 | 717 | 696 | 179.8 |
| D | 1 | 52 | 367009 | 2037.78 | 717 | 696 | 179.8 |
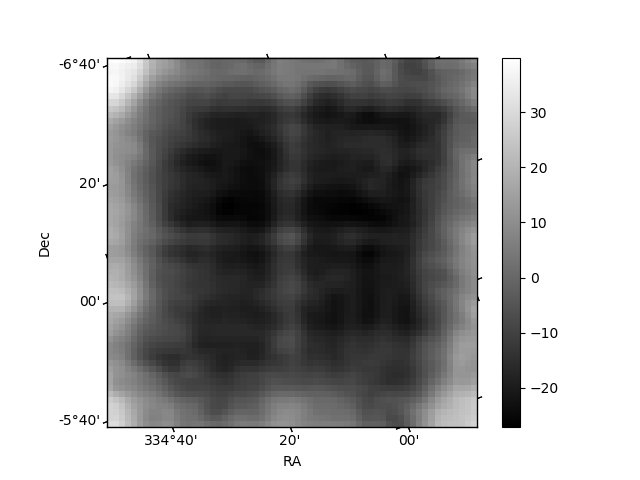
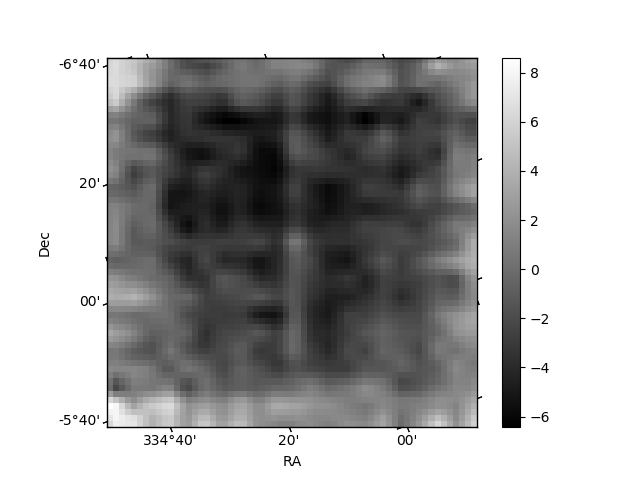
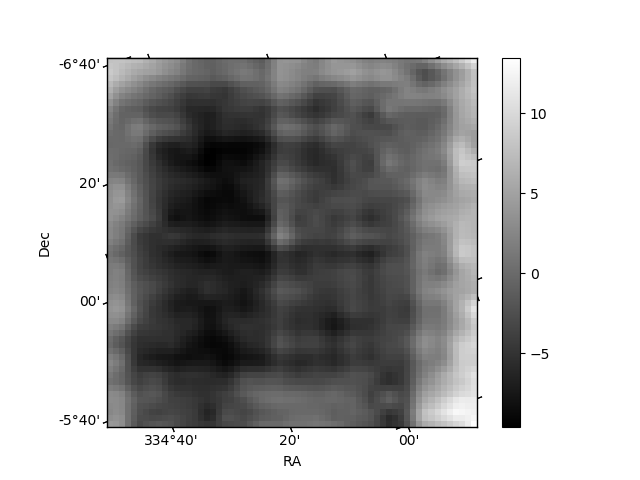
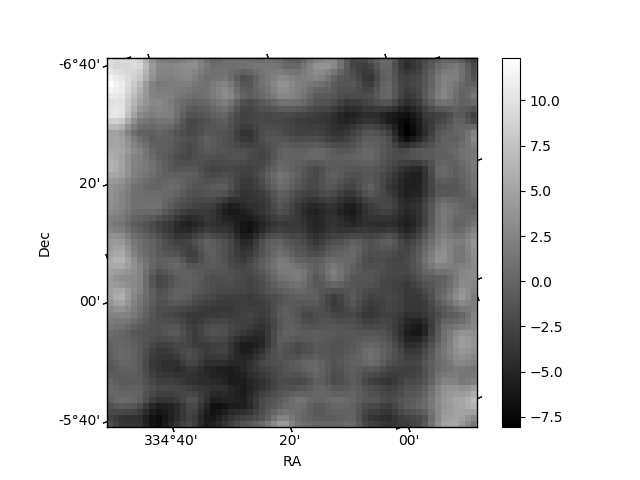
Histogram calculated using DETX and DETY for each event in the final _common_clean file
| Quadrant A | 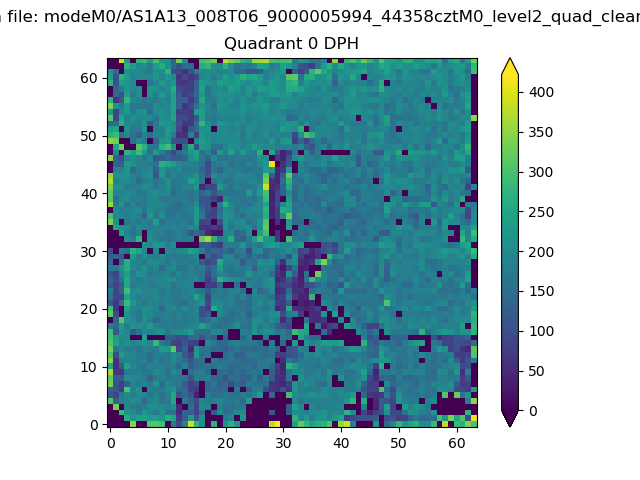 |
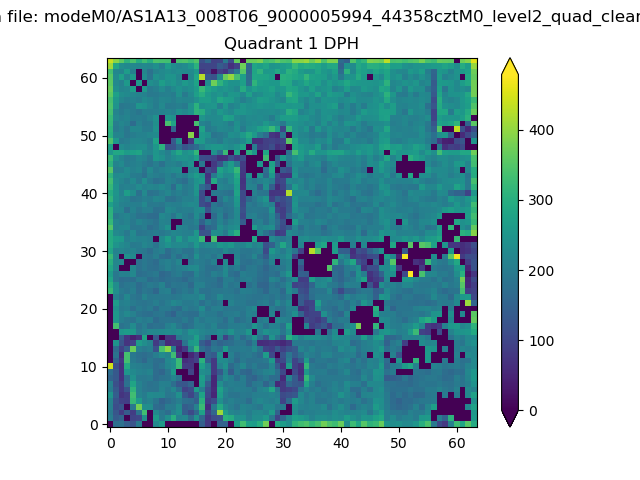 |
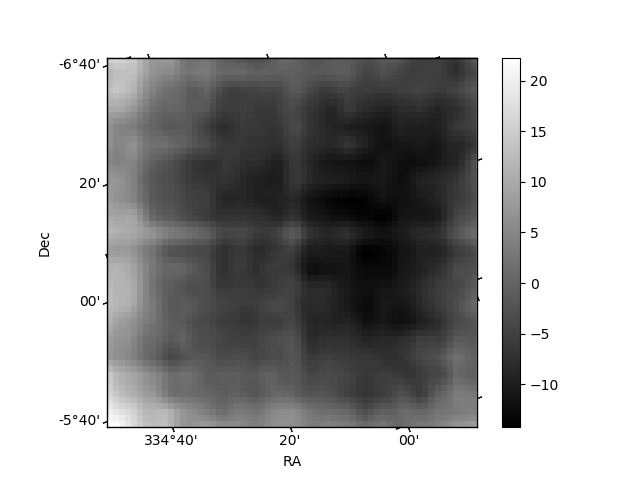
Quadrant B |
|---|---|---|---|
| Quadrant D | 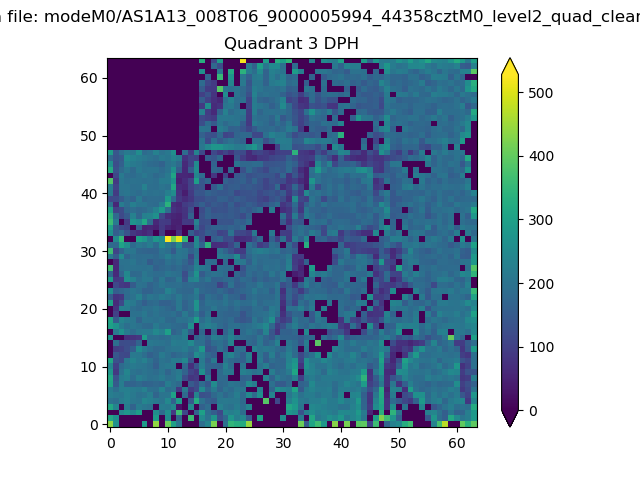 |
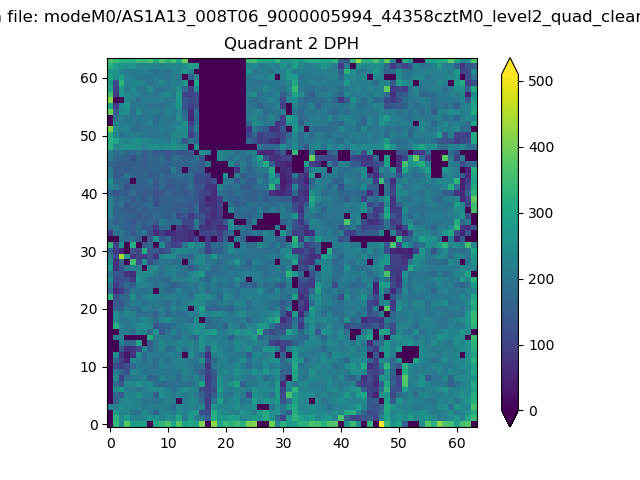 |
Quadrant C |
| Plot type | Count rate plots | Images |
|---|---|---|
| Comparison with Poisson distribution Blue bars denote a histogram of data divided into 1 sec bins. Red curve is a Poisson curve with rate = median count rate of data. |
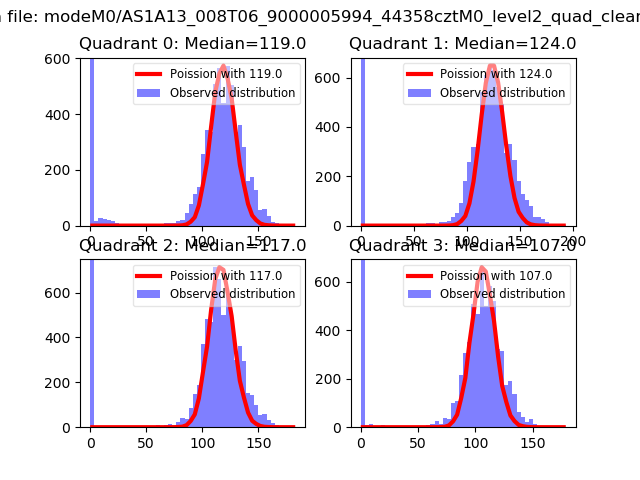 |
 |
| Quadrant-wise count rates Data is divided into 100 sec bins |
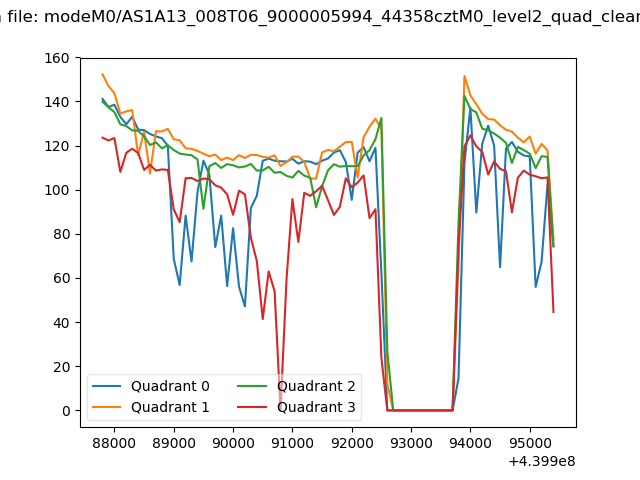 |
|
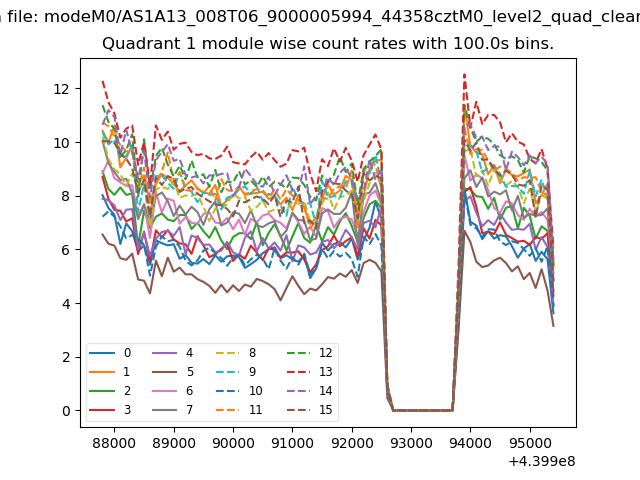
| Module-wise count rates for Quadrant A Data is divided into 100 sec bins |
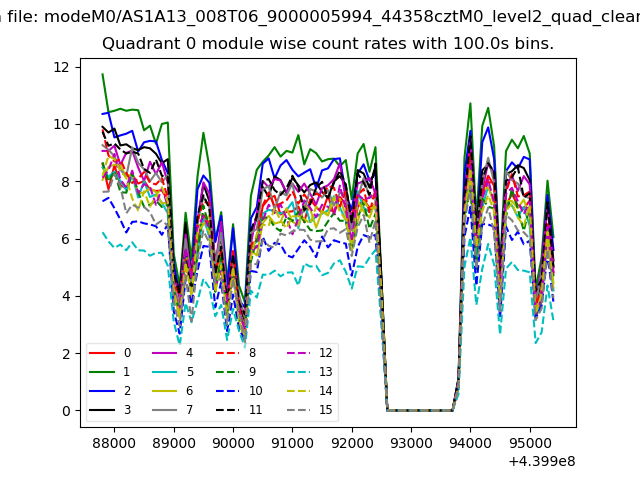 |
 |
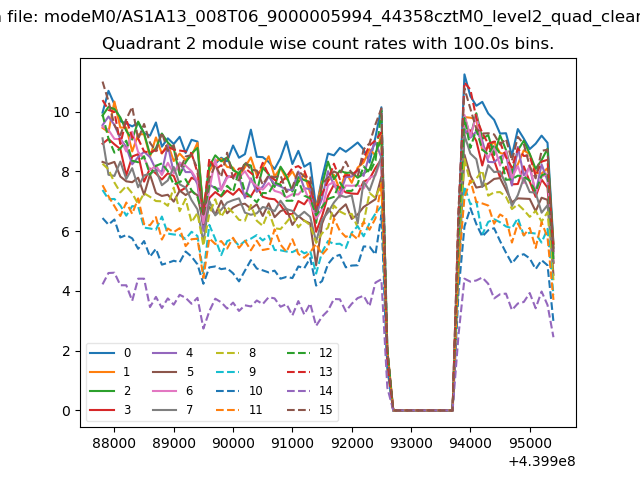
| Module-wise count rates for Quadrant B Data is divided into 100 sec bins |
 |
 |
| Module-wise count rates for Quadrant C Data is divided into 100 sec bins |
 |
 |
| Module-wise count rates for Quadrant D Data is divided into 100 sec bins |
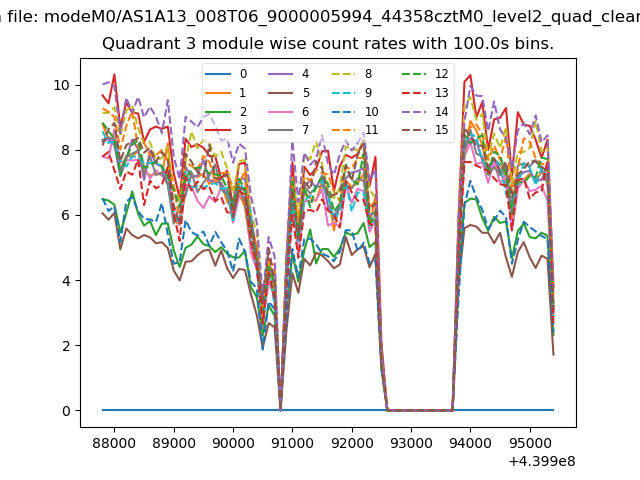 |
 |
| Parameter | Plot |
|---|---|
| CZT HV Monitor | 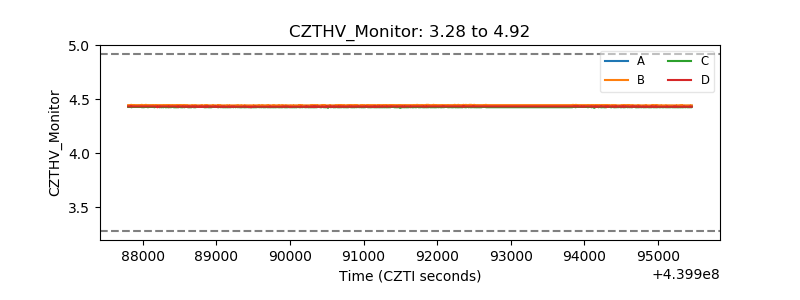 |
| D_VDD | 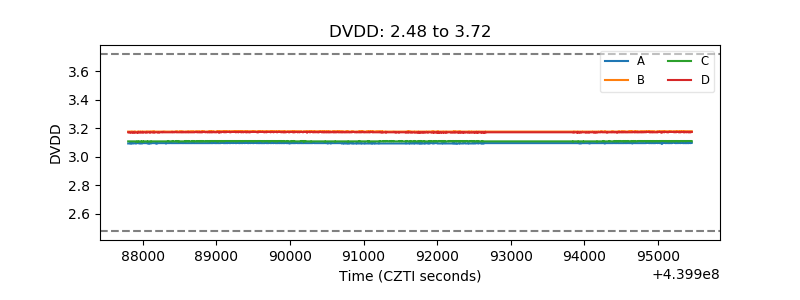 |
| Temperature 1 | 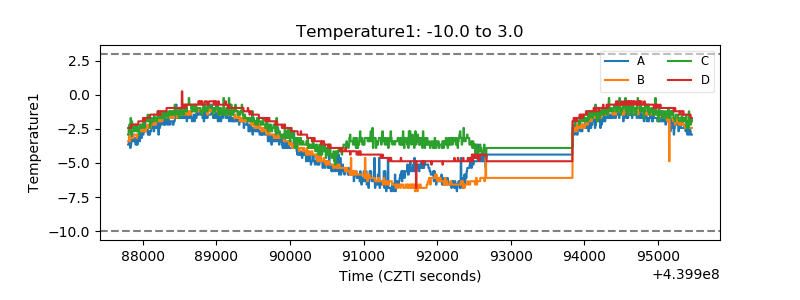 |
| Veto HV Monitor | 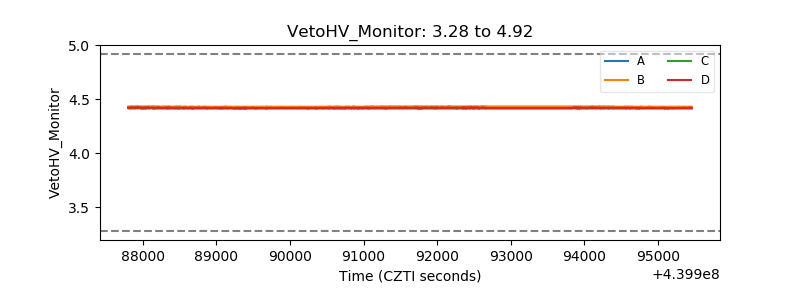 |
| Veto LLD | 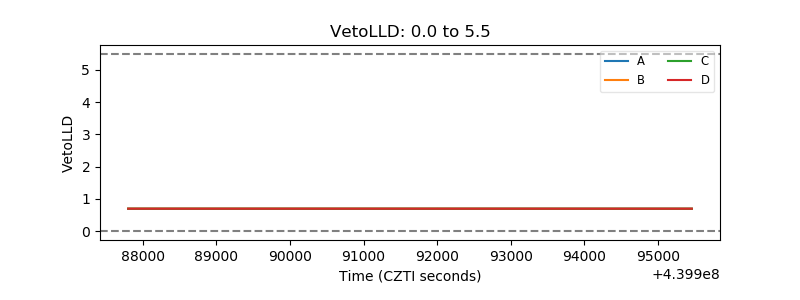 |
| Alpha Counter | 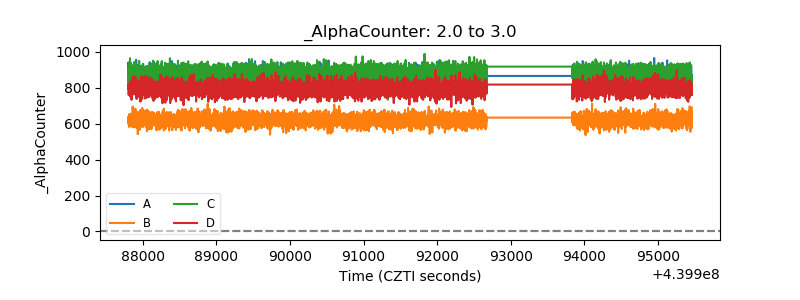 |
| _CPM_Rate | 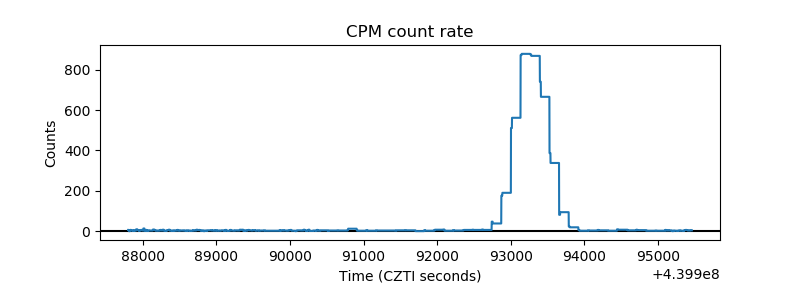 |
| CZT Counter | 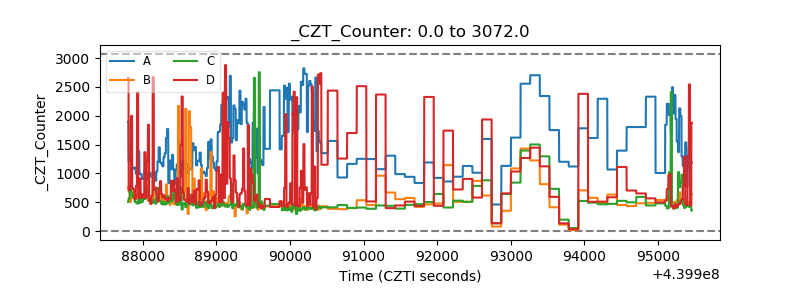 |
| +2.5 Volts monitor | 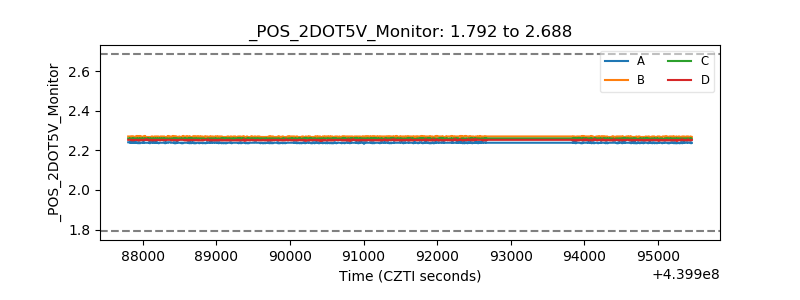 |
| +5 Volts monitor | 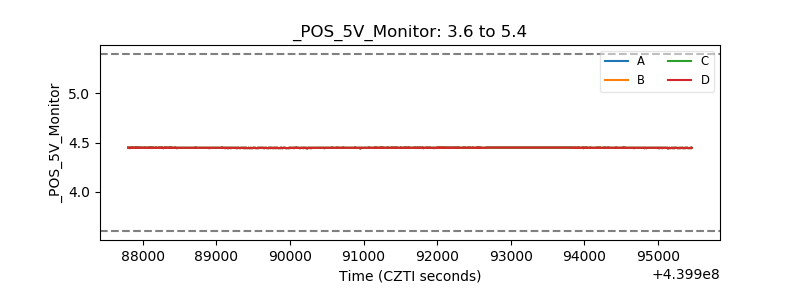 |
| _ROLL_ROT | 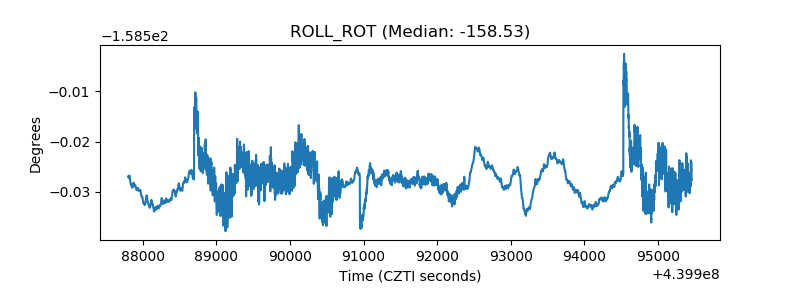 |
| _Roll_DEC | 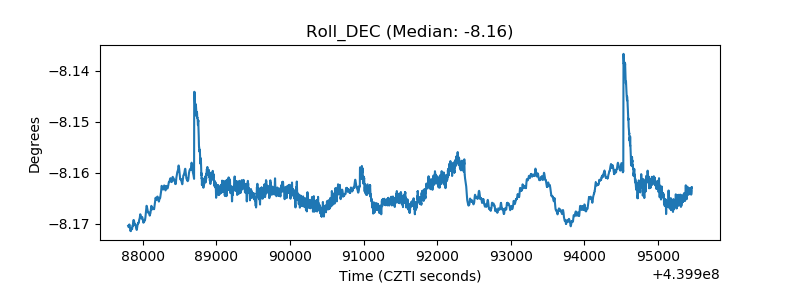 |
| _Roll_RA | 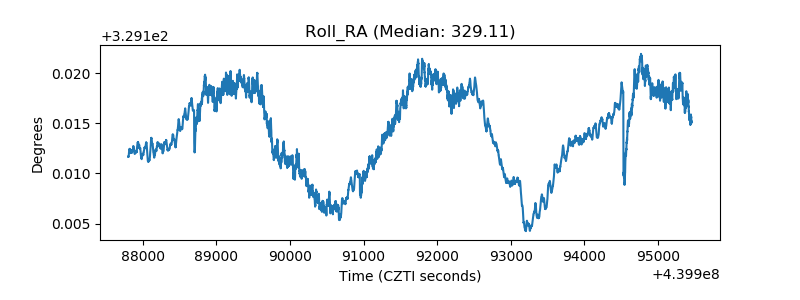 |
| Veto Counter | 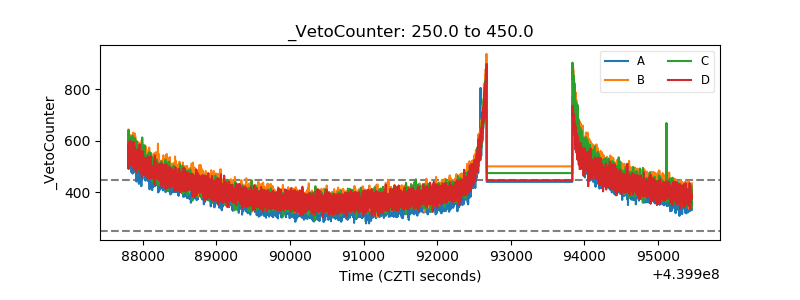 |