| Param | Original file | Final file |
|---|---|---|
| Filename | modeM0/AS1A13_008T06_9000005994_44359cztM0_level2.fits | modeM0/AS1A13_008T06_9000005994_44359cztM0_level2_quad_clean.evt |
| Size (bytes) | 529,093,440 | 97,646,400 |
| Size | 504.6 MB | 93.1 MB |
| Events in quadrant A | 7,543,582 | 590,817 |
| Events in quadrant B | 3,272,660 | 705,832 |
| Events in quadrant C | 3,010,527 | 675,154 |
| Events in quadrant D | 5,291,876 | 565,280 |
| Mode M9 | |||
|---|---|---|---|
| Quadrant | BADHDUFLAG | Total packets | Discarded packets |
| A | 0 | 12 | 0 |
| B | 0 | 12 | 0 |
| C | 0 | 12 | 0 |
| D | 0 | 12 | 0 |
| Mode SS | |||
|---|---|---|---|
| Quadrant | BADHDUFLAG | Total packets | Discarded packets |
| A | 0 | 120 | 0 |
| B | 0 | 120 | 0 |
| C | 0 | 120 | 0 |
| D | 0 | 120 | 0 |
| Mode M0 | |||
|---|---|---|---|
| Quadrant | BADHDUFLAG | Total packets | Discarded packets |
| A | 0 | 26727 | 2 |
| B | 0 | 13668 | 1 |
| C | 0 | 13272 | 1 |
| D | 0 | 19841 | 1 |
| Quadrant | Total seconds | Saturated seconds | Saturation percentage |
|---|---|---|---|
| A | 6012 | 1104 | 18.363273% |
| B | 6012 | 147 | 2.445110% |
| C | 6013 | 95 | 1.579910% |
| D | 6013 | 698 | 11.608182% |
Noise dominated data is calculated using 1-second bins in cleaned event files. If a bin has >2000 counts, and if more than 50% of those come from <1% of pixels, then it is considered to be noise-dominated and hence unusable.
| Quadrant | # 1 sec bins | Bins with >0 counts | Bins with >2000 counts | High rate bins dominated by noise | Noise dominated (total time) | Noise dominated (detector-on time) | Marked lightcurve |
|---|---|---|---|---|---|---|---|
| A | 7157 | 6012 | 802 | 802 | 11.21% | 13.34% | 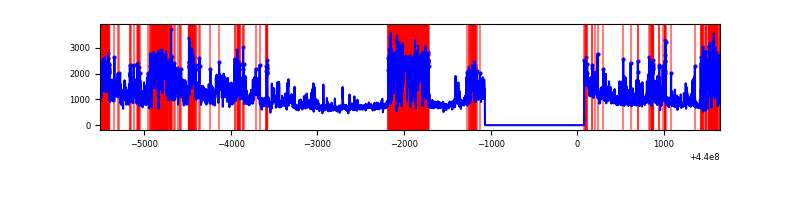 |
| B | 7157 | 6012 | 30 | 30 | 0.42% | 0.50% | 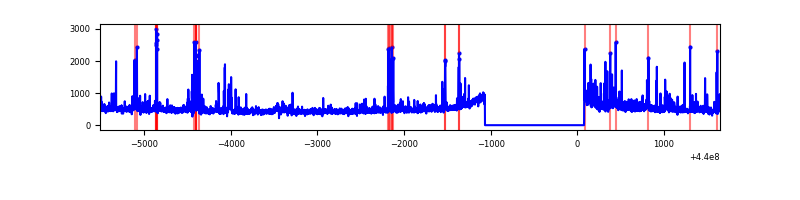 |
| C | 7158 | 6014 | 48 | 48 | 0.67% | 0.80% | 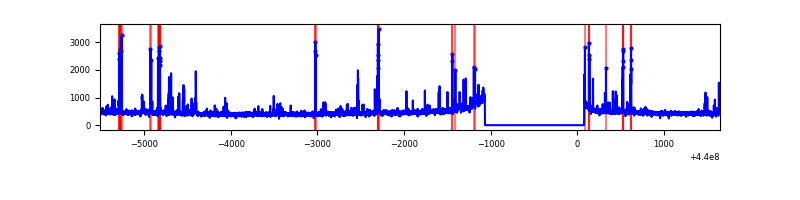 |
| D | 7158 | 6013 | 547 | 547 | 7.64% | 9.10% | 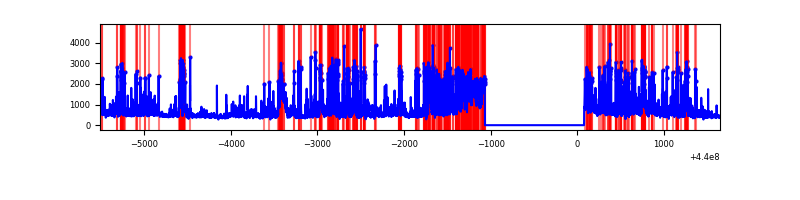 |
Top three noisy pixels from each quadrant. If the there are fewer than three noisy pixels in the level2.evt file, extra rows are filled as -1
| Pixel properties | Quadrant properties | ||||||
|---|---|---|---|---|---|---|---|
| Quadrant | DetID | PixID | Counts | Sigma | Mean | Median | Sigma |
| A | 15 | 223 | 2194205 | 16026.49 | 658 | 645 | 136.9 |
| A | 10 | 83 | 1532226 | 11189.97 | 658 | 645 | 136.9 |
| A | 13 | 248 | 1197088 | 8741.4 | 658 | 645 | 136.9 |
| B | 0 | 219 | 131013 | 938.6 | 703 | 685 | 138.9 |
| B | 5 | 172 | 71222 | 507.99 | 703 | 685 | 138.9 |
| B | 5 | 255 | 62516 | 445.3 | 703 | 685 | 138.9 |
| C | 14 | 254 | 216105 | 1334.43 | 681 | 683 | 161.4 |
| C | 1 | 3 | 85817 | 527.36 | 681 | 683 | 161.4 |
| C | 11 | 16 | 18658 | 111.35 | 681 | 683 | 161.4 |
| D | 13 | 249 | 1529471 | 9369.41 | 645 | 626 | 163.2 |
| D | 5 | 235 | 198860 | 1214.86 | 645 | 626 | 163.2 |
| D | 2 | 153 | 195553 | 1194.6 | 645 | 626 | 163.2 |
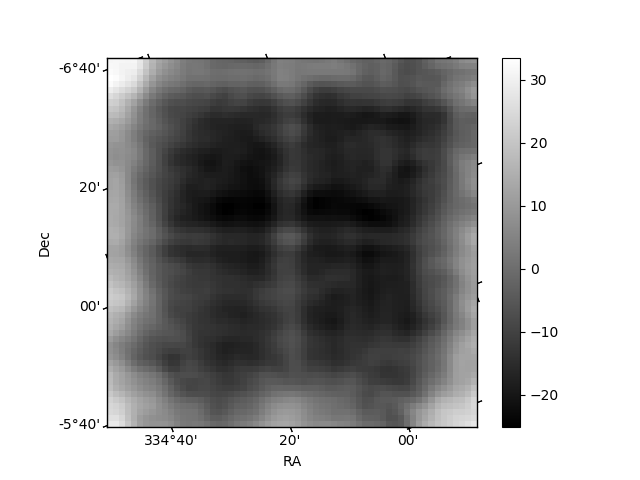
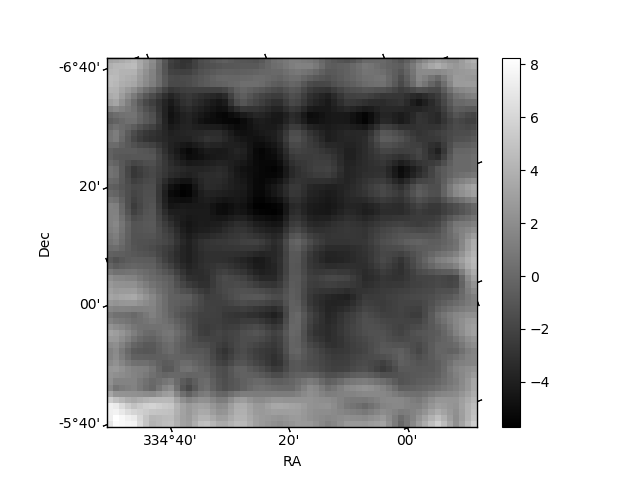
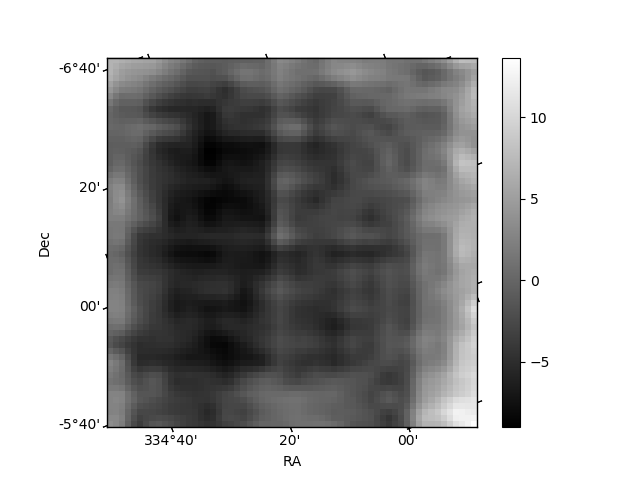
Histogram calculated using DETX and DETY for each event in the final _common_clean file
| Quadrant A | 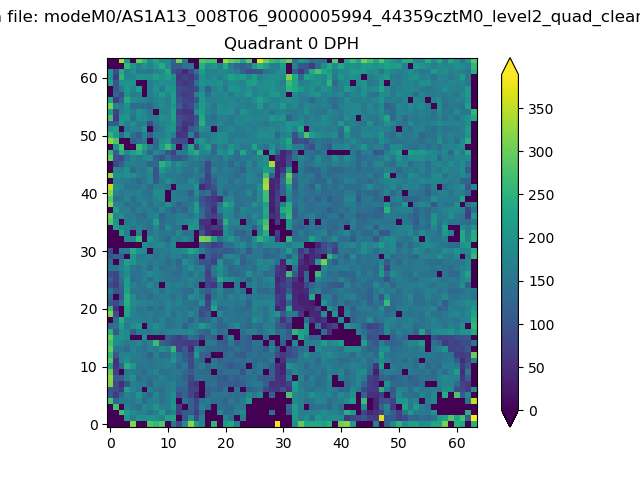 |
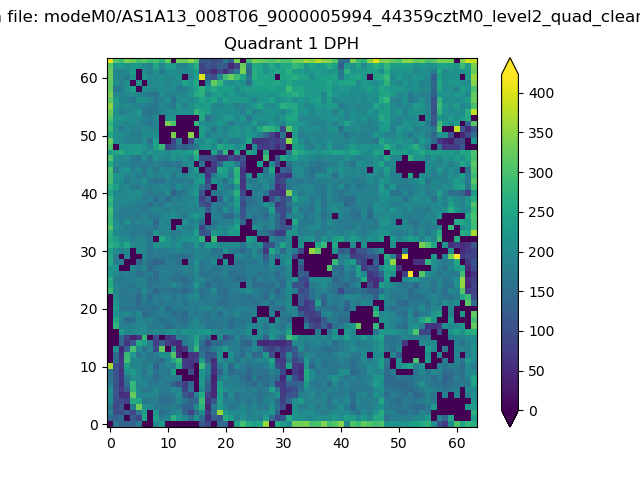 |
Quadrant B |
|---|---|---|---|
| Quadrant D | 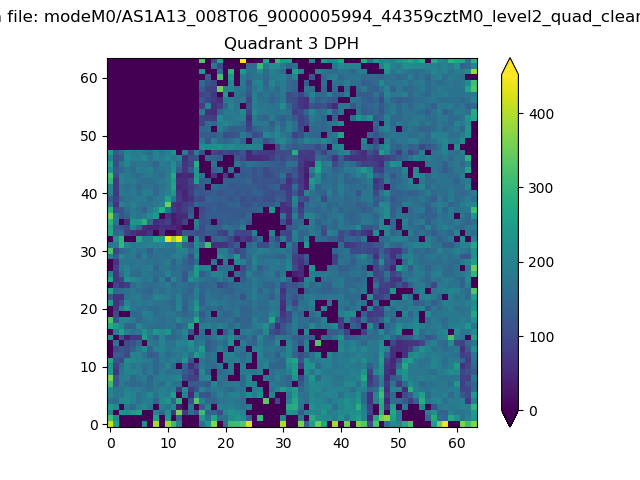 |
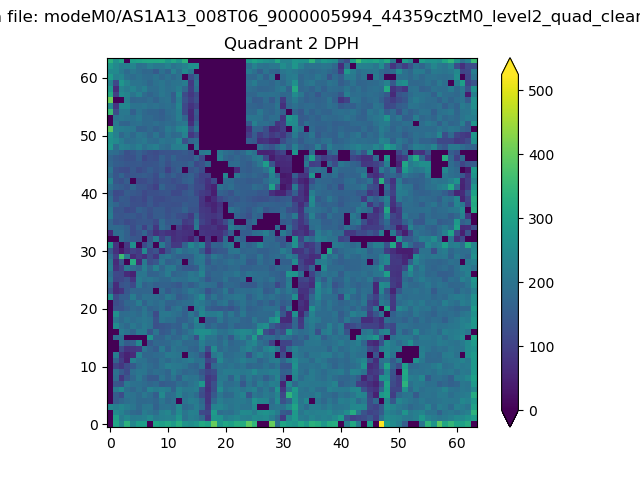 |
Quadrant C |
| Plot type | Count rate plots | Images |
|---|---|---|
| Comparison with Poisson distribution Blue bars denote a histogram of data divided into 1 sec bins. Red curve is a Poisson curve with rate = median count rate of data. |
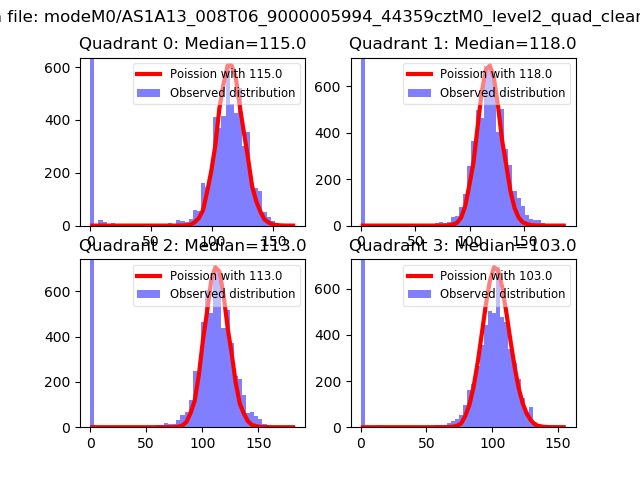 |
 |
| Quadrant-wise count rates Data is divided into 100 sec bins |
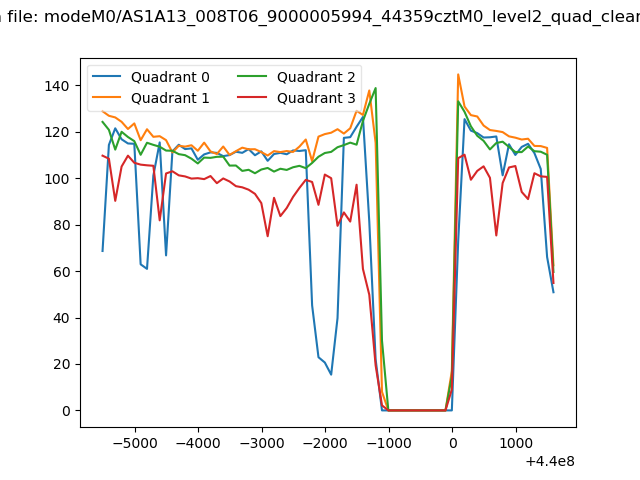 |
|
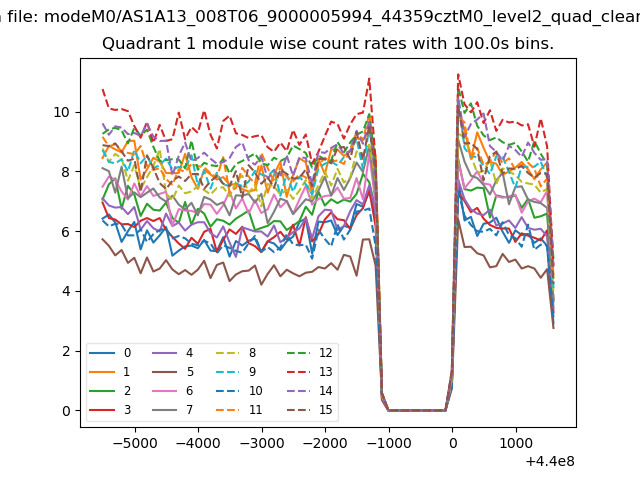
| Module-wise count rates for Quadrant A Data is divided into 100 sec bins |
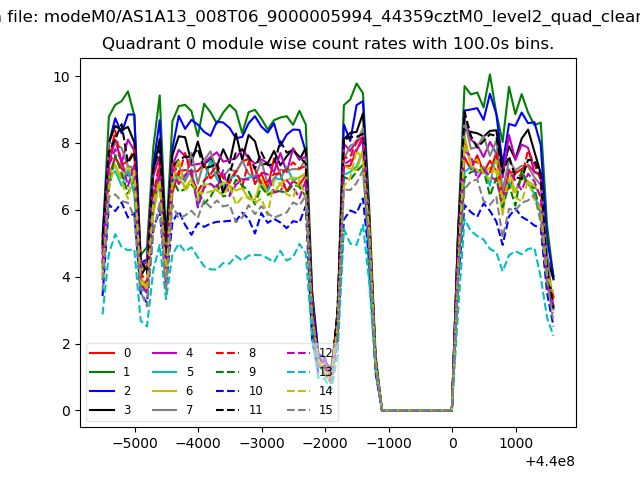 |
 |
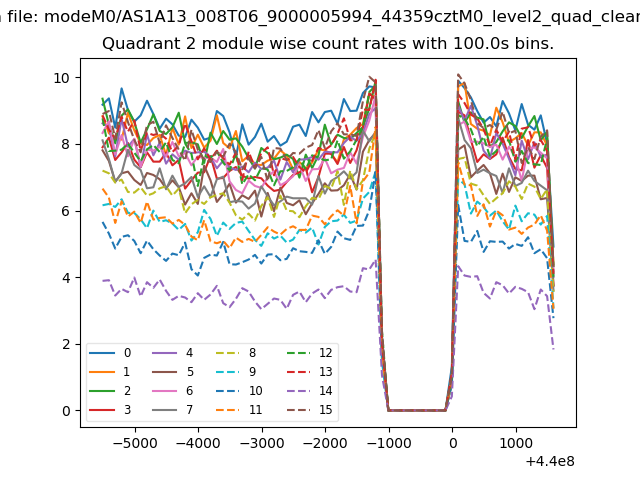
| Module-wise count rates for Quadrant B Data is divided into 100 sec bins |
 |
 |
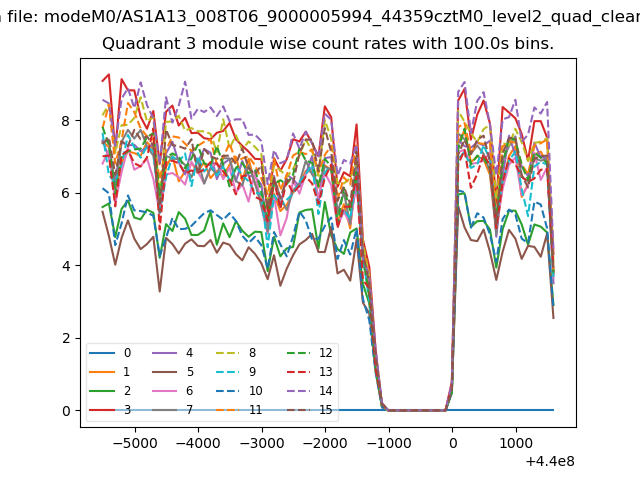
| Module-wise count rates for Quadrant C Data is divided into 100 sec bins |
 |
 |
| Module-wise count rates for Quadrant D Data is divided into 100 sec bins |
 |
 |
| Parameter | Plot |
|---|---|
| CZT HV Monitor | 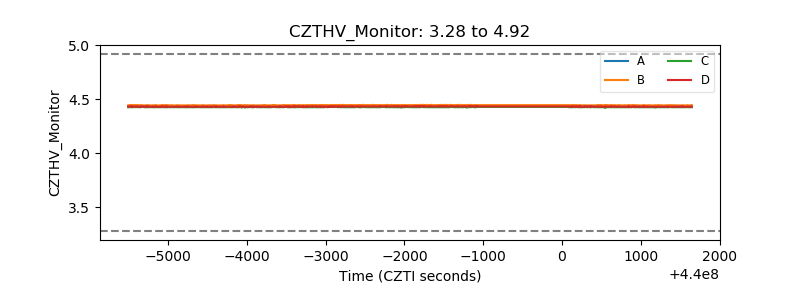 |
| D_VDD | 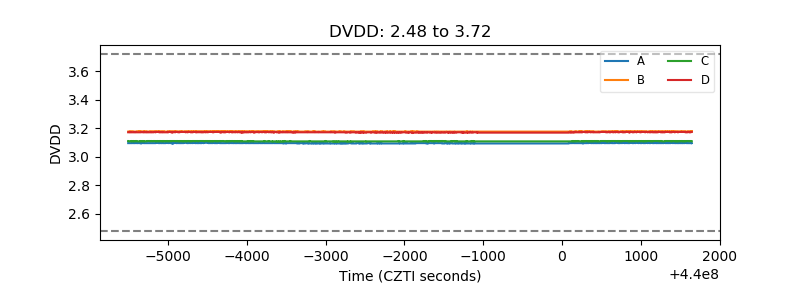 |
| Temperature 1 | 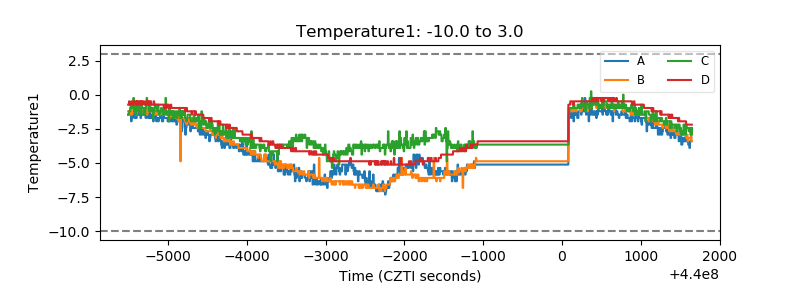 |
| Veto HV Monitor | 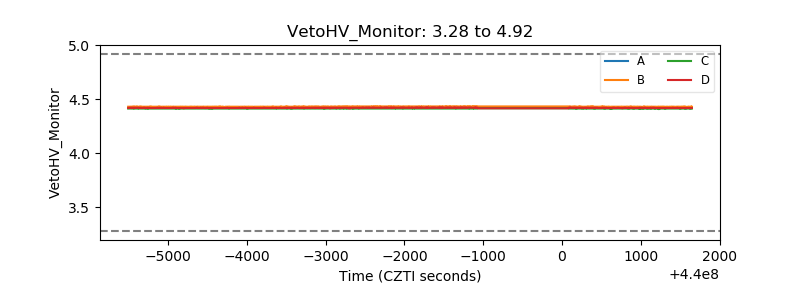 |
| Veto LLD | 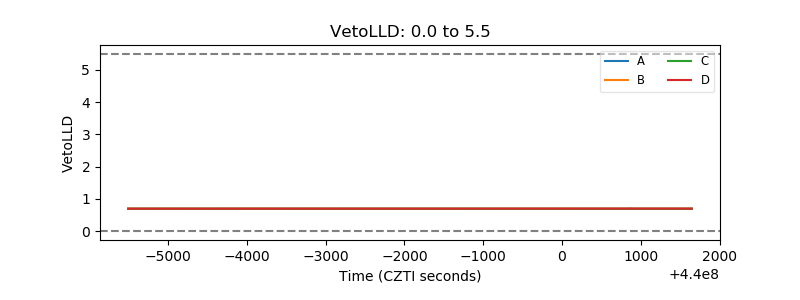 |
| Alpha Counter | 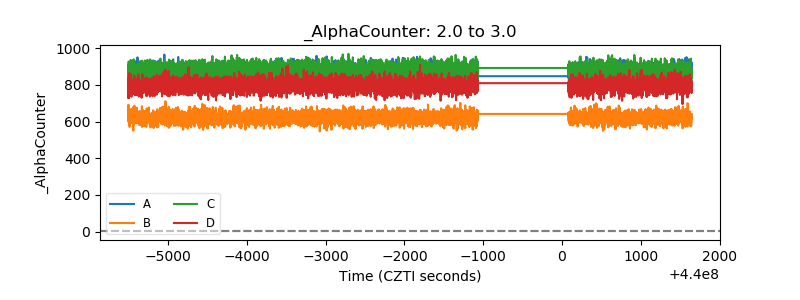 |
| _CPM_Rate | 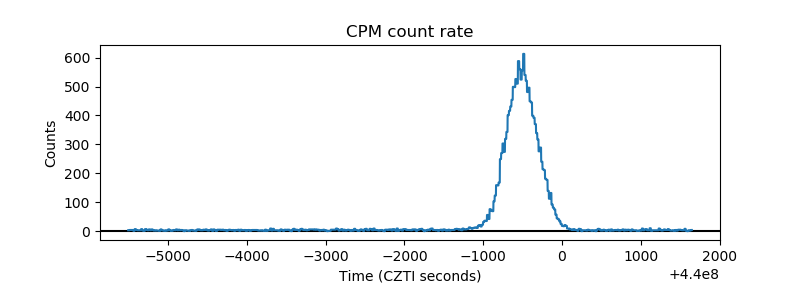 |
| CZT Counter | 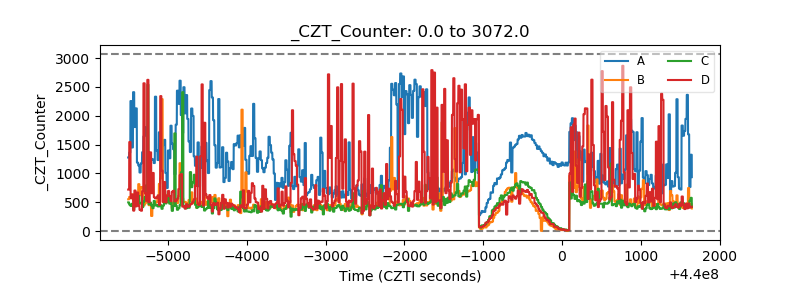 |
| +2.5 Volts monitor | 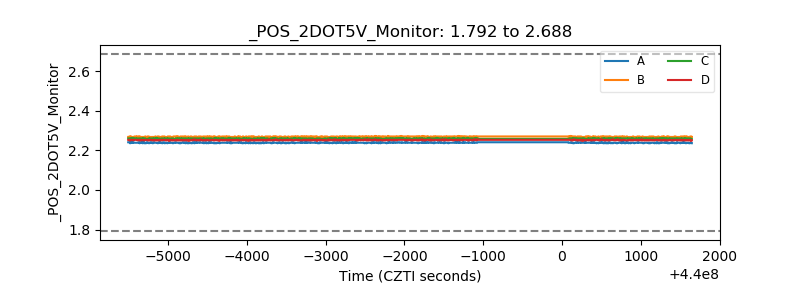 |
| +5 Volts monitor | 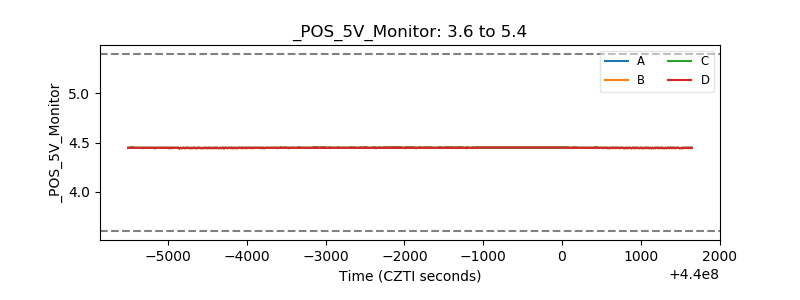 |
| _ROLL_ROT | 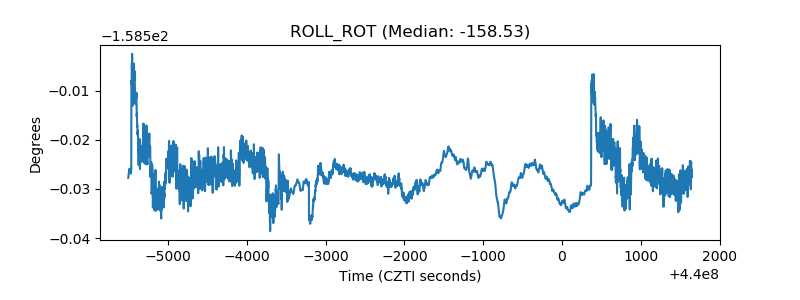 |
| _Roll_DEC | 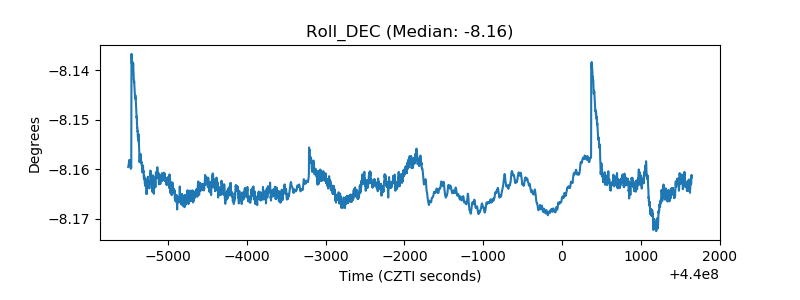 |
| _Roll_RA | 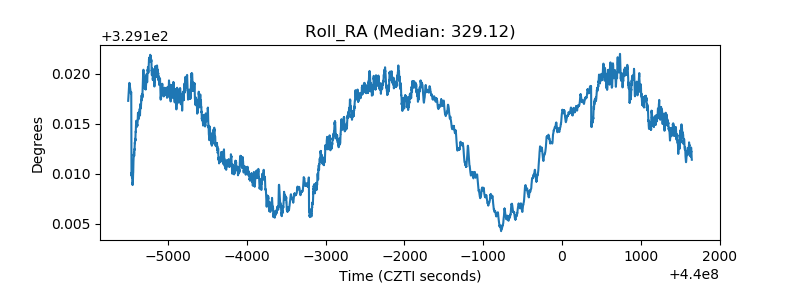 |
| Veto Counter | 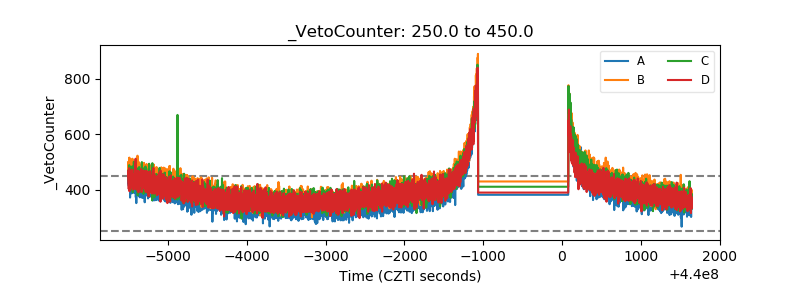 |