| Param | Original file | Final file |
|---|---|---|
| Filename | modeM0/AS1A13_008T06_9000005994_44361cztM0_level2.fits | modeM0/AS1A13_008T06_9000005994_44361cztM0_level2_quad_clean.evt |
| Size (bytes) | 1,373,834,880 | 246,602,880 |
| Size | 1.3 GB | 235.2 MB |
| Events in quadrant A | 17,670,755 | 1,471,945 |
| Events in quadrant B | 8,427,475 | 1,792,975 |
| Events in quadrant C | 8,165,653 | 1,730,289 |
| Events in quadrant D | 15,352,116 | 1,365,359 |
| Mode M9 | |||
|---|---|---|---|
| Quadrant | BADHDUFLAG | Total packets | Discarded packets |
| A | 0 | 29 | 0 |
| B | 0 | 29 | 0 |
| C | 0 | 29 | 0 |
| D | 0 | 29 | 0 |
| Mode SS | |||
|---|---|---|---|
| Quadrant | BADHDUFLAG | Total packets | Discarded packets |
| A | 0 | 324 | 0 |
| B | 0 | 324 | 0 |
| C | 0 | 324 | 0 |
| D | 0 | 324 | 0 |
| Mode M0 | |||
|---|---|---|---|
| Quadrant | BADHDUFLAG | Total packets | Discarded packets |
| A | 0 | 64559 | 3 |
| B | 0 | 35807 | 3 |
| C | 0 | 35780 | 3 |
| D | 0 | 56685 | 3 |
| Quadrant | Total seconds | Saturated seconds | Saturation percentage |
|---|---|---|---|
| A | 16034 | 2661 | 16.595984% |
| B | 16034 | 342 | 2.132967% |
| C | 16033 | 217 | 1.353458% |
| D | 16034 | 2354 | 14.681302% |
Noise dominated data is calculated using 1-second bins in cleaned event files. If a bin has >2000 counts, and if more than 50% of those come from <1% of pixels, then it is considered to be noise-dominated and hence unusable.
| Quadrant | # 1 sec bins | Bins with >0 counts | Bins with >2000 counts | High rate bins dominated by noise | Noise dominated (total time) | Noise dominated (detector-on time) | Marked lightcurve |
|---|---|---|---|---|---|---|---|
| A | 18784 | 16035 | 1933 | 1933 | 10.29% | 12.05% | 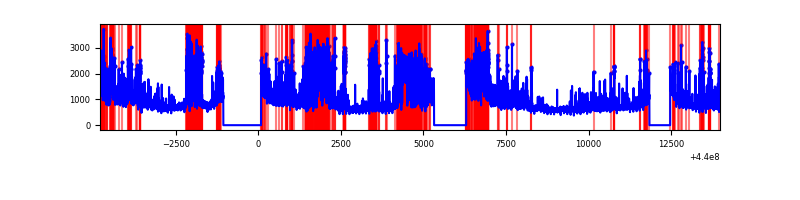 |
| B | 18784 | 16035 | 82 | 82 | 0.44% | 0.51% | 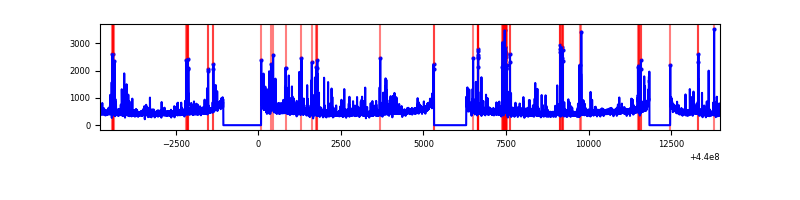 |
| C | 18783 | 16036 | 106 | 106 | 0.56% | 0.66% | 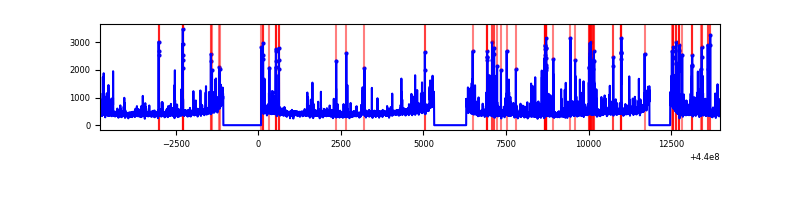 |
| D | 18784 | 16036 | 2072 | 2072 | 11.03% | 12.92% | 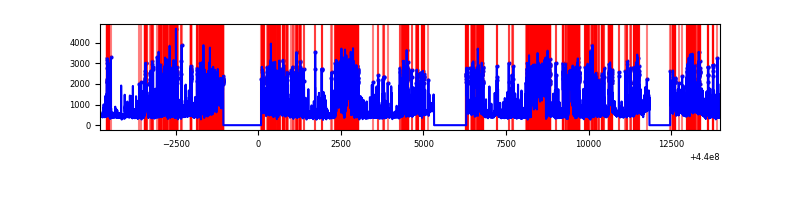 |
Top three noisy pixels from each quadrant. If the there are fewer than three noisy pixels in the level2.evt file, extra rows are filled as -1
| Pixel properties | Quadrant properties | ||||||
|---|---|---|---|---|---|---|---|
| Quadrant | DetID | PixID | Counts | Sigma | Mean | Median | Sigma |
| A | 15 | 223 | 3999765 | 11197.71 | 1729 | 1692 | 357.0 |
| A | 10 | 83 | 3918897 | 10971.22 | 1729 | 1692 | 357.0 |
| A | 13 | 248 | 2893609 | 8099.62 | 1729 | 1692 | 357.0 |
| B | 0 | 219 | 232096 | 625.9 | 1856 | 1802 | 367.9 |
| B | 5 | 255 | 182275 | 490.5 | 1856 | 1802 | 367.9 |
| B | 4 | 170 | 154142 | 414.04 | 1856 | 1802 | 367.9 |
| C | 14 | 254 | 751015 | 1763.66 | 1802 | 1813 | 424.8 |
| C | 14 | 96 | 180388 | 420.37 | 1802 | 1813 | 424.8 |
| C | 1 | 3 | 104751 | 242.32 | 1802 | 1813 | 424.8 |
| D | 13 | 249 | 2657419 | 6214.88 | 1692 | 1644 | 427.3 |
| D | 5 | 235 | 2224115 | 5200.89 | 1692 | 1644 | 427.3 |
| D | 4 | 221 | 895424 | 2091.57 | 1692 | 1644 | 427.3 |
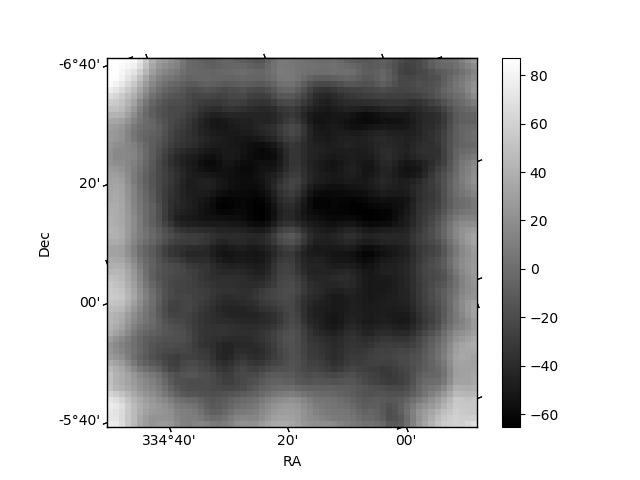
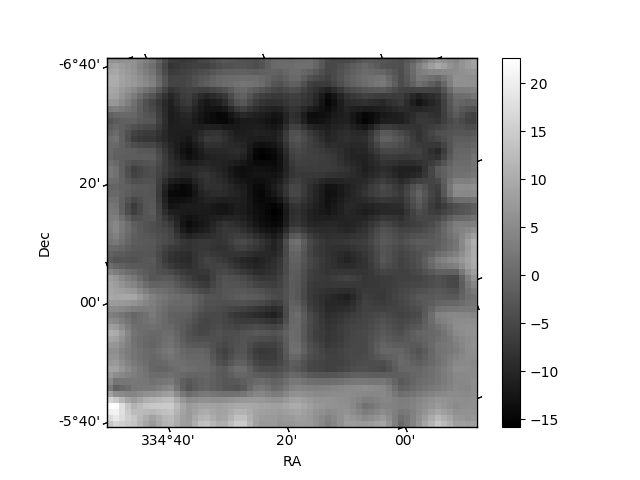
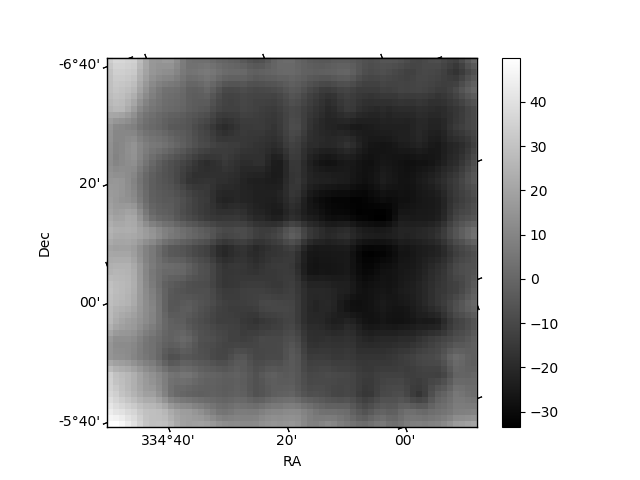
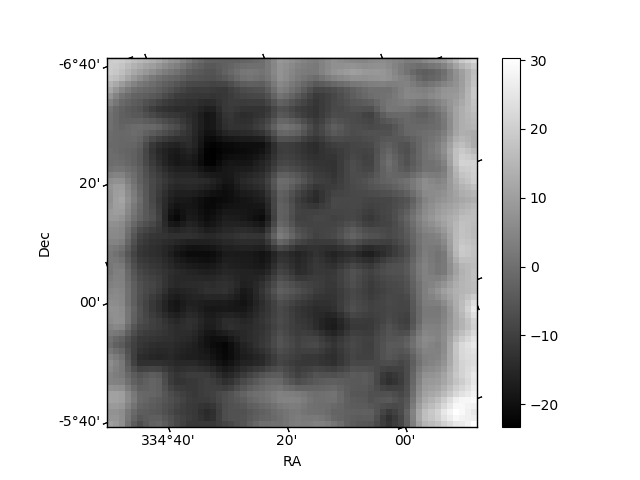
Histogram calculated using DETX and DETY for each event in the final _common_clean file
| Quadrant A | 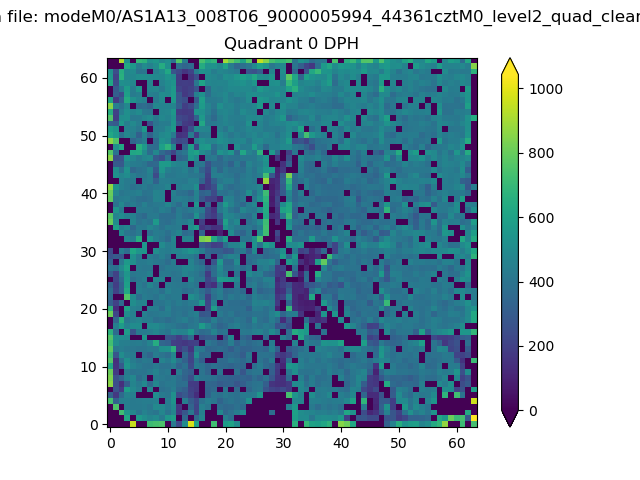 |
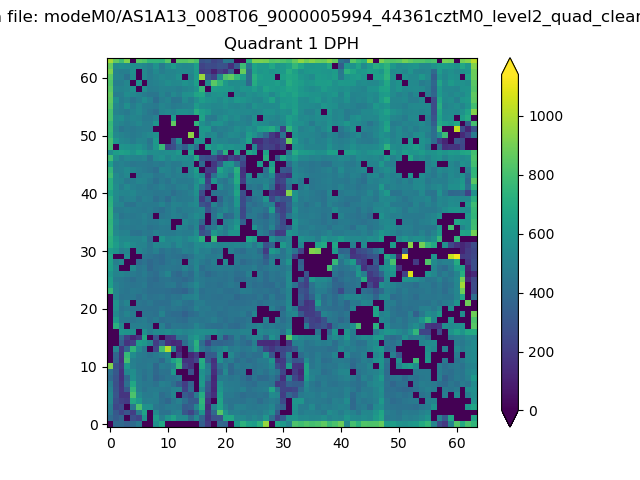 |
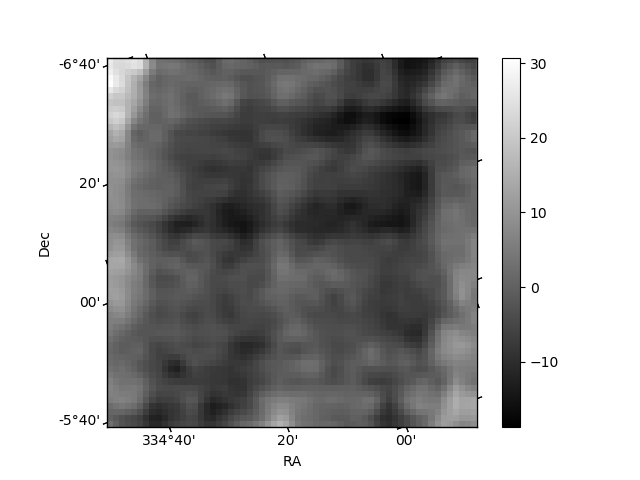
Quadrant B |
|---|---|---|---|
| Quadrant D | 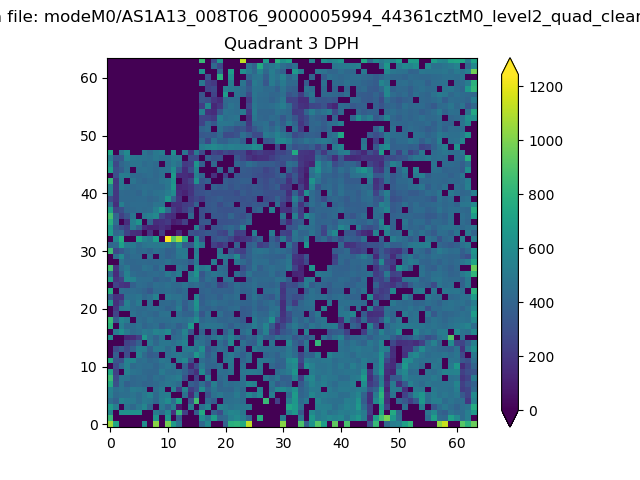 |
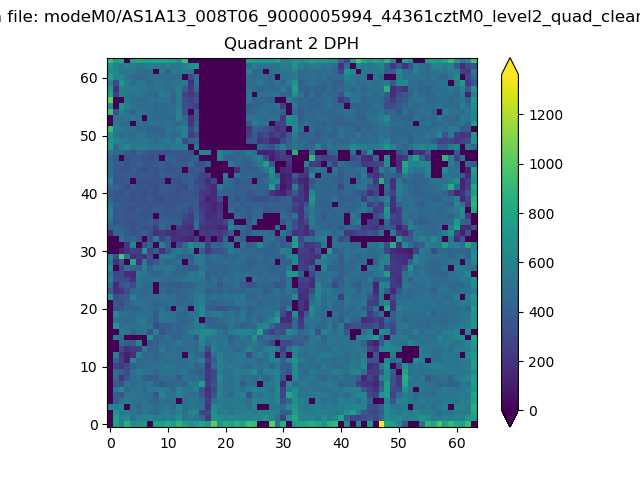 |
Quadrant C |
| Plot type | Count rate plots | Images |
|---|---|---|
| Comparison with Poisson distribution Blue bars denote a histogram of data divided into 1 sec bins. Red curve is a Poisson curve with rate = median count rate of data. |
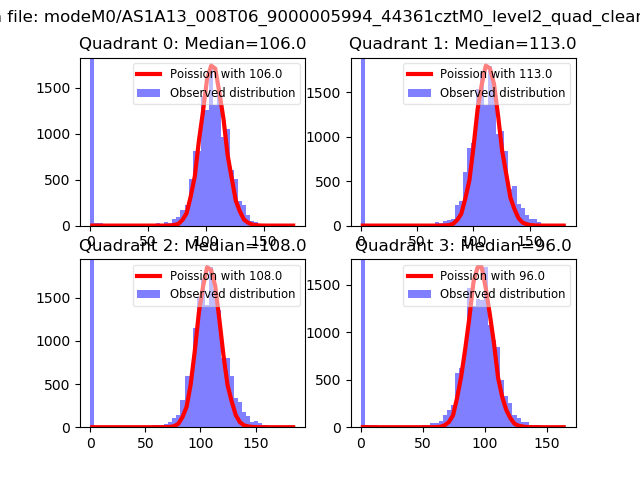 |
 |
| Quadrant-wise count rates Data is divided into 100 sec bins |
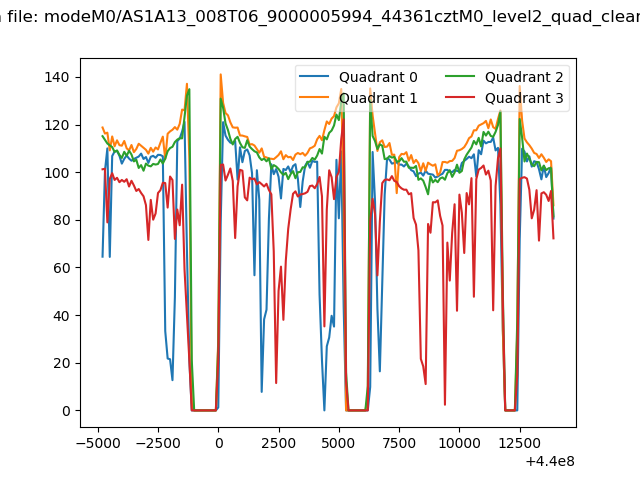 |
|
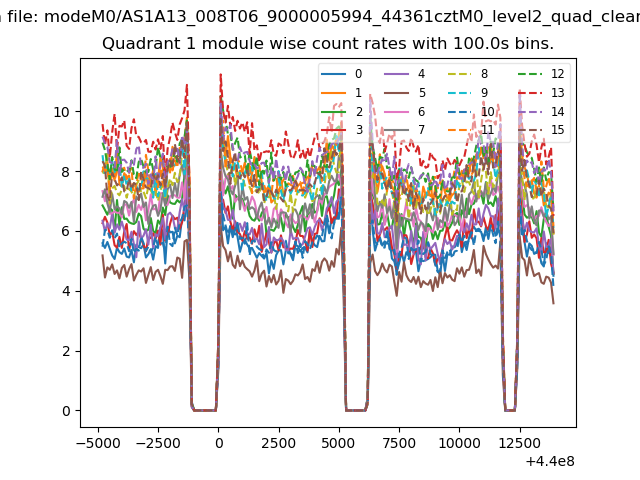
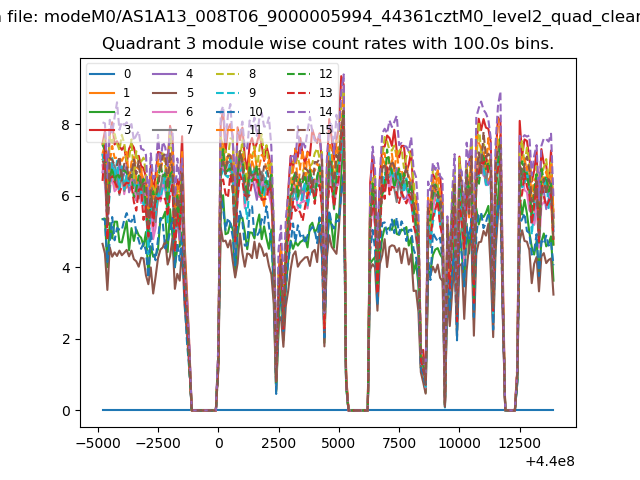
| Module-wise count rates for Quadrant A Data is divided into 100 sec bins |
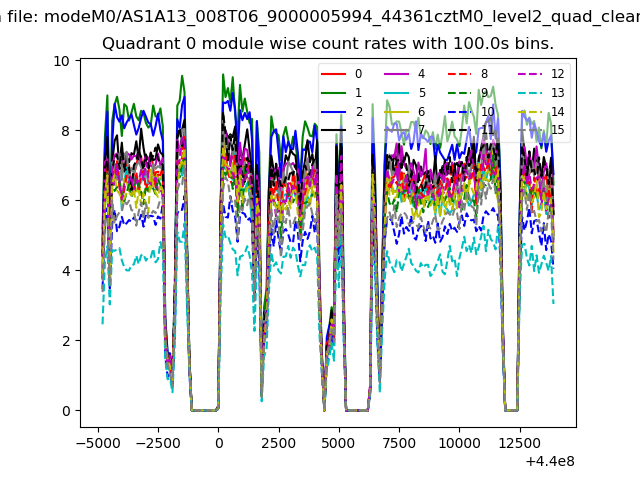 |
 |
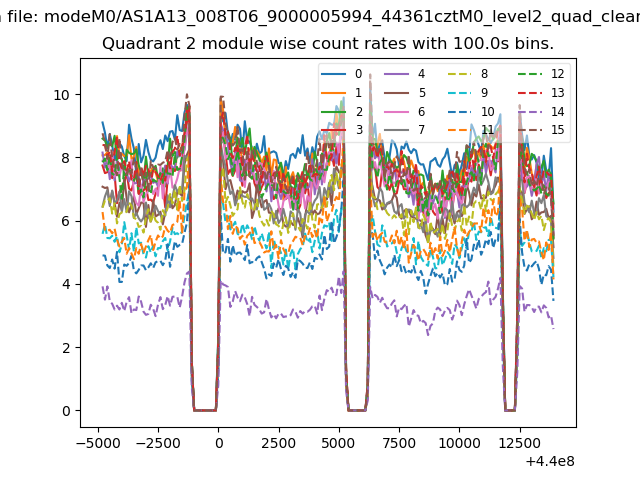
| Module-wise count rates for Quadrant B Data is divided into 100 sec bins |
 |
 |
| Module-wise count rates for Quadrant C Data is divided into 100 sec bins |
 |
 |
| Module-wise count rates for Quadrant D Data is divided into 100 sec bins |
 |
 |
| Parameter | Plot |
|---|---|
| CZT HV Monitor | 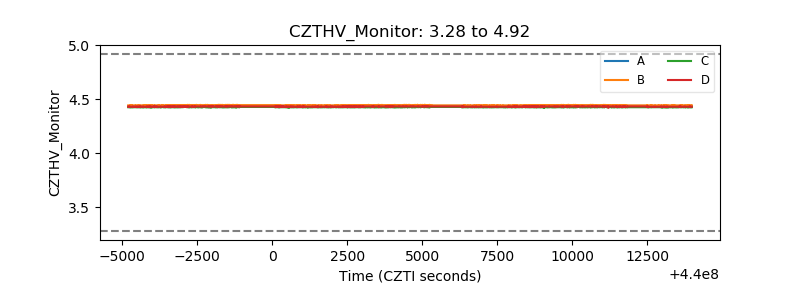 |
| D_VDD | 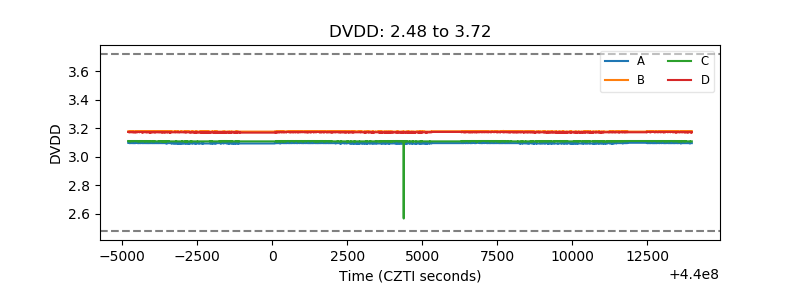 |
| Temperature 1 | 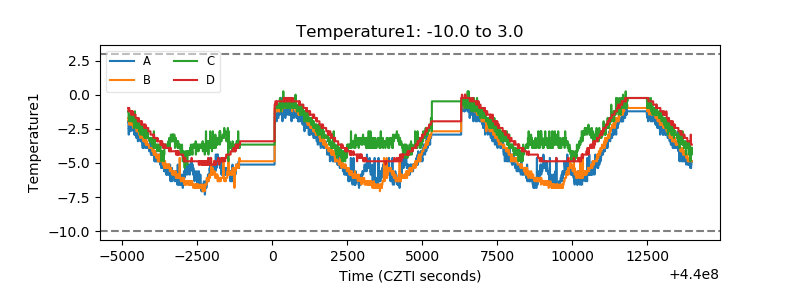 |
| Veto HV Monitor | 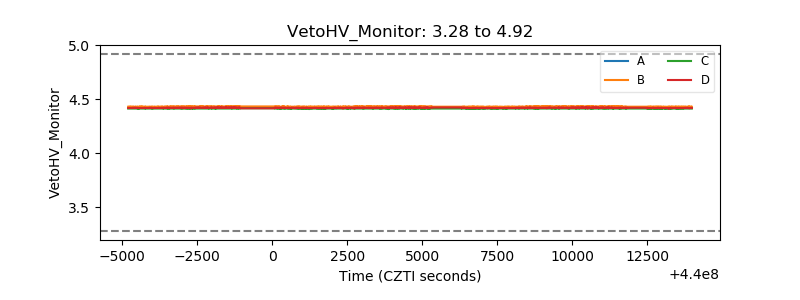 |
| Veto LLD | 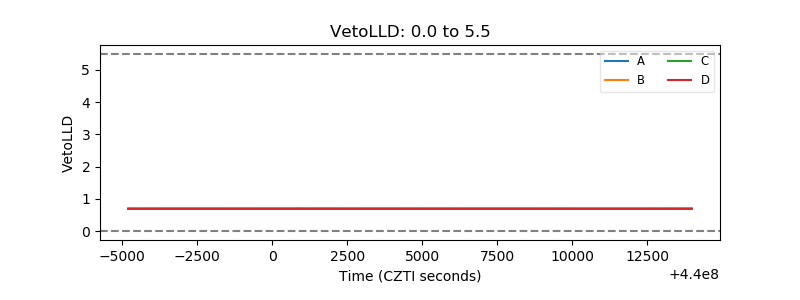 |
| Alpha Counter | 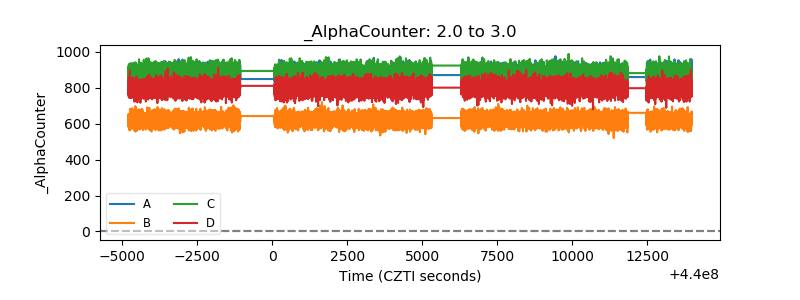 |
| _CPM_Rate |  |
| CZT Counter | 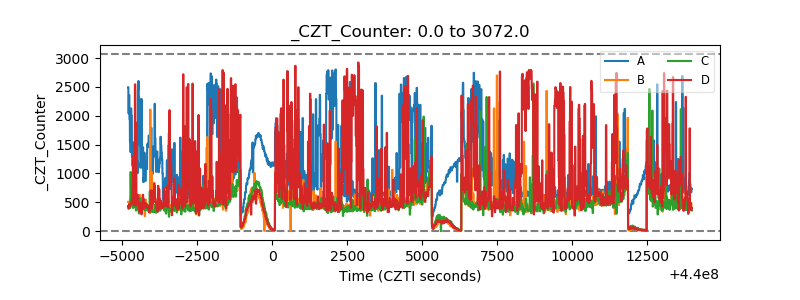 |
| +2.5 Volts monitor | 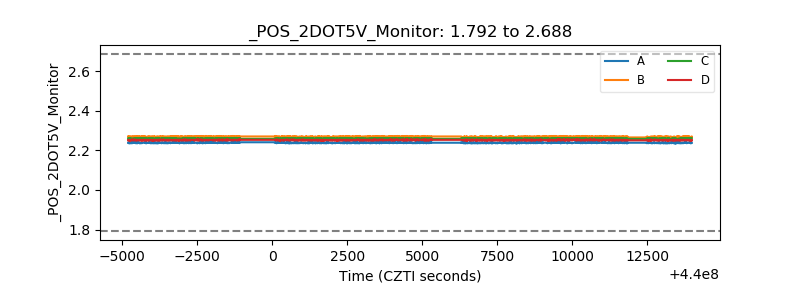 |
| +5 Volts monitor | 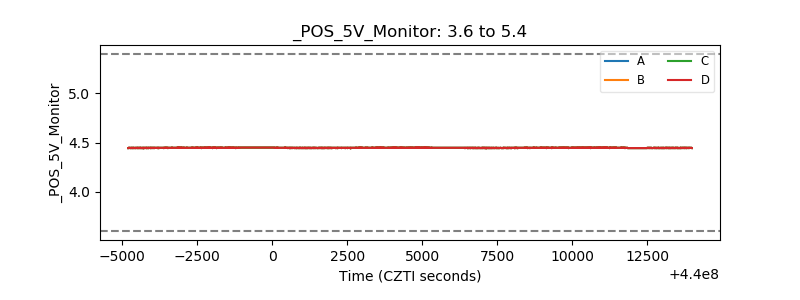 |
| _ROLL_ROT | 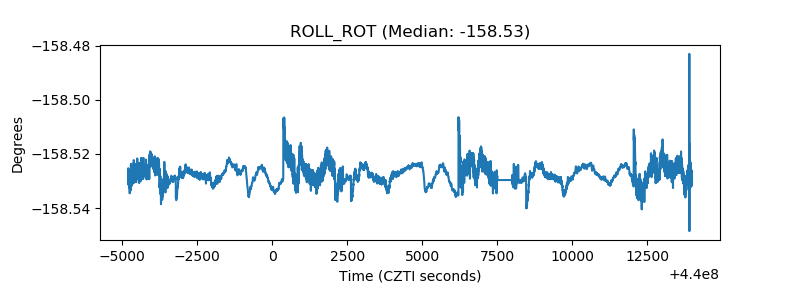 |
| _Roll_DEC | 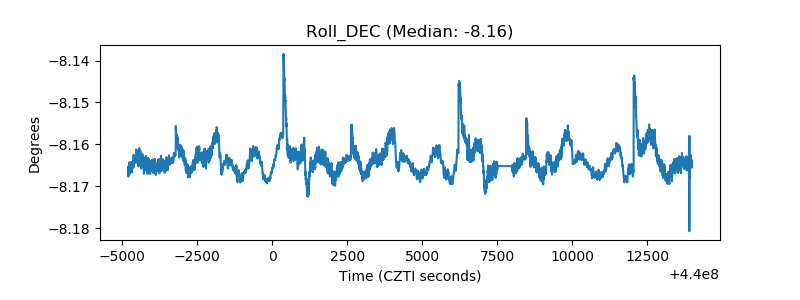 |
| _Roll_RA | 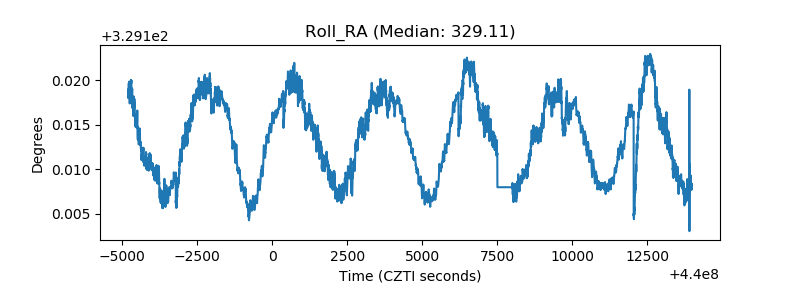 |
| Veto Counter | 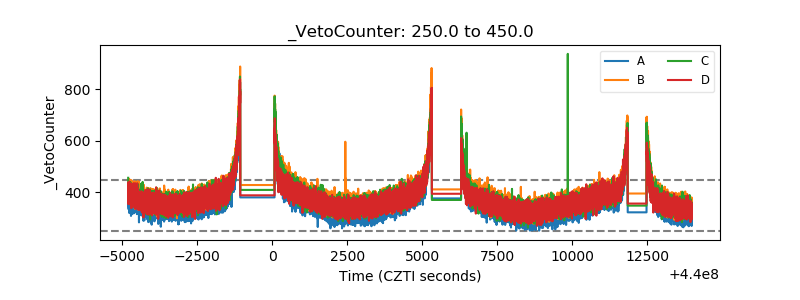 |