| Param | Original file | Final file |
|---|---|---|
| Filename | modeM0/AS1A13_008T06_9000005994_44362cztM0_level2.fits | modeM0/AS1A13_008T06_9000005994_44362cztM0_level2_quad_clean.evt |
| Size (bytes) | 608,094,720 | 122,063,040 |
| Size | 579.9 MB | 116.4 MB |
| Events in quadrant A | 7,491,839 | 782,535 |
| Events in quadrant B | 4,050,131 | 854,978 |
| Events in quadrant C | 3,888,609 | 817,557 |
| Events in quadrant D | 6,480,854 | 704,249 |
| Mode M9 | |||
|---|---|---|---|
| Quadrant | BADHDUFLAG | Total packets | Discarded packets |
| A | 0 | 1 | 0 |
| B | 0 | 1 | 0 |
| C | 0 | 1 | 0 |
| D | 0 | 1 | 0 |
| Mode SS | |||
|---|---|---|---|
| Quadrant | BADHDUFLAG | Total packets | Discarded packets |
| A | 0 | 154 | 0 |
| B | 0 | 154 | 0 |
| C | 0 | 154 | 0 |
| D | 0 | 154 | 0 |
| Mode M0 | |||
|---|---|---|---|
| Quadrant | BADHDUFLAG | Total packets | Discarded packets |
| A | 0 | 28166 | 2 |
| B | 0 | 17222 | 2 |
| C | 0 | 17124 | 2 |
| D | 0 | 24582 | 2 |
| Quadrant | Total seconds | Saturated seconds | Saturation percentage |
|---|---|---|---|
| A | 7718 | 769 | 9.963721% |
| B | 7718 | 157 | 2.034206% |
| C | 7718 | 87 | 1.127235% |
| D | 7719 | 705 | 9.133307% |
Noise dominated data is calculated using 1-second bins in cleaned event files. If a bin has >2000 counts, and if more than 50% of those come from <1% of pixels, then it is considered to be noise-dominated and hence unusable.
| Quadrant | # 1 sec bins | Bins with >0 counts | Bins with >2000 counts | High rate bins dominated by noise | Noise dominated (total time) | Noise dominated (detector-on time) | Marked lightcurve |
|---|---|---|---|---|---|---|---|
| A | 7748 | 7719 | 517 | 517 | 6.67% | 6.70% | 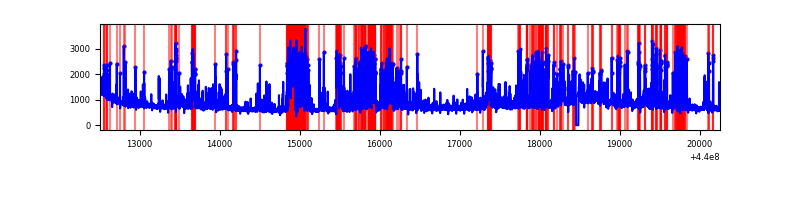 |
| B | 7748 | 7719 | 37 | 37 | 0.48% | 0.48% | 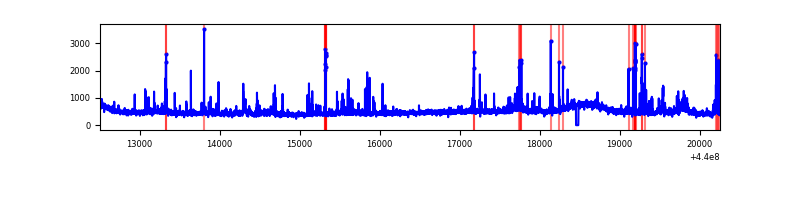 |
| C | 7748 | 7718 | 49 | 49 | 0.63% | 0.63% | 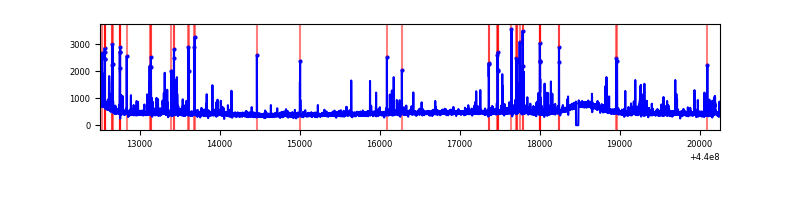 |
| D | 7749 | 7719 | 545 | 545 | 7.03% | 7.06% | 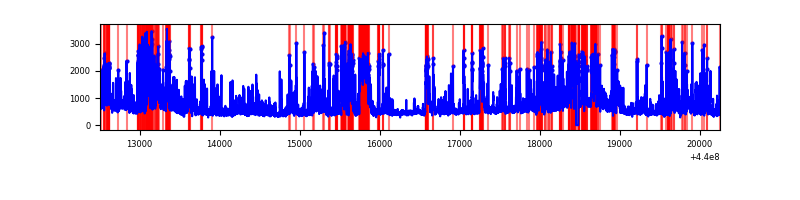 |
Top three noisy pixels from each quadrant. If the there are fewer than three noisy pixels in the level2.evt file, extra rows are filled as -1
| Pixel properties | Quadrant properties | ||||||
|---|---|---|---|---|---|---|---|
| Quadrant | DetID | PixID | Counts | Sigma | Mean | Median | Sigma |
| A | 10 | 83 | 1862525 | 10272.67 | 868 | 848 | 181.2 |
| A | 13 | 248 | 1186672 | 6543.34 | 868 | 848 | 181.2 |
| A | 15 | 223 | 998676 | 5505.98 | 868 | 848 | 181.2 |
| B | 10 | 245 | 167305 | 946.16 | 892 | 863 | 175.9 |
| B | 5 | 255 | 130867 | 739.03 | 892 | 863 | 175.9 |
| B | 5 | 172 | 59486 | 333.25 | 892 | 863 | 175.9 |
| C | 14 | 254 | 335759 | 1625.0 | 868 | 870 | 206.1 |
| C | 14 | 96 | 53313 | 254.47 | 868 | 870 | 206.1 |
| C | 0 | 207 | 45791 | 217.97 | 868 | 870 | 206.1 |
| D | 4 | 221 | 851368 | 4025.31 | 836 | 812 | 211.3 |
| D | 1 | 52 | 725277 | 3428.58 | 836 | 812 | 211.3 |
| D | 5 | 222 | 468423 | 2213.0 | 836 | 812 | 211.3 |
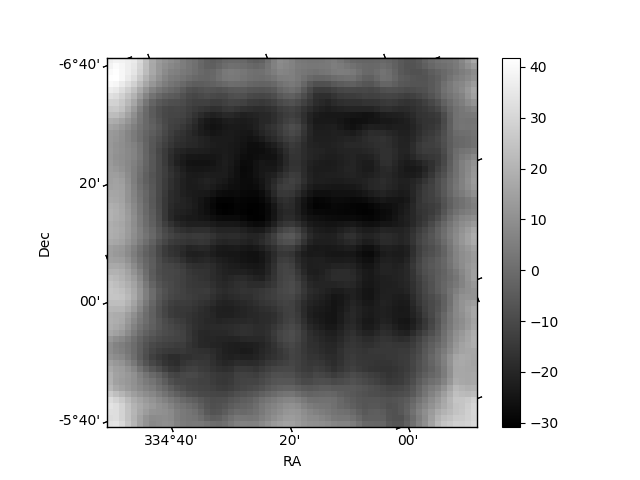
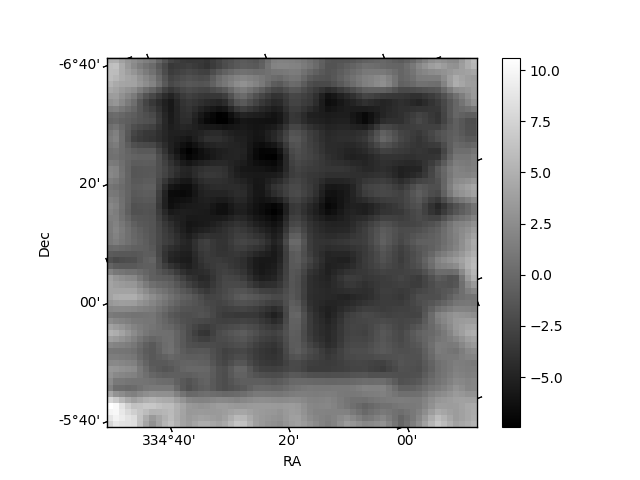
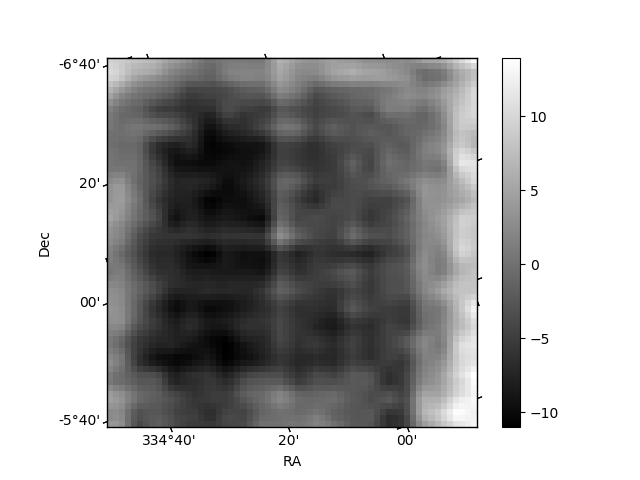
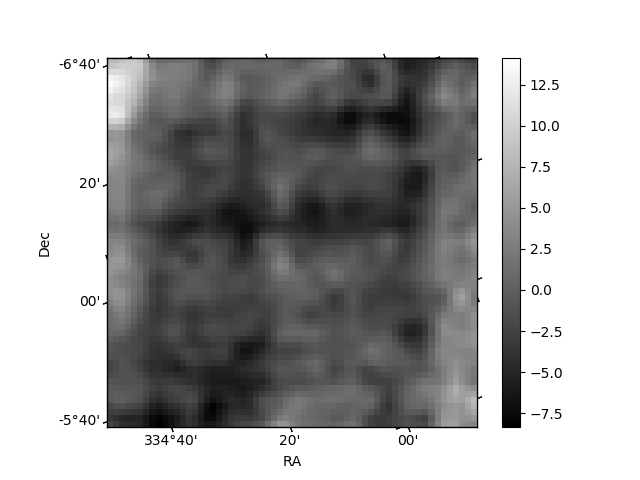
Histogram calculated using DETX and DETY for each event in the final _common_clean file
| Quadrant A | 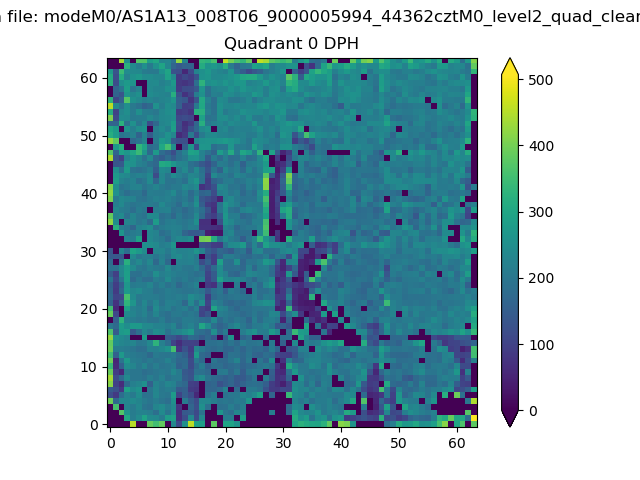 |
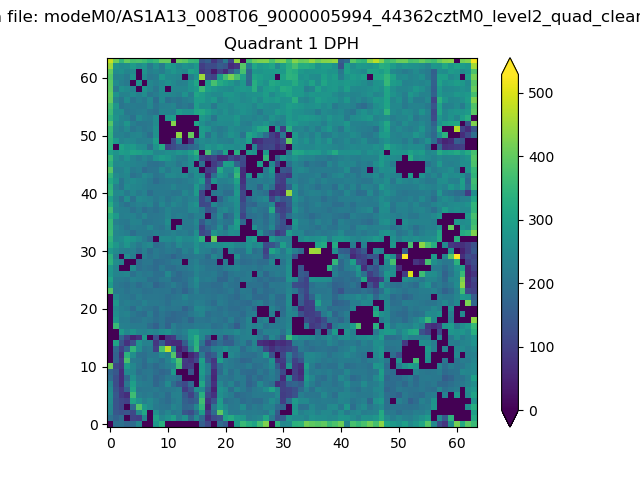 |
Quadrant B |
|---|---|---|---|
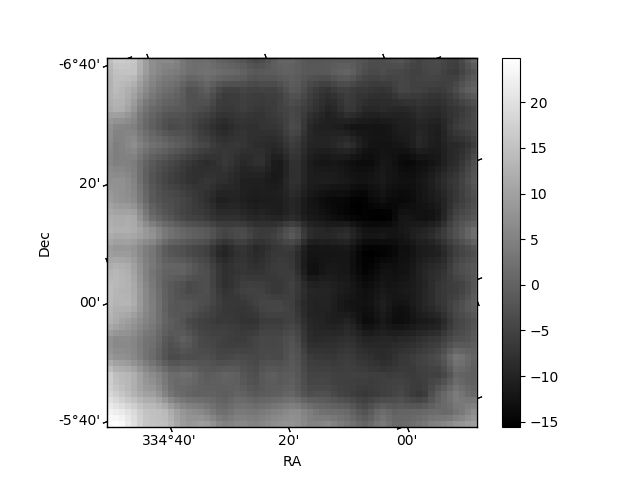
| Quadrant D | 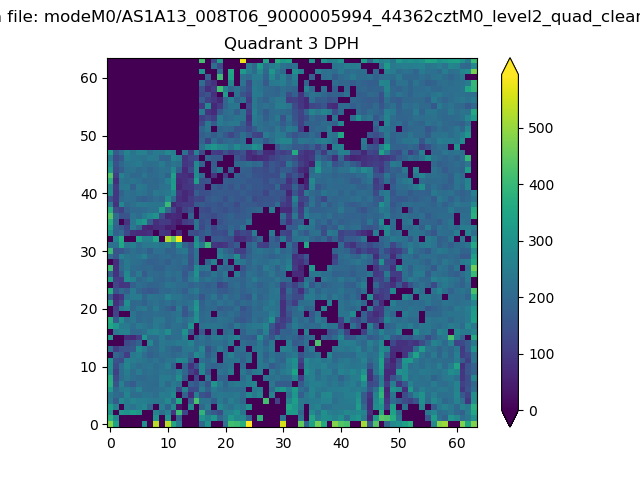 |
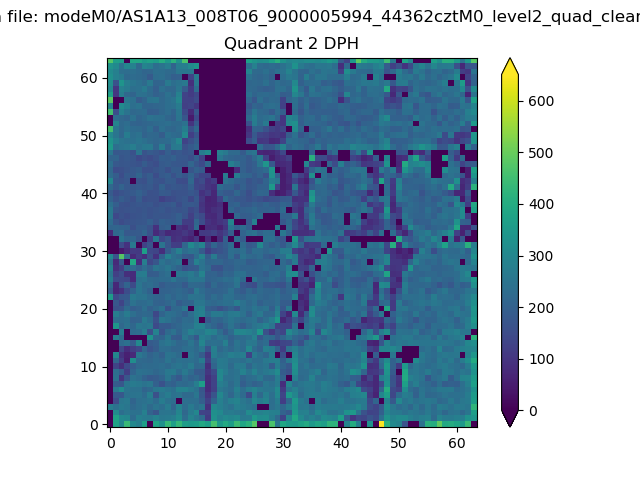 |
Quadrant C |
| Plot type | Count rate plots | Images |
|---|---|---|
| Comparison with Poisson distribution Blue bars denote a histogram of data divided into 1 sec bins. Red curve is a Poisson curve with rate = median count rate of data. |
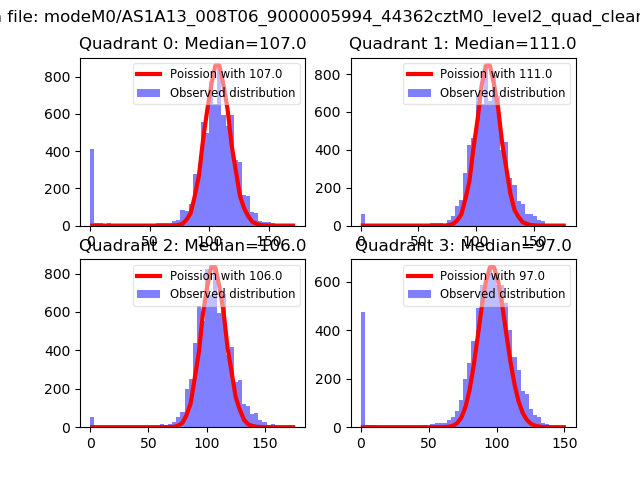 |
 |
| Quadrant-wise count rates Data is divided into 100 sec bins |
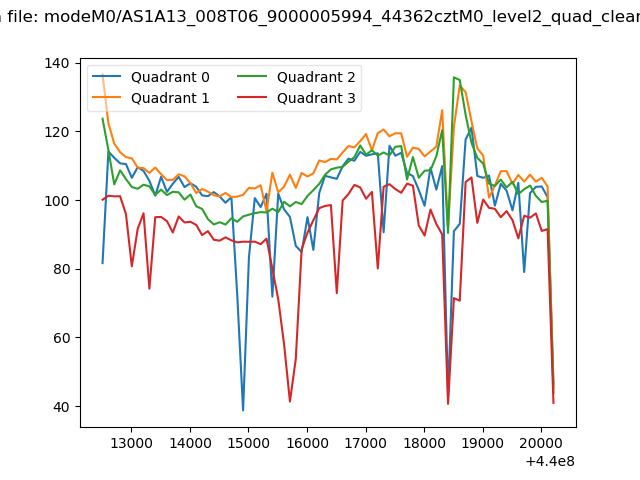 |
|
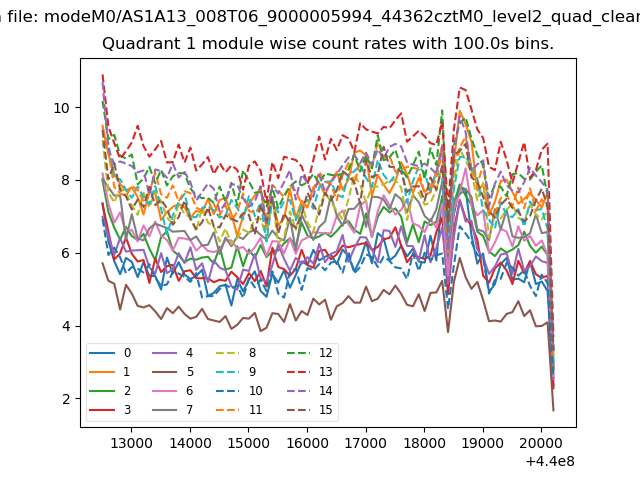
| Module-wise count rates for Quadrant A Data is divided into 100 sec bins |
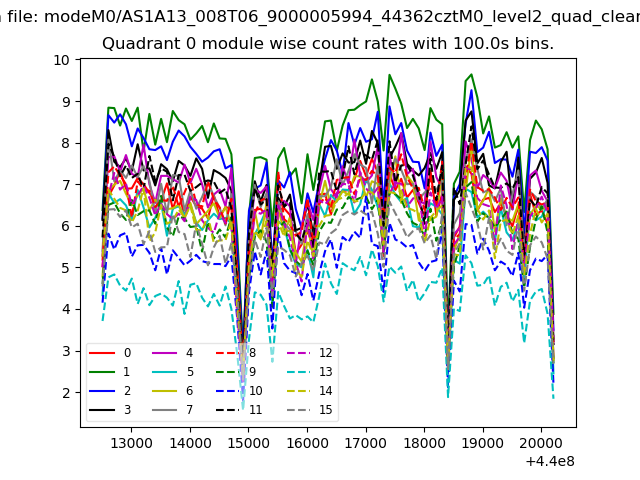 |
 |
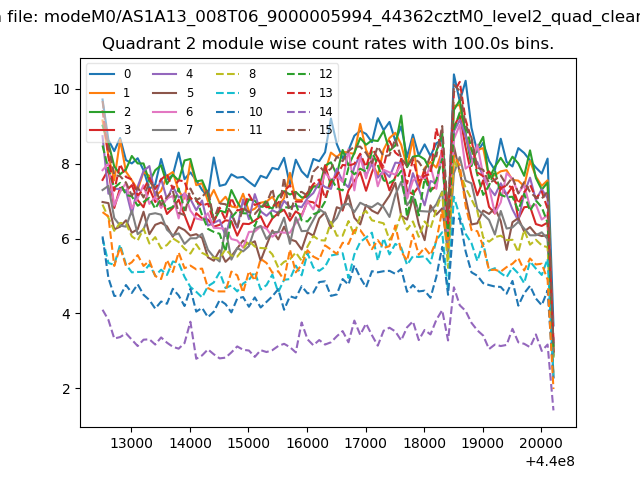
| Module-wise count rates for Quadrant B Data is divided into 100 sec bins |
 |
 |
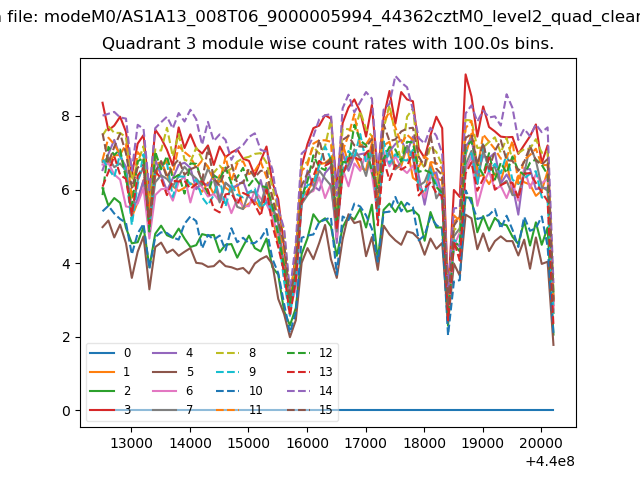
| Module-wise count rates for Quadrant C Data is divided into 100 sec bins |
 |
 |
| Module-wise count rates for Quadrant D Data is divided into 100 sec bins |
 |
 |
| Parameter | Plot |
|---|---|
| CZT HV Monitor | 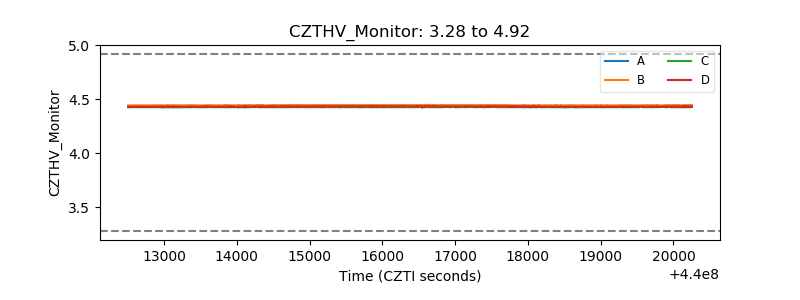 |
| D_VDD | 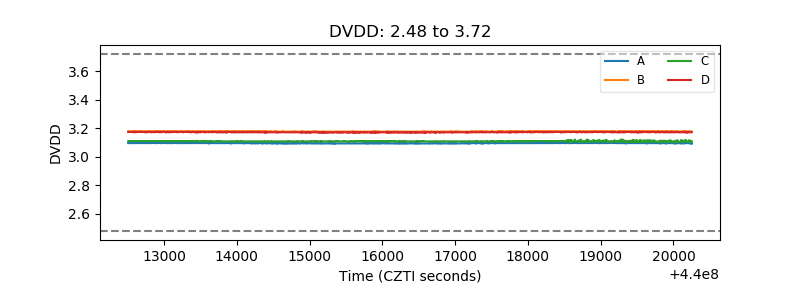 |
| Temperature 1 | 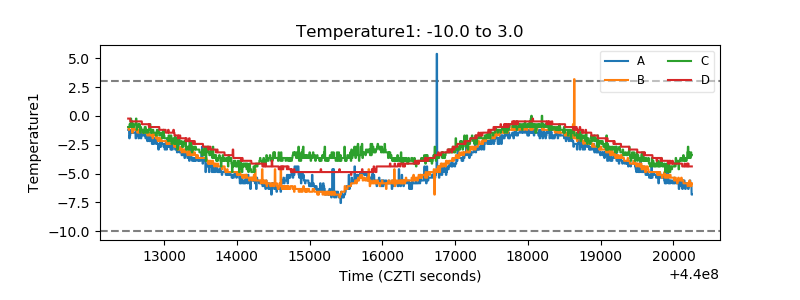 |
| Veto HV Monitor | 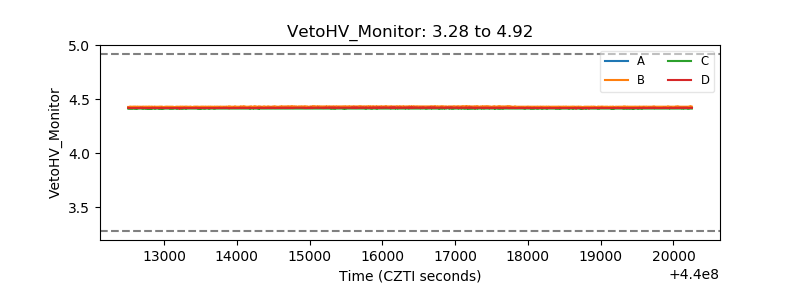 |
| Veto LLD | 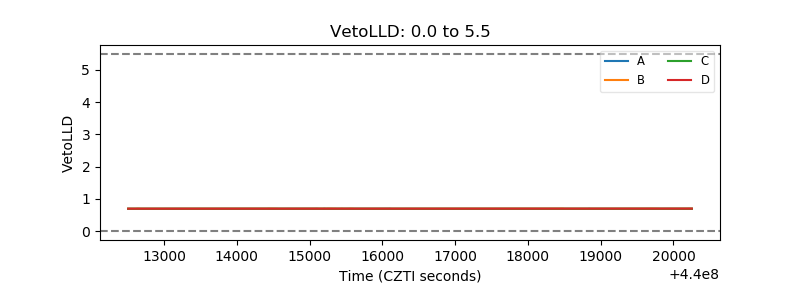 |
| Alpha Counter | 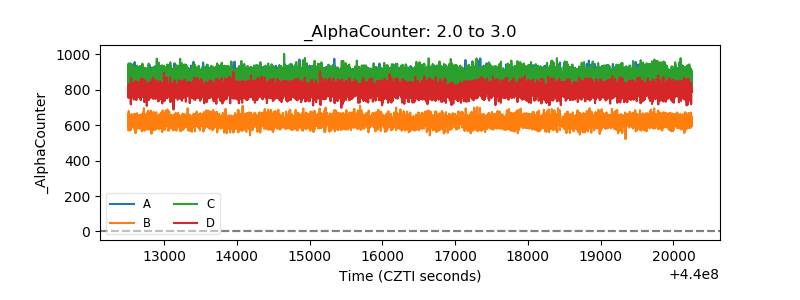 |
| _CPM_Rate | 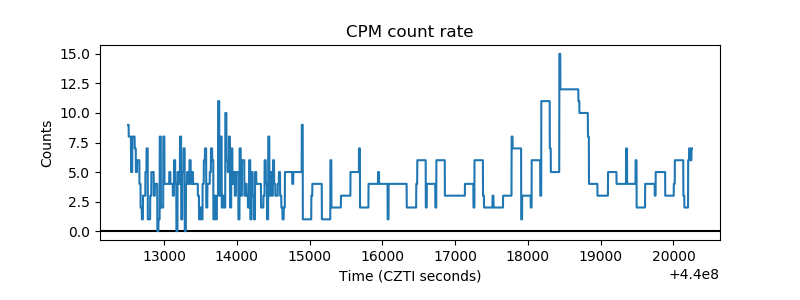 |
| CZT Counter | 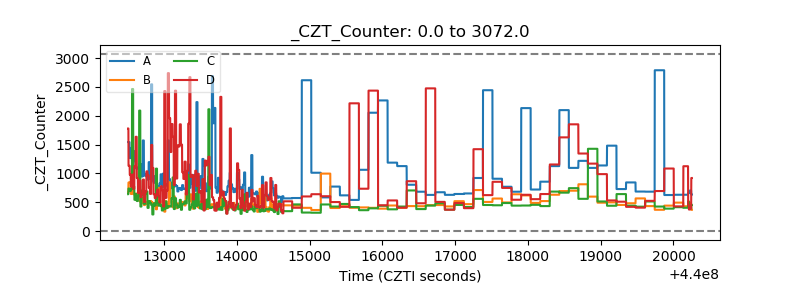 |
| +2.5 Volts monitor | 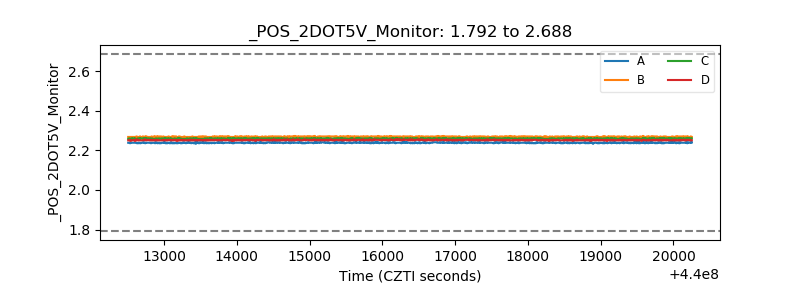 |
| +5 Volts monitor | 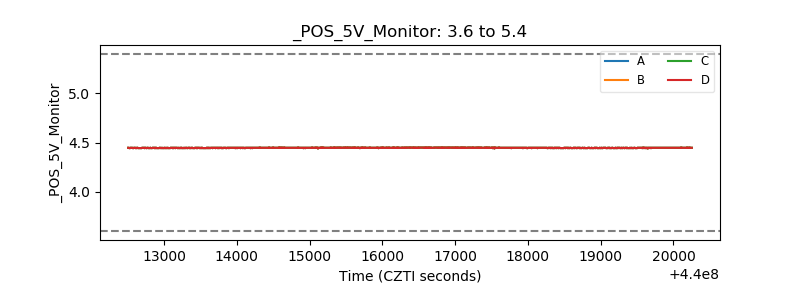 |
| _ROLL_ROT | 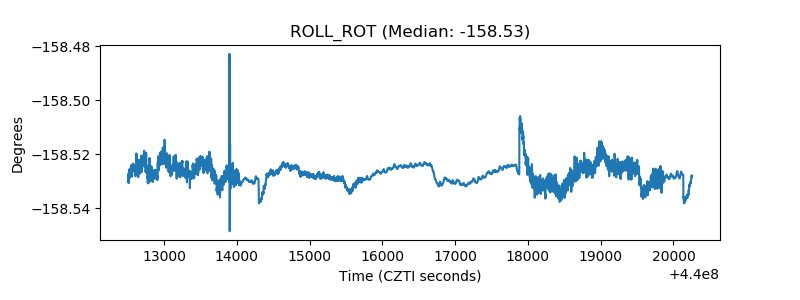 |
| _Roll_DEC | 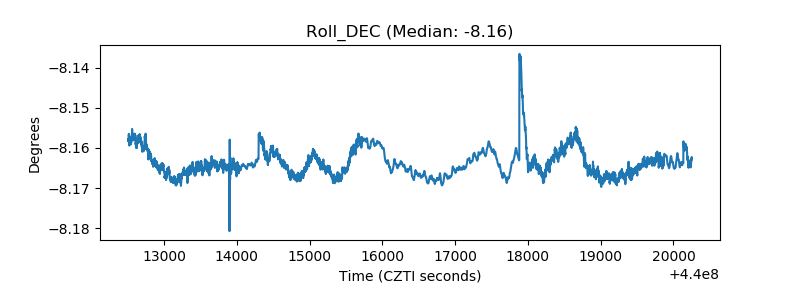 |
| _Roll_RA | 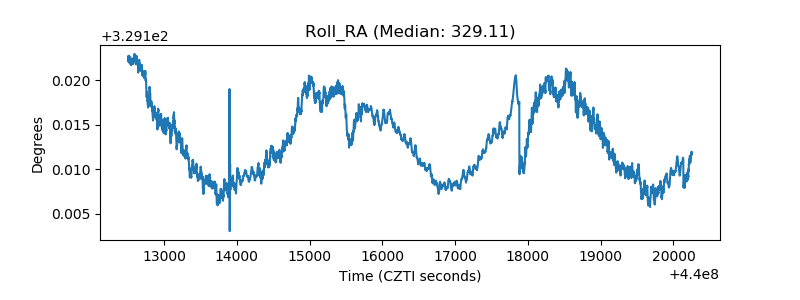 |
| Veto Counter | 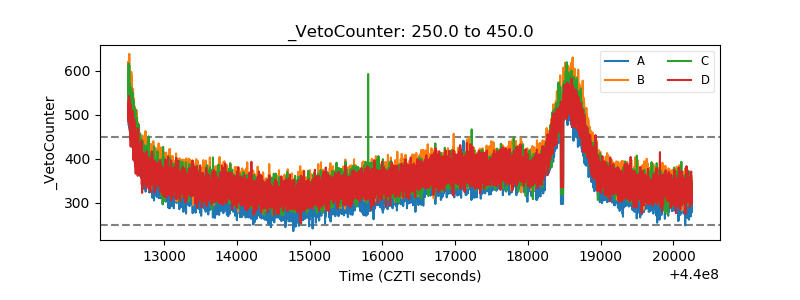 |