| Param | Original file | Final file |
|---|---|---|
| Filename | modeM0/AS1A13_008T06_9000005994_44363cztM0_level2.fits | modeM0/AS1A13_008T06_9000005994_44363cztM0_level2_quad_clean.evt |
| Size (bytes) | 647,064,000 | 129,916,800 |
| Size | 617.1 MB | 123.9 MB |
| Events in quadrant A | 7,641,645 | 832,951 |
| Events in quadrant B | 4,788,470 | 893,309 |
| Events in quadrant C | 4,280,743 | 876,675 |
| Events in quadrant D | 6,596,117 | 752,742 |
| Mode M9 | |||
|---|---|---|---|
| Quadrant | BADHDUFLAG | Total packets | Discarded packets |
| A | 0 | 1 | 0 |
| B | 0 | 1 | 0 |
| C | 0 | 1 | 0 |
| D | 0 | 1 | 0 |
| Mode SS | |||
|---|---|---|---|
| Quadrant | BADHDUFLAG | Total packets | Discarded packets |
| A | 0 | 166 | 0 |
| B | 0 | 166 | 0 |
| C | 0 | 166 | 0 |
| D | 0 | 166 | 0 |
| Mode M0 | |||
|---|---|---|---|
| Quadrant | BADHDUFLAG | Total packets | Discarded packets |
| A | 0 | 29263 | 1 |
| B | 0 | 20014 | 1 |
| C | 0 | 18734 | 1 |
| D | 0 | 25325 | 1 |
| Quadrant | Total seconds | Saturated seconds | Saturation percentage |
|---|---|---|---|
| A | 8320 | 838 | 10.072115% |
| B | 8320 | 390 | 4.687500% |
| C | 8321 | 118 | 1.418099% |
| D | 8321 | 730 | 8.772984% |
Noise dominated data is calculated using 1-second bins in cleaned event files. If a bin has >2000 counts, and if more than 50% of those come from <1% of pixels, then it is considered to be noise-dominated and hence unusable.
| Quadrant | # 1 sec bins | Bins with >0 counts | Bins with >2000 counts | High rate bins dominated by noise | Noise dominated (total time) | Noise dominated (detector-on time) | Marked lightcurve |
|---|---|---|---|---|---|---|---|
| A | 8350 | 8321 | 624 | 624 | 7.47% | 7.50% | 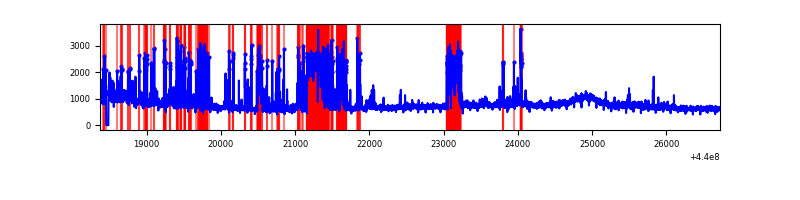 |
| B | 8350 | 8321 | 199 | 199 | 2.38% | 2.39% | 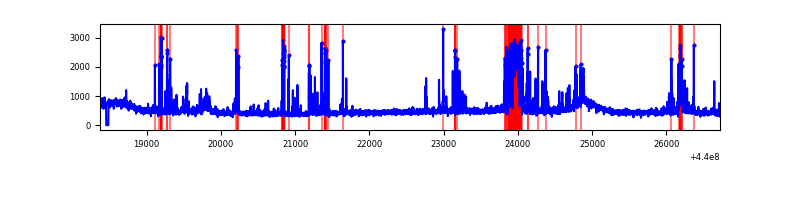 |
| C | 8351 | 8321 | 79 | 79 | 0.95% | 0.95% | 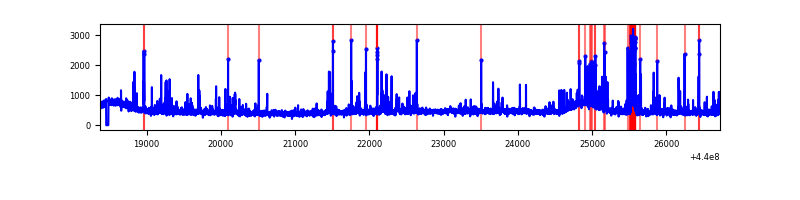 |
| D | 8351 | 8321 | 550 | 550 | 6.59% | 6.61% | 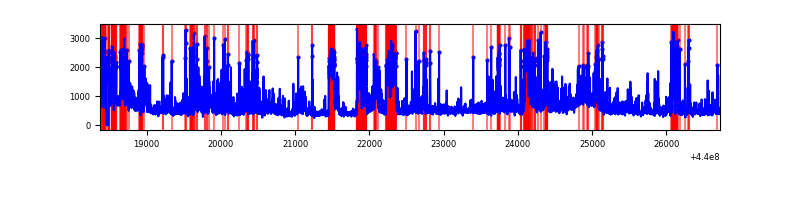 |
Top three noisy pixels from each quadrant. If the there are fewer than three noisy pixels in the level2.evt file, extra rows are filled as -1
| Pixel properties | Quadrant properties | ||||||
|---|---|---|---|---|---|---|---|
| Quadrant | DetID | PixID | Counts | Sigma | Mean | Median | Sigma |
| A | 10 | 83 | 1893085 | 9639.18 | 934 | 915 | 196.3 |
| A | 13 | 248 | 1257715 | 6402.45 | 934 | 915 | 196.3 |
| A | 15 | 223 | 793317 | 4036.69 | 934 | 915 | 196.3 |
| B | 3 | 112 | 344526 | 1810.19 | 958 | 927 | 189.8 |
| B | 0 | 219 | 174618 | 915.06 | 958 | 927 | 189.8 |
| B | 5 | 172 | 171380 | 898.0 | 958 | 927 | 189.8 |
| C | 14 | 254 | 482952 | 2135.43 | 948 | 951 | 225.7 |
| C | 14 | 96 | 35671 | 153.82 | 948 | 951 | 225.7 |
| C | 3 | 233 | 22017 | 93.33 | 948 | 951 | 225.7 |
| D | 4 | 221 | 1366326 | 5912.78 | 913 | 883 | 230.9 |
| D | 5 | 235 | 508379 | 2197.61 | 913 | 883 | 230.9 |
| D | 1 | 52 | 329426 | 1422.69 | 913 | 883 | 230.9 |
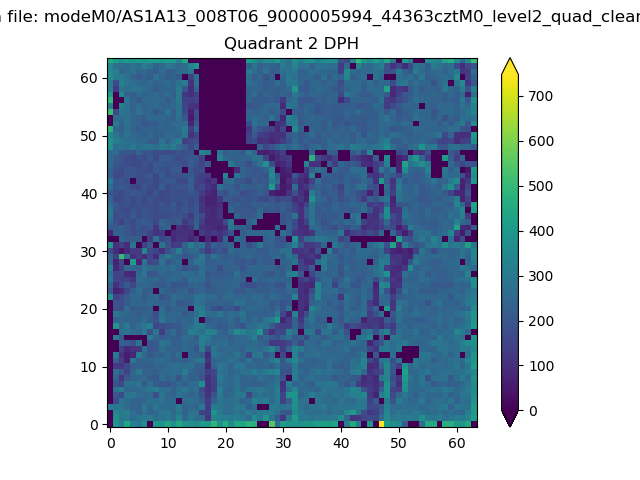
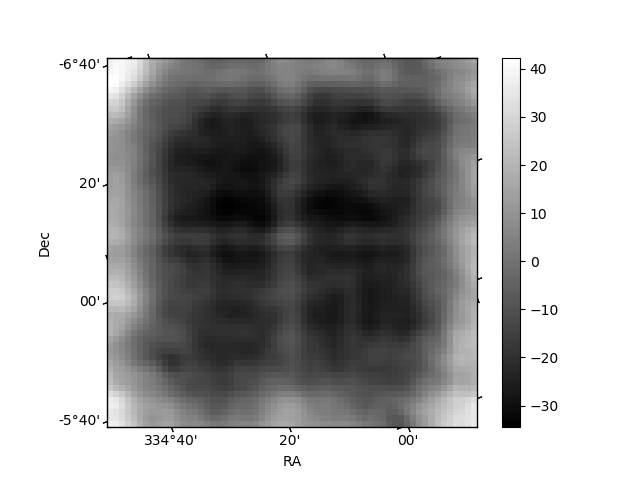
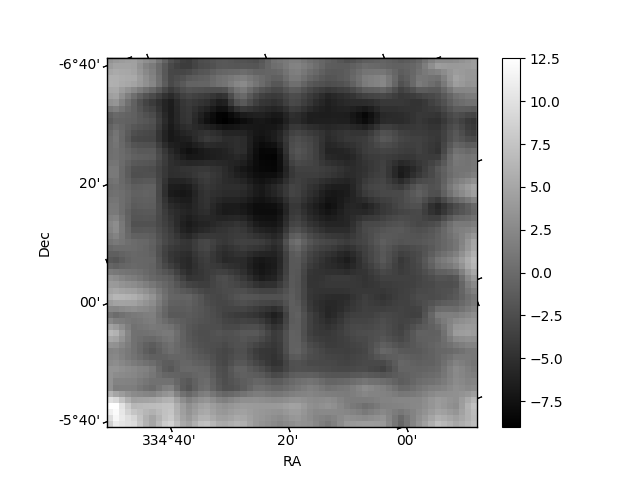
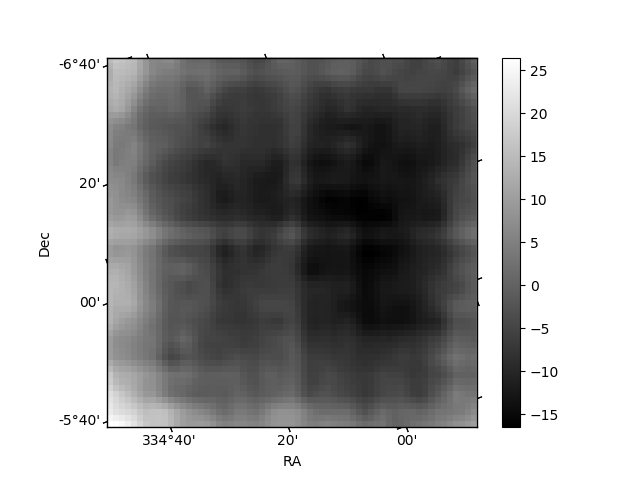
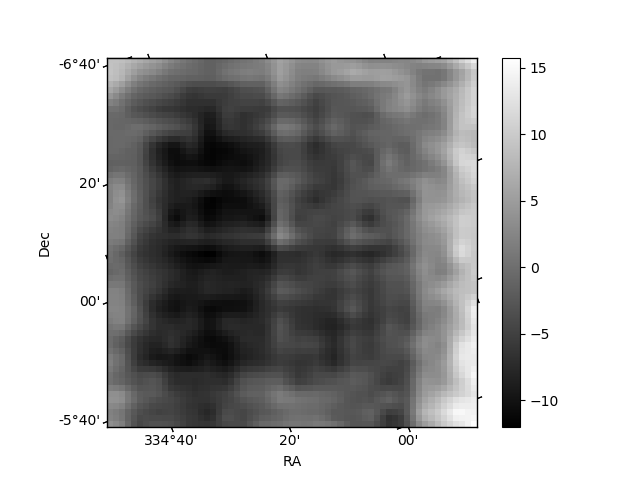
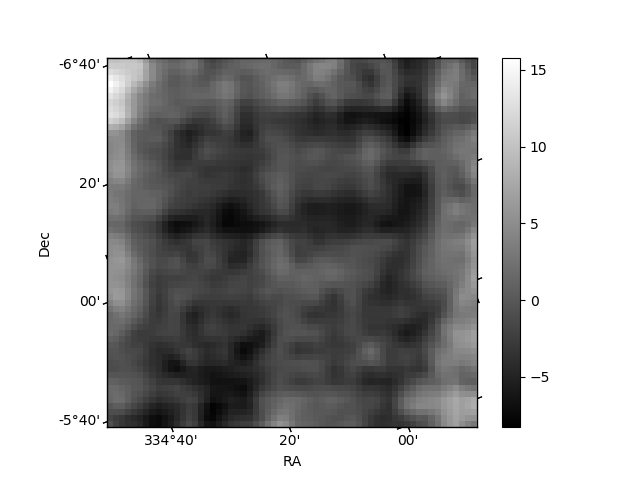
Histogram calculated using DETX and DETY for each event in the final _common_clean file
| Quadrant A | 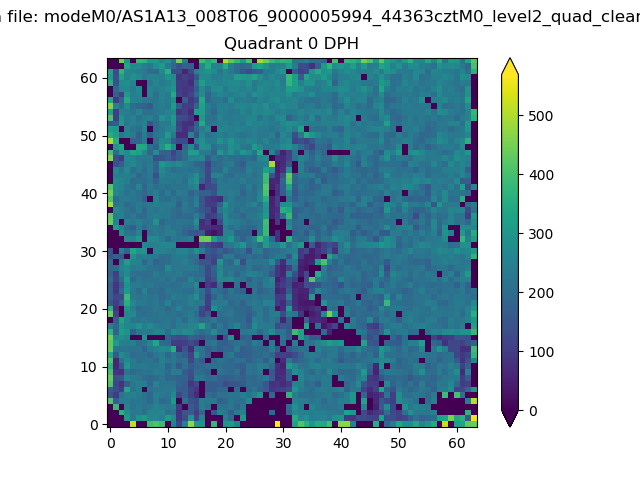 |
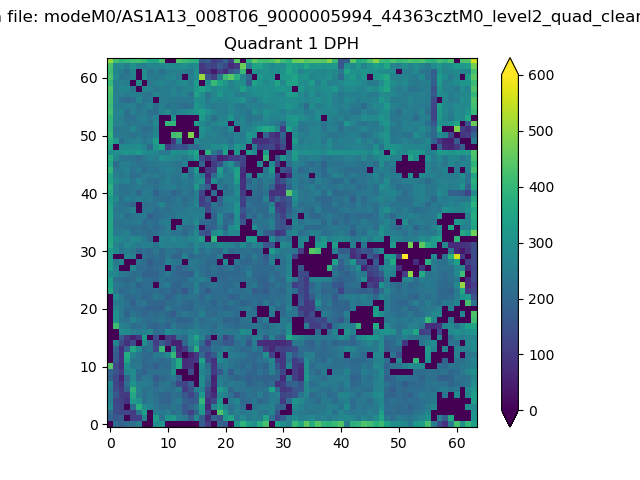 |
Quadrant B |
|---|---|---|---|
| Quadrant D | 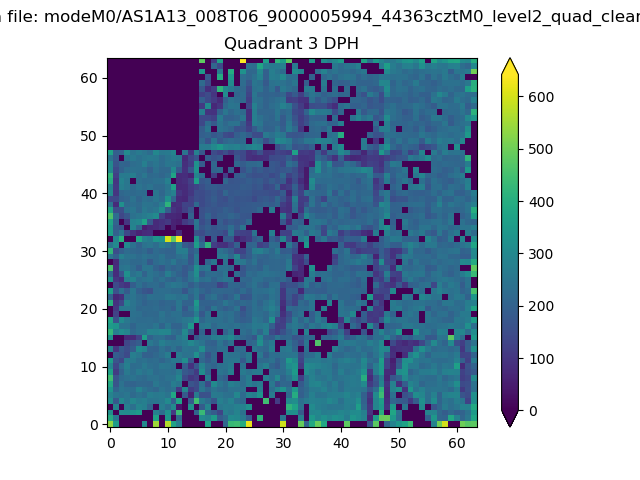 |
 |
Quadrant C |
| Plot type | Count rate plots | Images |
|---|---|---|
| Comparison with Poisson distribution Blue bars denote a histogram of data divided into 1 sec bins. Red curve is a Poisson curve with rate = median count rate of data. |
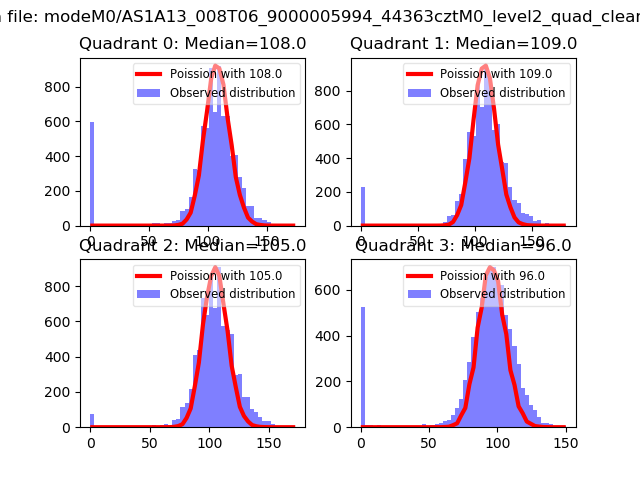 |
 |
| Quadrant-wise count rates Data is divided into 100 sec bins |
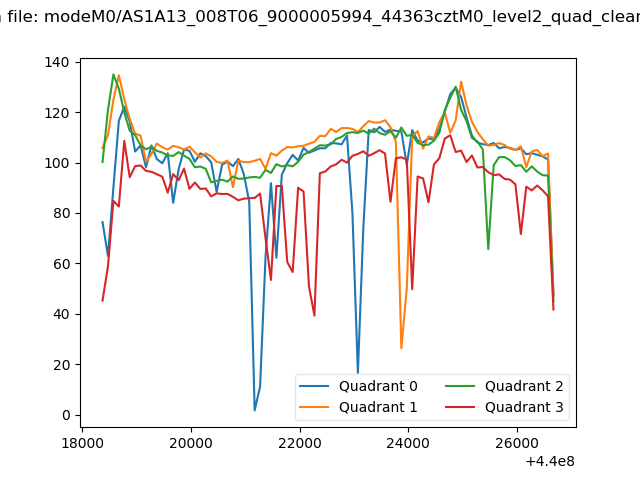 |
|
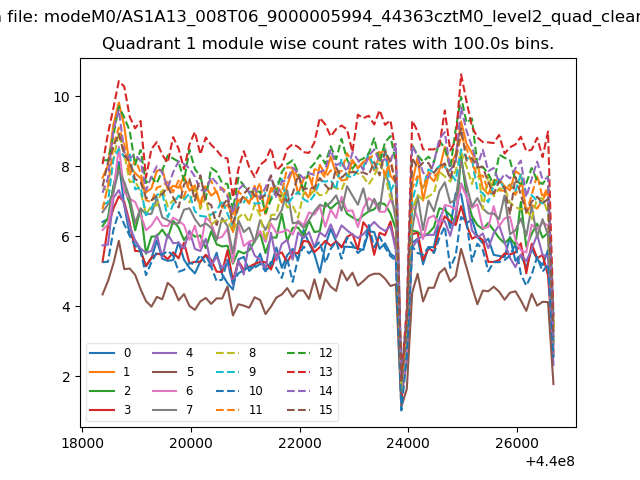
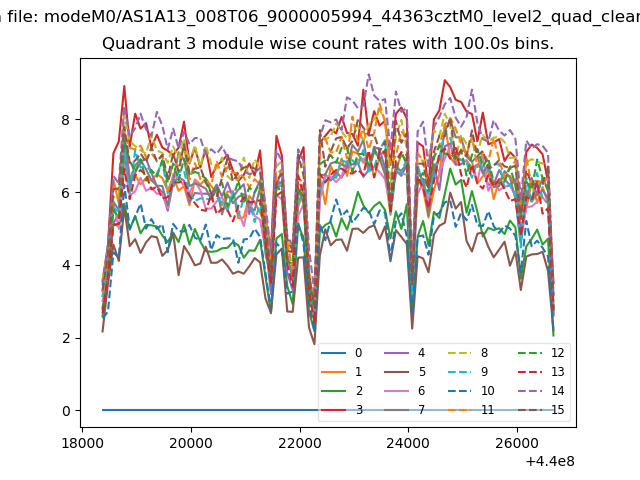
| Module-wise count rates for Quadrant A Data is divided into 100 sec bins |
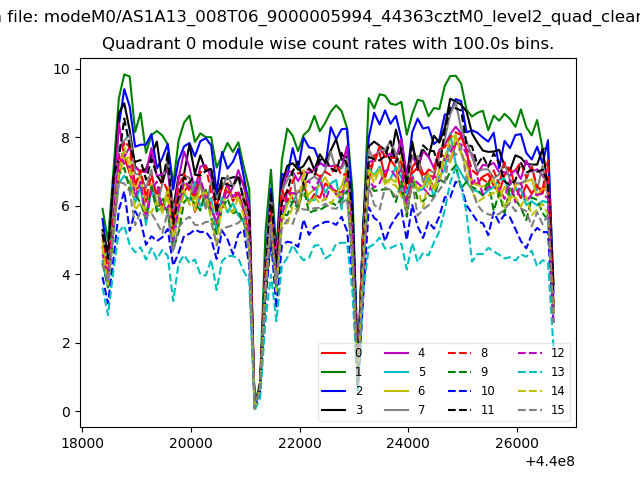 |
 |
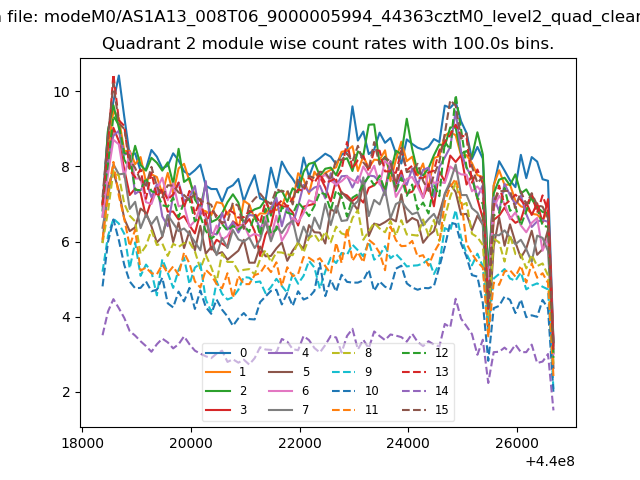
| Module-wise count rates for Quadrant B Data is divided into 100 sec bins |
 |
 |
| Module-wise count rates for Quadrant C Data is divided into 100 sec bins |
 |
 |
| Module-wise count rates for Quadrant D Data is divided into 100 sec bins |
 |
 |
| Parameter | Plot |
|---|---|
| CZT HV Monitor | 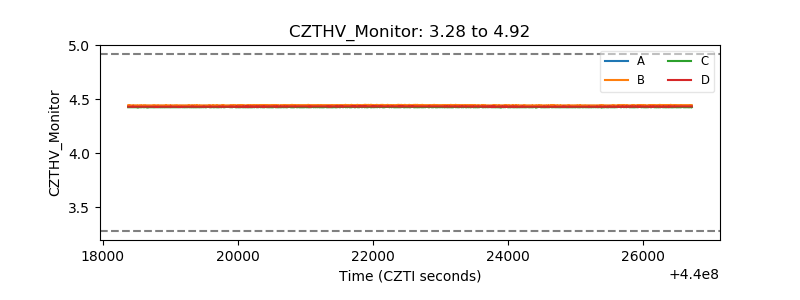 |
| D_VDD | 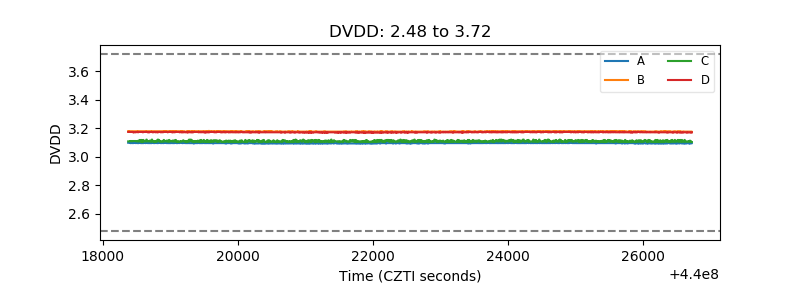 |
| Temperature 1 | 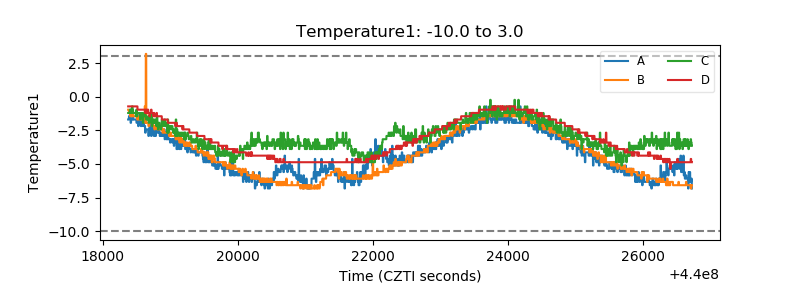 |
| Veto HV Monitor | 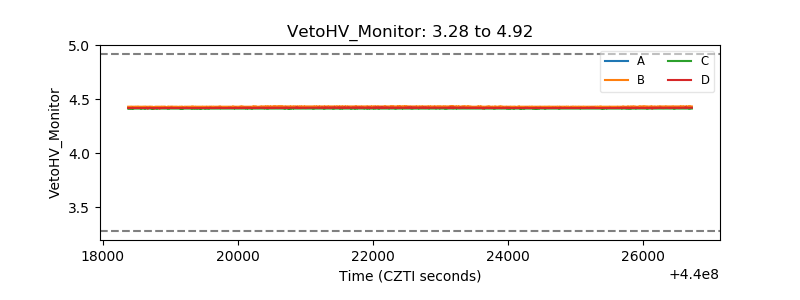 |
| Veto LLD | 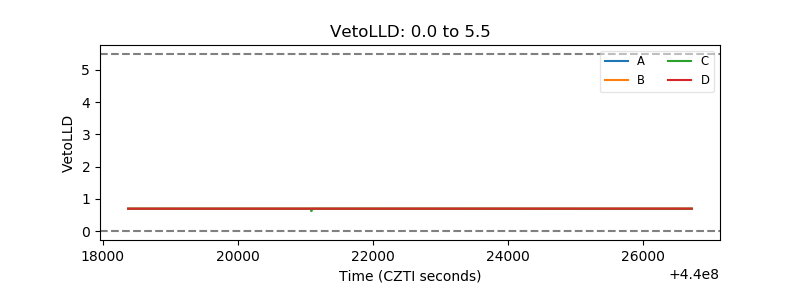 |
| Alpha Counter |  |
| _CPM_Rate | 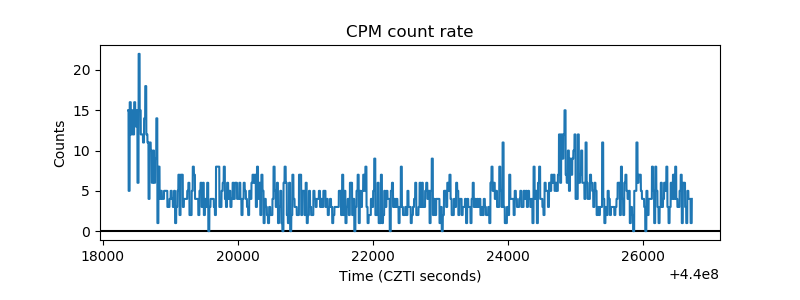 |
| CZT Counter | 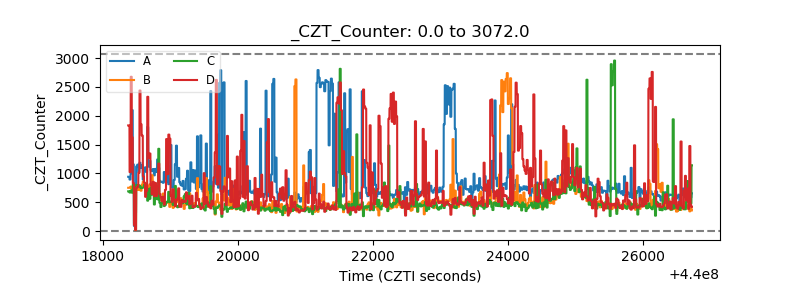 |
| +2.5 Volts monitor | 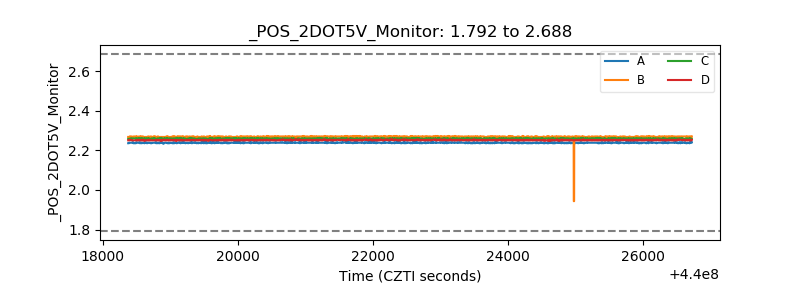 |
| +5 Volts monitor | 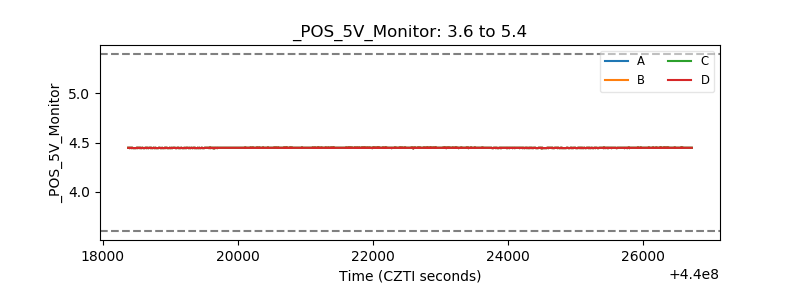 |
| _ROLL_ROT | 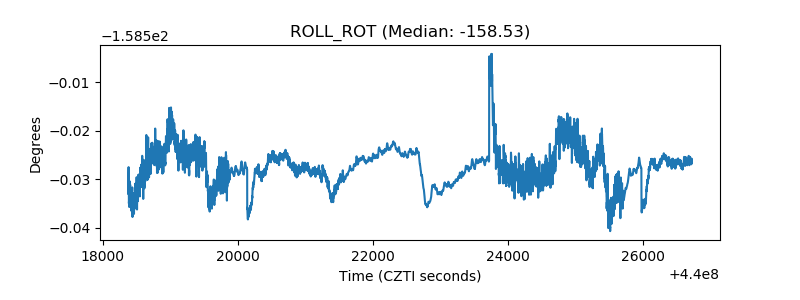 |
| _Roll_DEC | 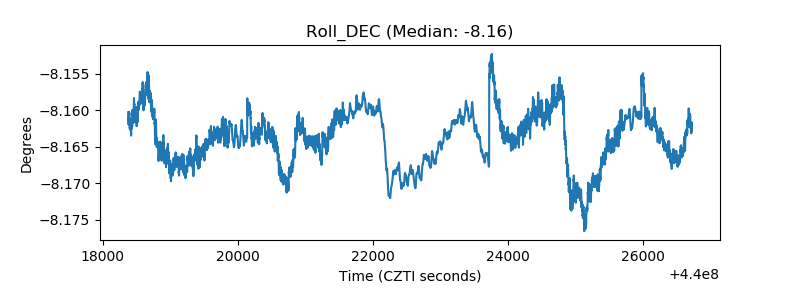 |
| _Roll_RA | 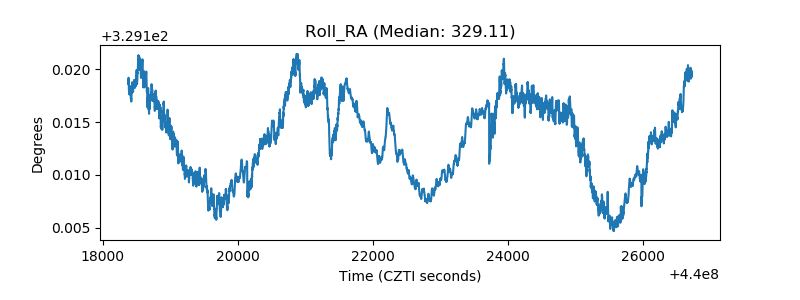 |
| Veto Counter | 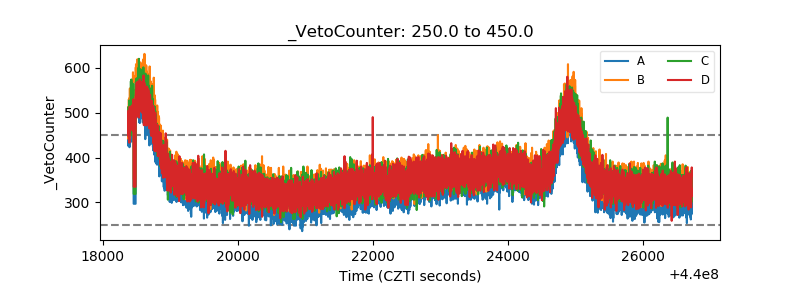 |