| Param | Original file | Final file |
|---|---|---|
| Filename | modeM0/AS1A13_008T06_9000005994_44364cztM0_level2.fits | modeM0/AS1A13_008T06_9000005994_44364cztM0_level2_quad_clean.evt |
| Size (bytes) | 564,969,600 | 123,301,440 |
| Size | 538.8 MB | 117.6 MB |
| Events in quadrant A | 6,832,769 | 791,838 |
| Events in quadrant B | 4,107,714 | 841,950 |
| Events in quadrant C | 4,292,682 | 805,969 |
| Events in quadrant D | 5,067,568 | 743,677 |
| Mode M9 | |||
|---|---|---|---|
| Quadrant | BADHDUFLAG | Total packets | Discarded packets |
| A | 0 | 1 | 0 |
| B | 0 | 1 | 0 |
| C | 0 | 1 | 0 |
| D | 0 | 1 | 0 |
| Mode SS | |||
|---|---|---|---|
| Quadrant | BADHDUFLAG | Total packets | Discarded packets |
| A | 0 | 162 | 0 |
| B | 0 | 162 | 0 |
| C | 0 | 162 | 0 |
| D | 0 | 162 | 0 |
| Mode M0 | |||
|---|---|---|---|
| Quadrant | BADHDUFLAG | Total packets | Discarded packets |
| A | 0 | 26593 | 2 |
| B | 0 | 17648 | 2 |
| C | 0 | 18396 | 2 |
| D | 0 | 20446 | 2 |
| Quadrant | Total seconds | Saturated seconds | Saturation percentage |
|---|---|---|---|
| A | 7897 | 553 | 7.002659% |
| B | 7898 | 273 | 3.456571% |
| C | 7898 | 248 | 3.140035% |
| D | 7898 | 238 | 3.013421% |
Noise dominated data is calculated using 1-second bins in cleaned event files. If a bin has >2000 counts, and if more than 50% of those come from <1% of pixels, then it is considered to be noise-dominated and hence unusable.
| Quadrant | # 1 sec bins | Bins with >0 counts | Bins with >2000 counts | High rate bins dominated by noise | Noise dominated (total time) | Noise dominated (detector-on time) | Marked lightcurve |
|---|---|---|---|---|---|---|---|
| A | 8037 | 7898 | 345 | 345 | 4.29% | 4.37% | 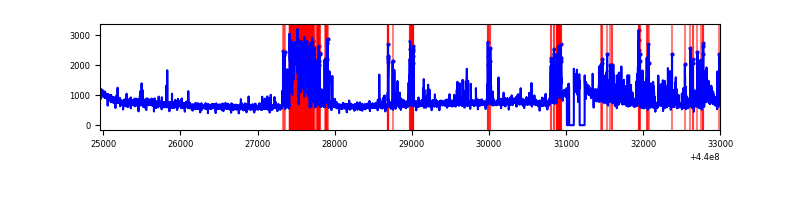 |
| B | 8038 | 7900 | 94 | 94 | 1.17% | 1.19% | 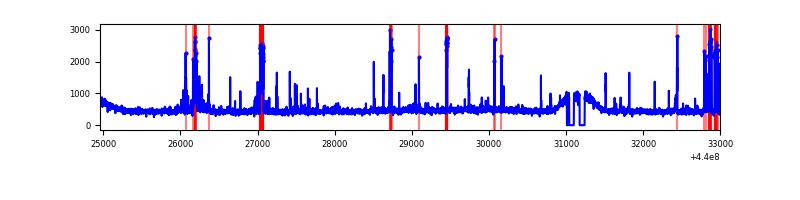 |
| C | 8038 | 7900 | 125 | 125 | 1.56% | 1.58% | 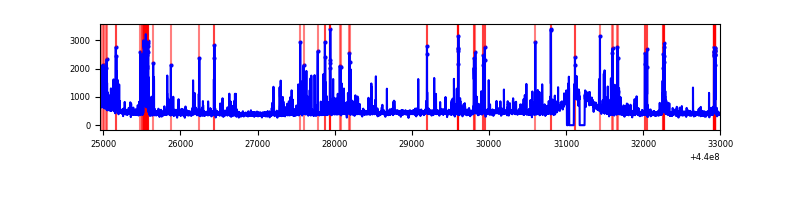 |
| D | 8038 | 7901 | 159 | 159 | 1.98% | 2.01% | 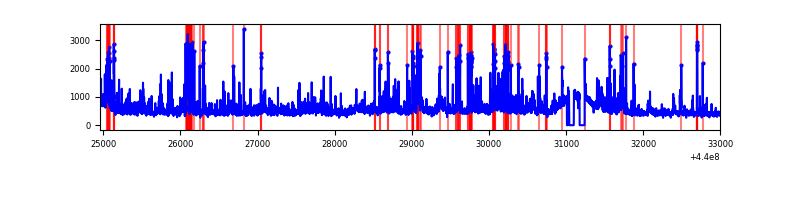 |
Top three noisy pixels from each quadrant. If the there are fewer than three noisy pixels in the level2.evt file, extra rows are filled as -1
| Pixel properties | Quadrant properties | ||||||
|---|---|---|---|---|---|---|---|
| Quadrant | DetID | PixID | Counts | Sigma | Mean | Median | Sigma |
| A | 10 | 83 | 1707660 | 9172.41 | 887 | 867 | 186.1 |
| A | 13 | 248 | 880702 | 4728.28 | 887 | 867 | 186.1 |
| A | 15 | 223 | 691842 | 3713.34 | 887 | 867 | 186.1 |
| B | 5 | 172 | 204908 | 1126.84 | 903 | 874 | 181.1 |
| B | 3 | 112 | 88056 | 481.49 | 903 | 874 | 181.1 |
| B | 5 | 255 | 69724 | 380.25 | 903 | 874 | 181.1 |
| C | 14 | 254 | 693407 | 3272.1 | 884 | 891 | 211.6 |
| C | 1 | 3 | 49882 | 231.48 | 884 | 891 | 211.6 |
| C | 3 | 233 | 33339 | 153.31 | 884 | 891 | 211.6 |
| D | 5 | 235 | 281393 | 1249.73 | 884 | 857 | 224.5 |
| D | 2 | 153 | 228033 | 1012.02 | 884 | 857 | 224.5 |
| D | 4 | 221 | 207895 | 922.31 | 884 | 857 | 224.5 |
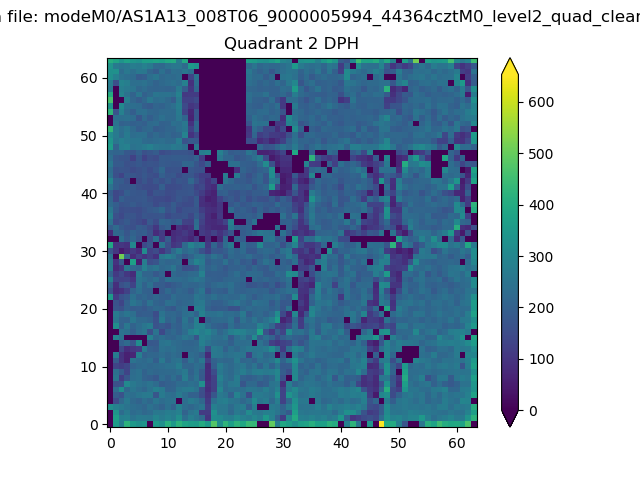
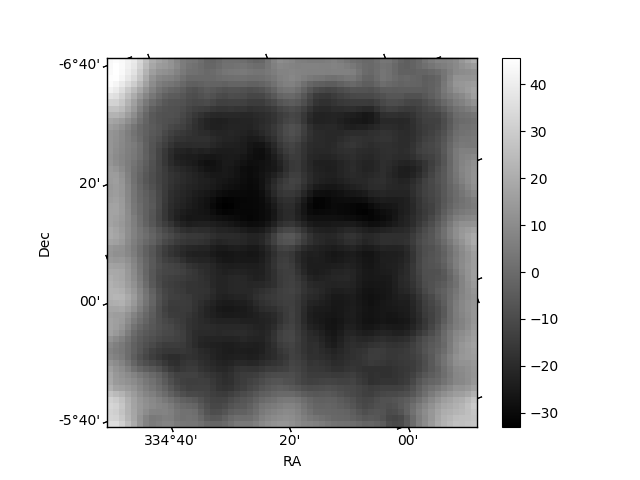
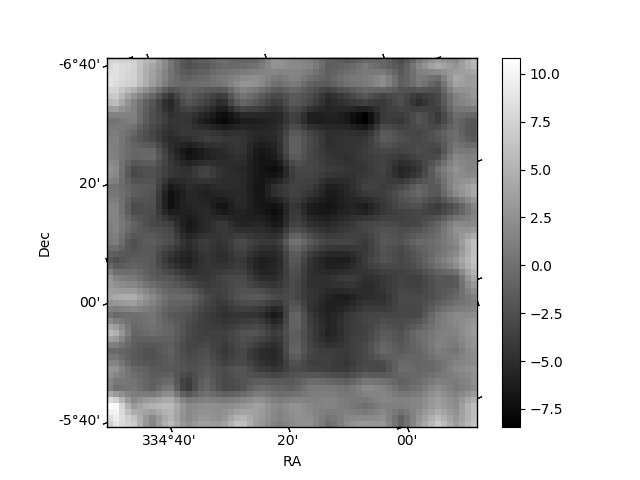
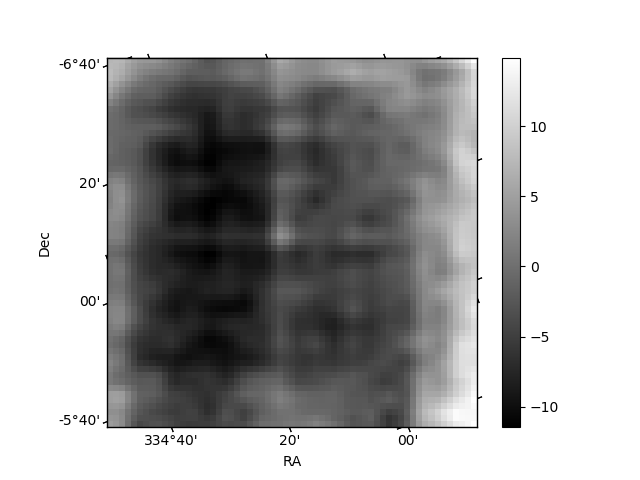
Histogram calculated using DETX and DETY for each event in the final _common_clean file
| Quadrant A | 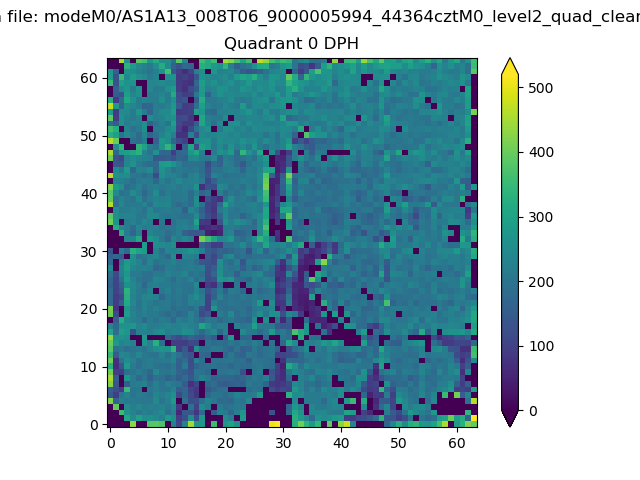 |
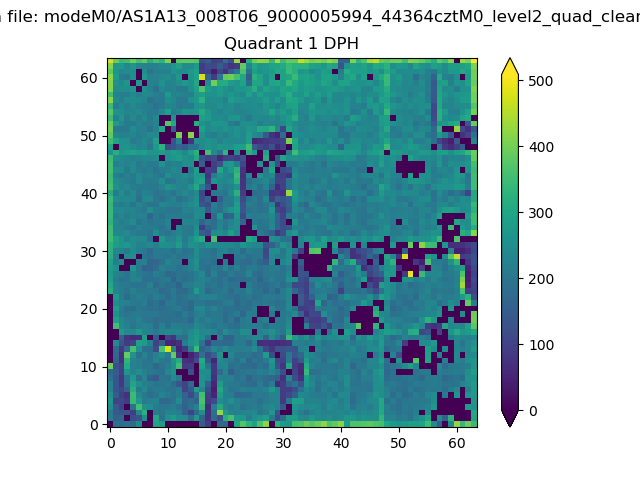 |
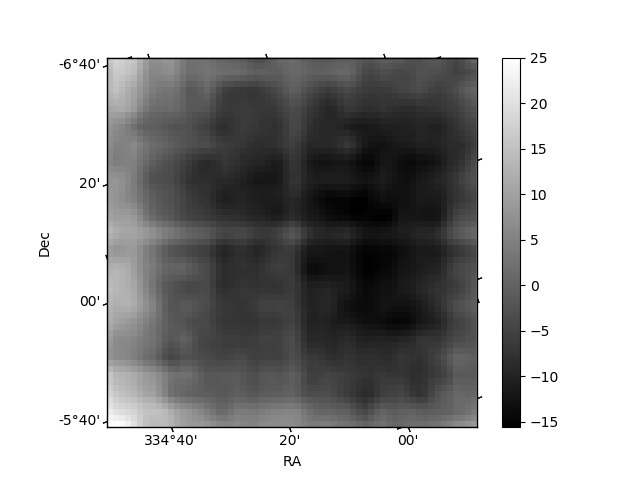
Quadrant B |
|---|---|---|---|
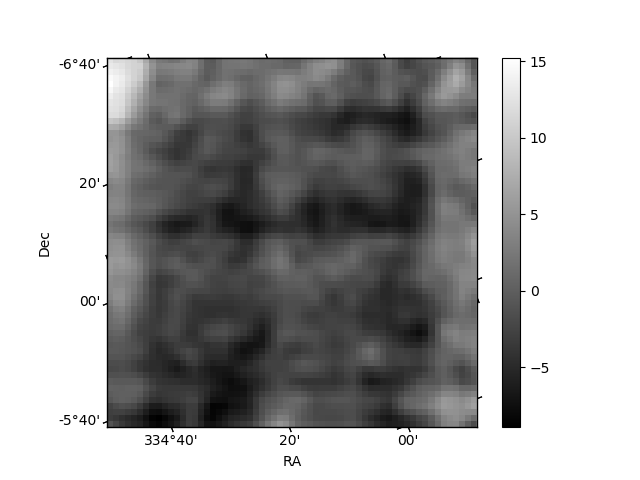
| Quadrant D | 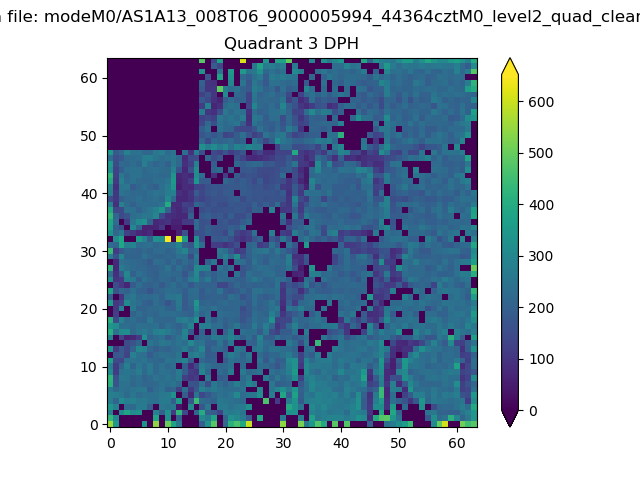 |
 |
Quadrant C |
| Plot type | Count rate plots | Images |
|---|---|---|
| Comparison with Poisson distribution Blue bars denote a histogram of data divided into 1 sec bins. Red curve is a Poisson curve with rate = median count rate of data. |
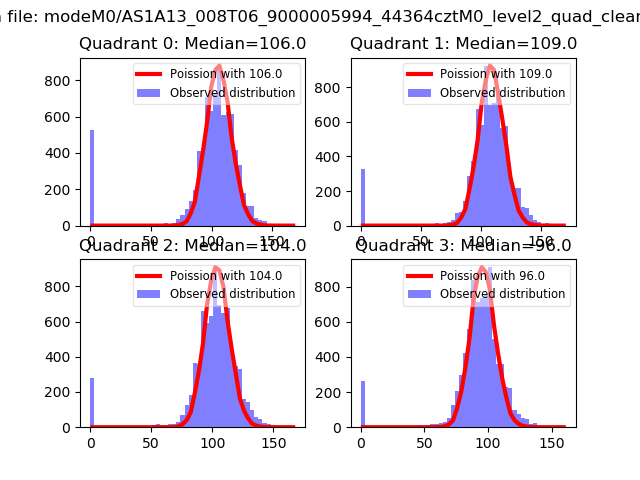 |
 |
| Quadrant-wise count rates Data is divided into 100 sec bins |
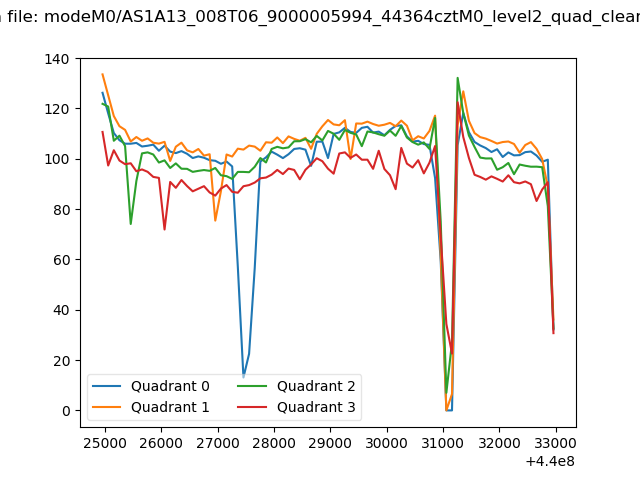 |
|
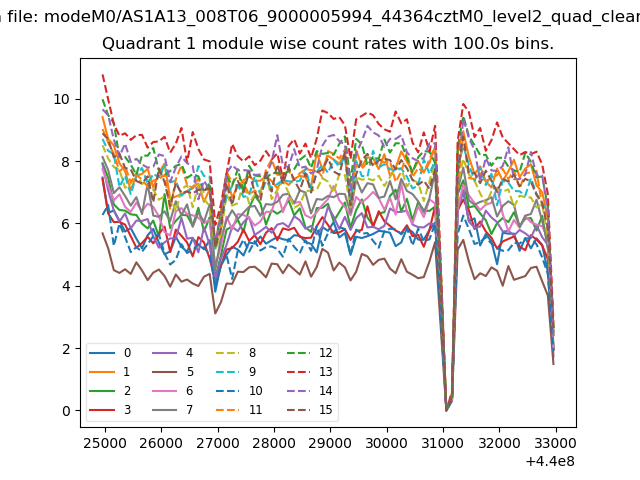
| Module-wise count rates for Quadrant A Data is divided into 100 sec bins |
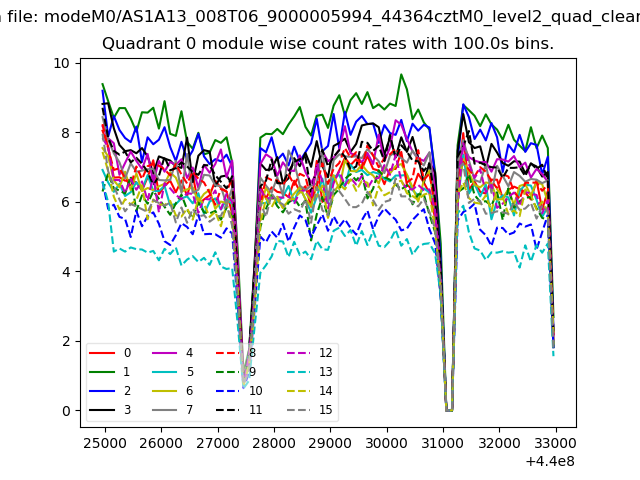 |
 |
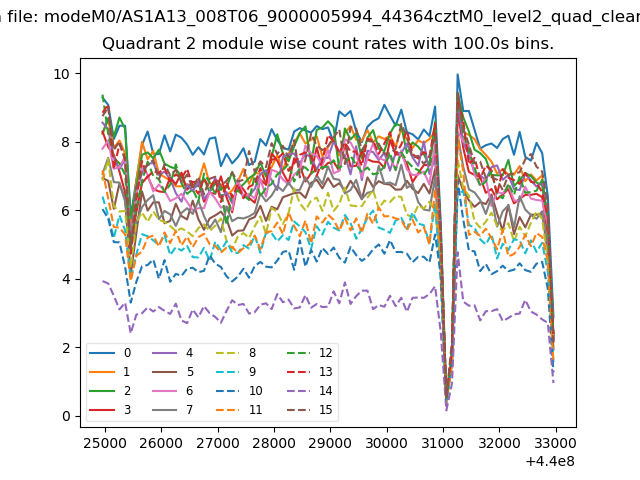
| Module-wise count rates for Quadrant B Data is divided into 100 sec bins |
 |
 |
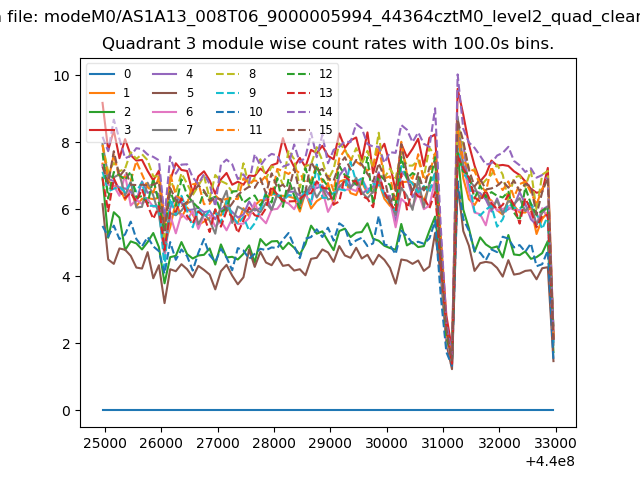
| Module-wise count rates for Quadrant C Data is divided into 100 sec bins |
 |
 |
| Module-wise count rates for Quadrant D Data is divided into 100 sec bins |
 |
 |
| Parameter | Plot |
|---|---|
| CZT HV Monitor | 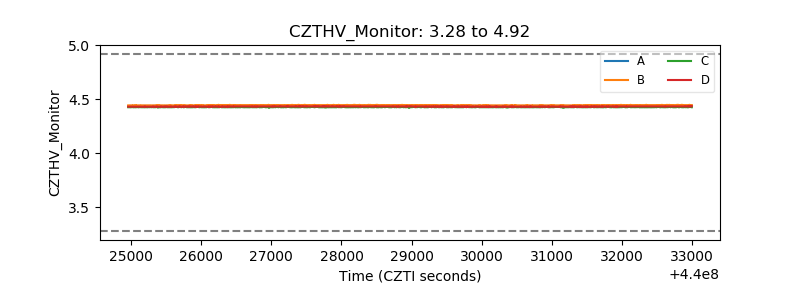 |
| D_VDD | 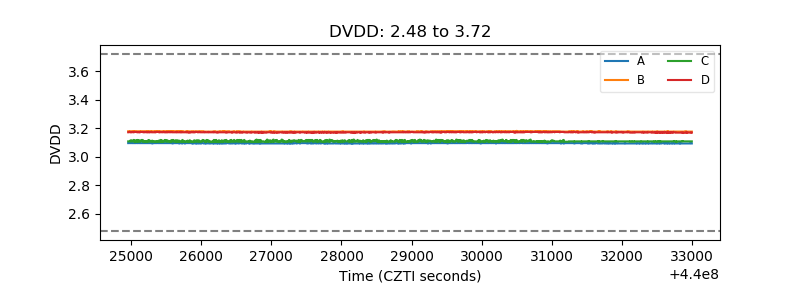 |
| Temperature 1 | 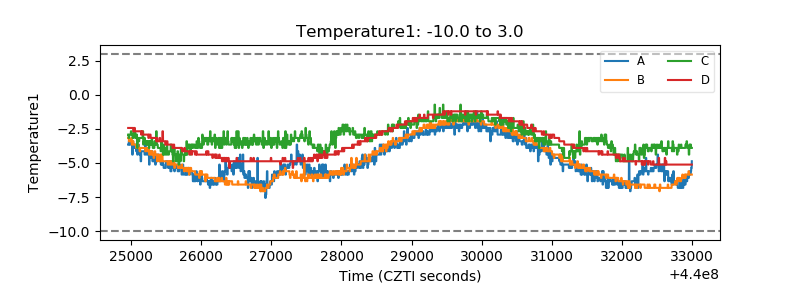 |
| Veto HV Monitor |  |
| Veto LLD | 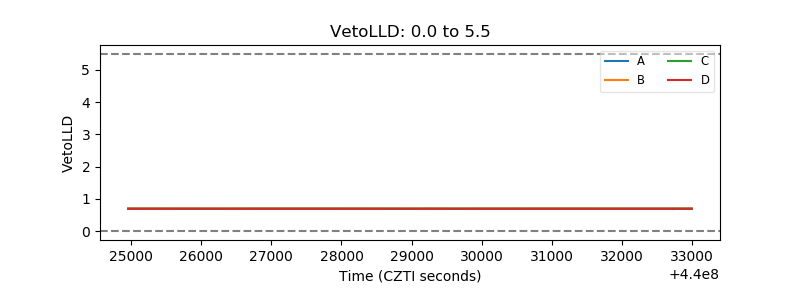 |
| Alpha Counter | 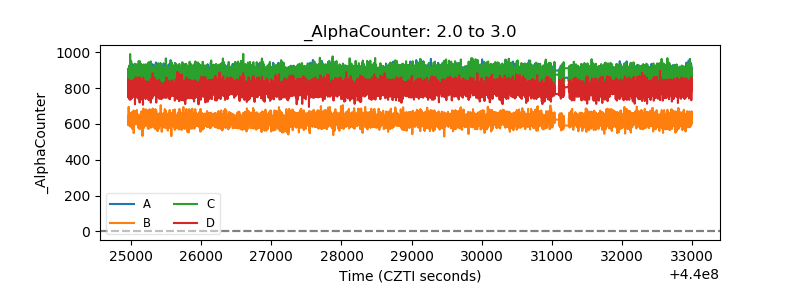 |
| _CPM_Rate | 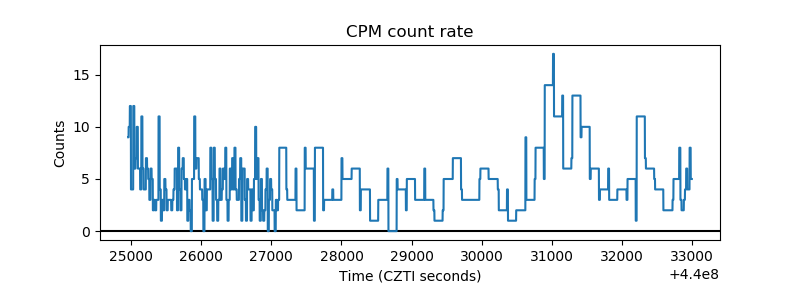 |
| CZT Counter | 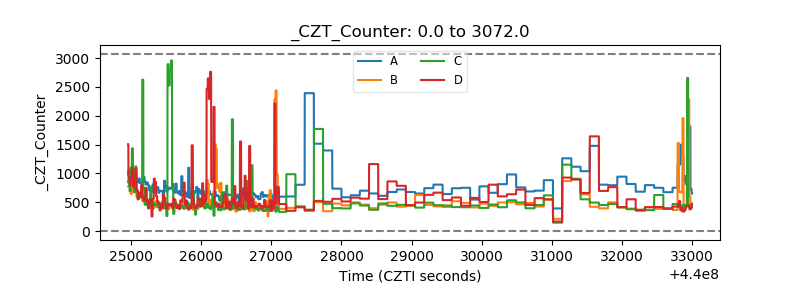 |
| +2.5 Volts monitor | 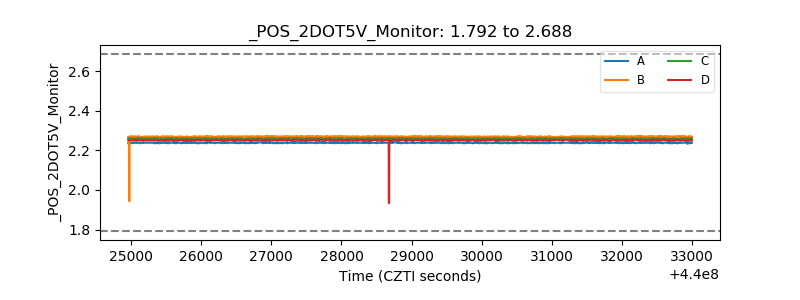 |
| +5 Volts monitor | 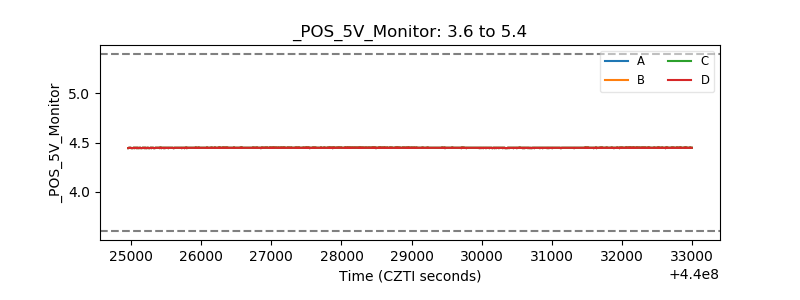 |
| _ROLL_ROT | 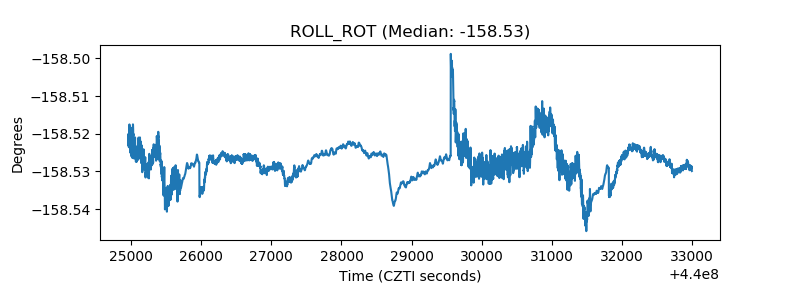 |
| _Roll_DEC | 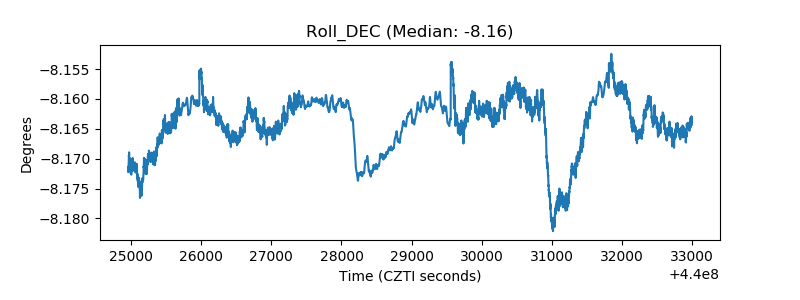 |
| _Roll_RA | 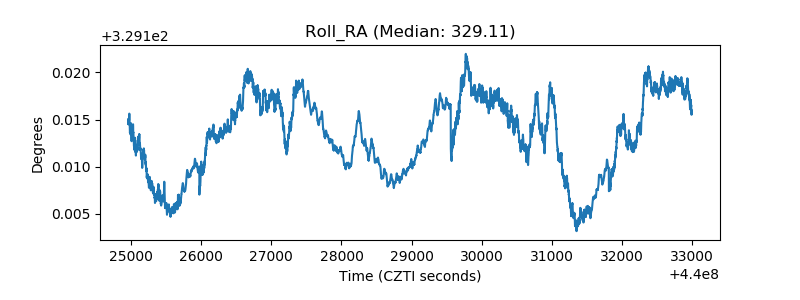 |
| Veto Counter | 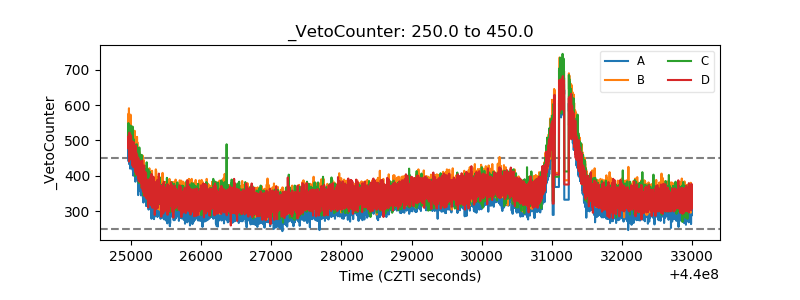 |