| Param | Original file | Final file |
|---|---|---|
| Filename | modeM0/AS1A13_008T06_9000005994_44366cztM0_level2.fits | modeM0/AS1A13_008T06_9000005994_44366cztM0_level2_quad_clean.evt |
| Size (bytes) | 1,035,864,000 | 201,332,160 |
| Size | 987.9 MB | 192.0 MB |
| Events in quadrant A | 13,189,774 | 1,242,863 |
| Events in quadrant B | 6,872,204 | 1,418,599 |
| Events in quadrant C | 6,562,507 | 1,369,643 |
| Events in quadrant D | 10,682,490 | 1,138,514 |
| Mode M9 | |||
|---|---|---|---|
| Quadrant | BADHDUFLAG | Total packets | Discarded packets |
| A | 0 | 11 | 0 |
| B | 0 | 11 | 0 |
| C | 0 | 11 | 0 |
| D | 0 | 11 | 0 |
| Mode SS | |||
|---|---|---|---|
| Quadrant | BADHDUFLAG | Total packets | Discarded packets |
| A | 0 | 274 | 0 |
| B | 0 | 274 | 0 |
| C | 0 | 274 | 0 |
| D | 0 | 274 | 0 |
| Mode M0 | |||
|---|---|---|---|
| Quadrant | BADHDUFLAG | Total packets | Discarded packets |
| A | 0 | 49650 | 6 |
| B | 0 | 29527 | 4 |
| C | 0 | 29150 | 4 |
| D | 0 | 41096 | 4 |
| Quadrant | Total seconds | Saturated seconds | Saturation percentage |
|---|---|---|---|
| A | 13399 | 1702 | 12.702440% |
| B | 13399 | 452 | 3.373386% |
| C | 13400 | 293 | 2.186567% |
| D | 13400 | 1403 | 10.470149% |
Noise dominated data is calculated using 1-second bins in cleaned event files. If a bin has >2000 counts, and if more than 50% of those come from <1% of pixels, then it is considered to be noise-dominated and hence unusable.
| Quadrant | # 1 sec bins | Bins with >0 counts | Bins with >2000 counts | High rate bins dominated by noise | Noise dominated (total time) | Noise dominated (detector-on time) | Marked lightcurve |
|---|---|---|---|---|---|---|---|
| A | 14579 | 13400 | 920 | 920 | 6.31% | 6.87% | 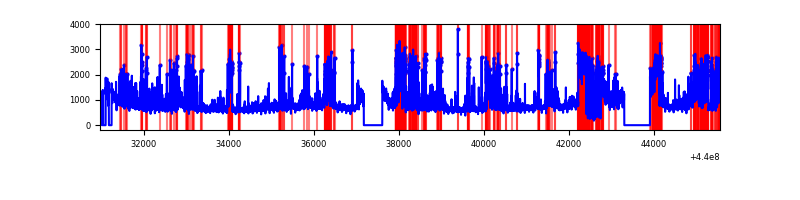 |
| B | 14579 | 13401 | 89 | 89 | 0.61% | 0.66% | 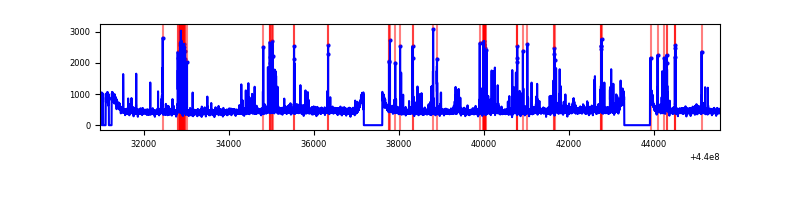 |
| C | 14580 | 13402 | 72 | 72 | 0.49% | 0.54% | 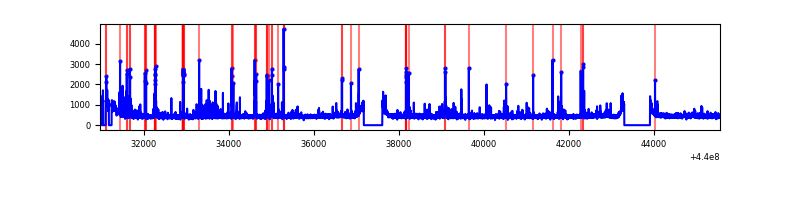 |
| D | 14580 | 13403 | 1190 | 1190 | 8.16% | 8.88% | 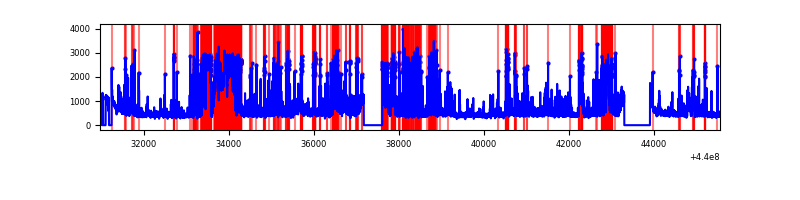 |
Top three noisy pixels from each quadrant. If the there are fewer than three noisy pixels in the level2.evt file, extra rows are filled as -1
| Pixel properties | Quadrant properties | ||||||
|---|---|---|---|---|---|---|---|
| Quadrant | DetID | PixID | Counts | Sigma | Mean | Median | Sigma |
| A | 15 | 223 | 3240226 | 10746.64 | 1453 | 1422 | 301.4 |
| A | 10 | 83 | 2890731 | 9586.99 | 1453 | 1422 | 301.4 |
| A | 13 | 248 | 1269047 | 4206.09 | 1453 | 1422 | 301.4 |
| B | 5 | 172 | 227682 | 737.07 | 1538 | 1492 | 306.9 |
| B | 5 | 255 | 180525 | 583.4 | 1538 | 1492 | 306.9 |
| B | 0 | 219 | 132154 | 425.78 | 1538 | 1492 | 306.9 |
| C | 14 | 254 | 493947 | 1367.7 | 1517 | 1524 | 360.0 |
| C | 1 | 3 | 59416 | 160.79 | 1517 | 1524 | 360.0 |
| C | 3 | 233 | 40600 | 108.53 | 1517 | 1524 | 360.0 |
| D | 13 | 249 | 2922082 | 7891.93 | 1459 | 1417 | 370.1 |
| D | 2 | 249 | 479635 | 1292.19 | 1459 | 1417 | 370.1 |
| D | 4 | 221 | 346710 | 933.02 | 1459 | 1417 | 370.1 |
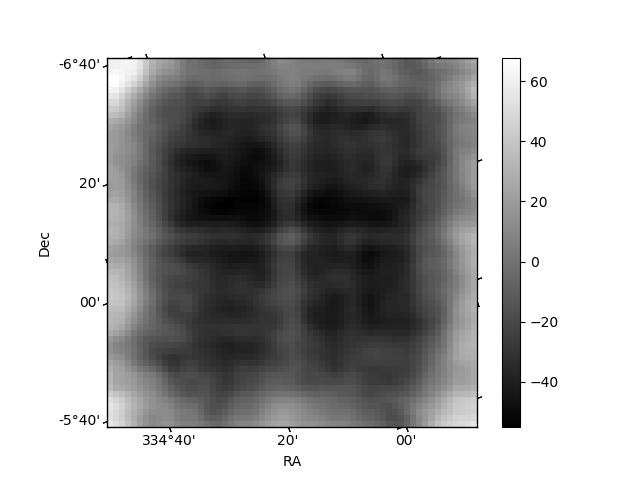
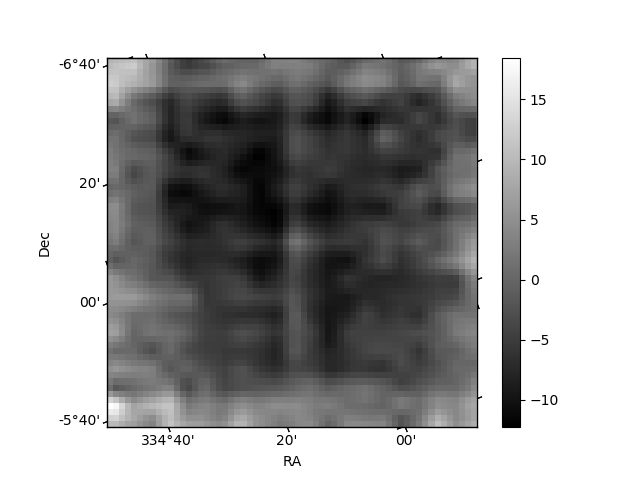
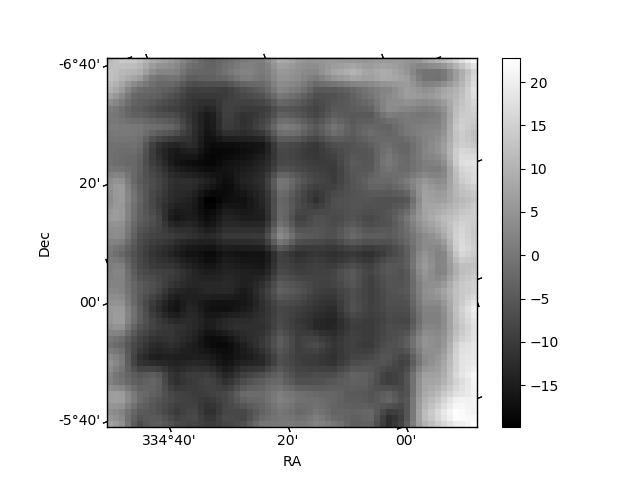
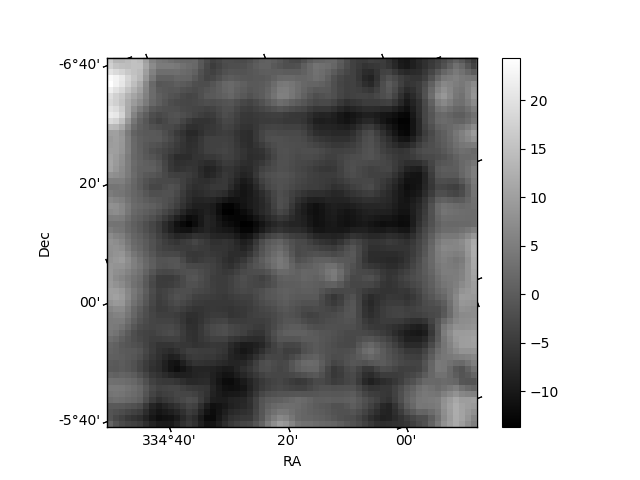
Histogram calculated using DETX and DETY for each event in the final _common_clean file
| Quadrant A | 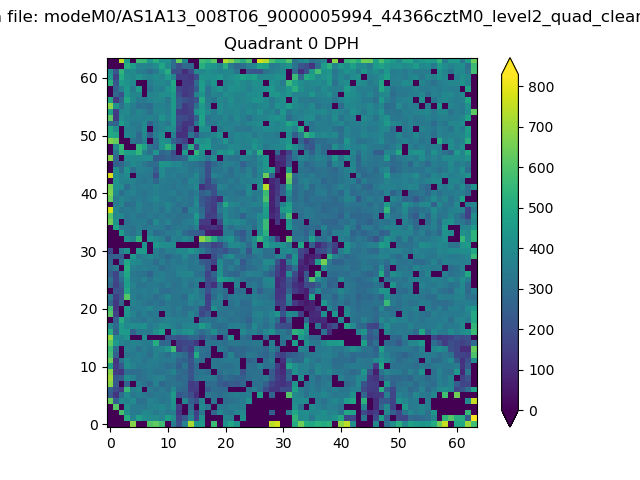 |
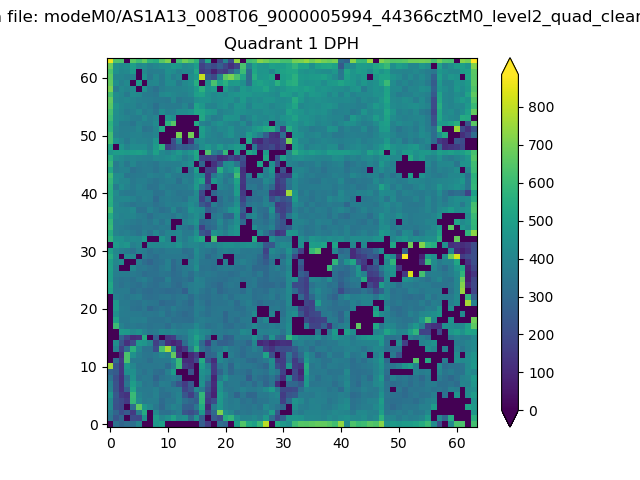 |
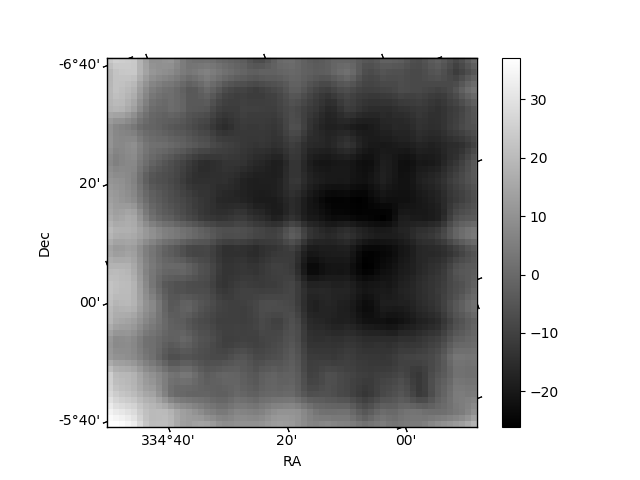
Quadrant B |
|---|---|---|---|
| Quadrant D | 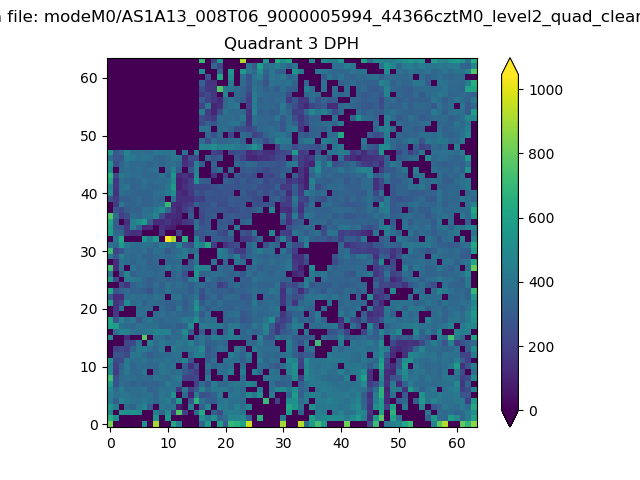 |
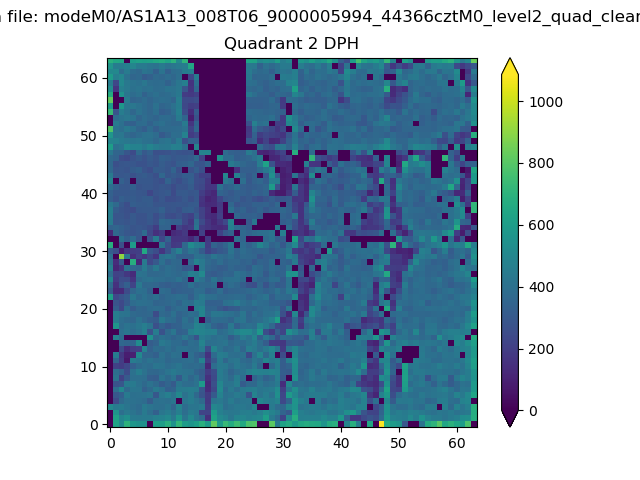 |
Quadrant C |
| Plot type | Count rate plots | Images |
|---|---|---|
| Comparison with Poisson distribution Blue bars denote a histogram of data divided into 1 sec bins. Red curve is a Poisson curve with rate = median count rate of data. |
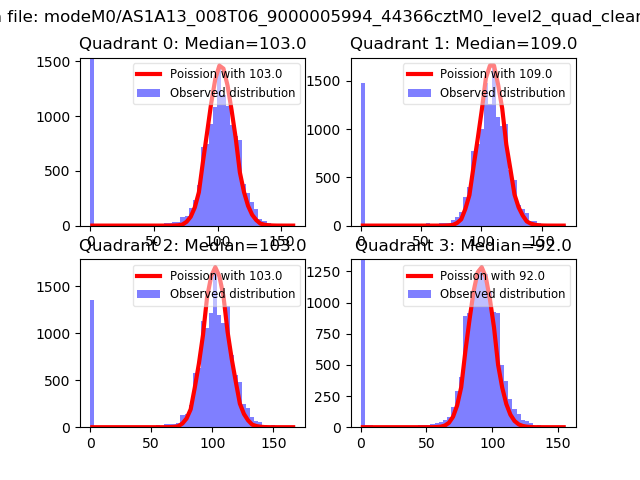 |
 |
| Quadrant-wise count rates Data is divided into 100 sec bins |
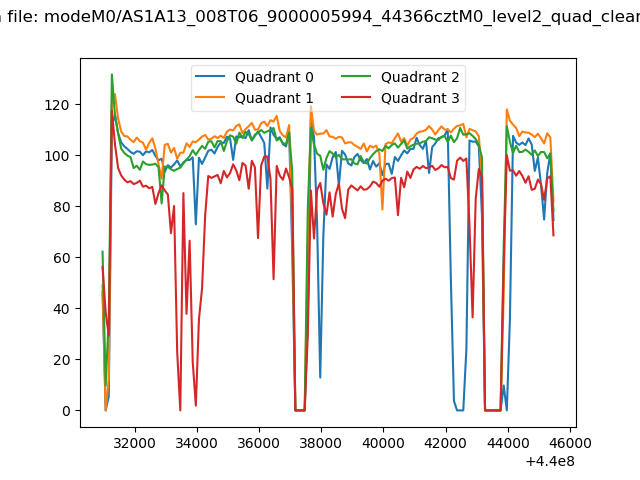 |
|
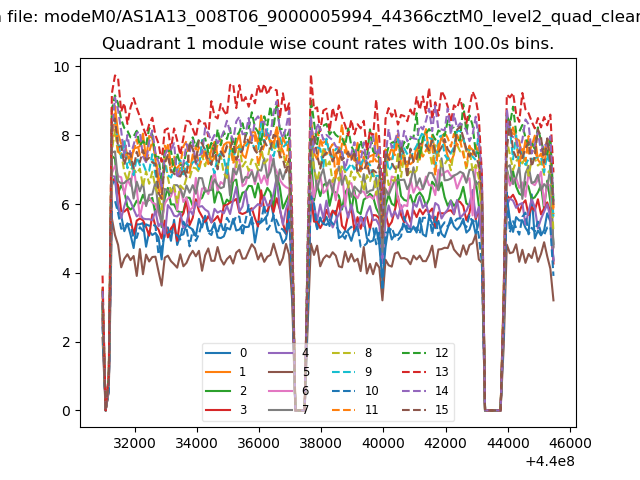
| Module-wise count rates for Quadrant A Data is divided into 100 sec bins |
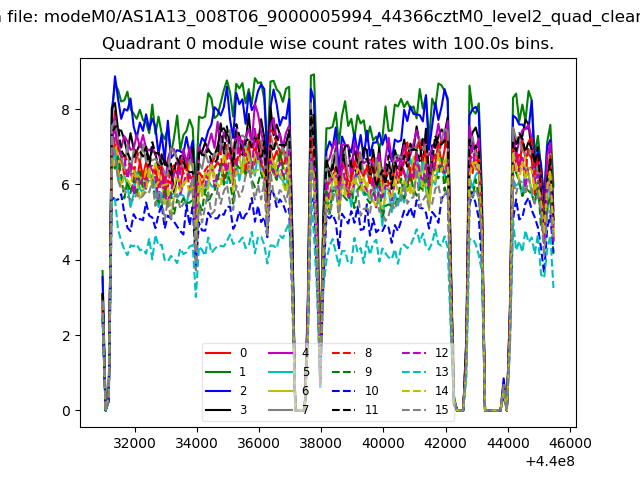 |
 |
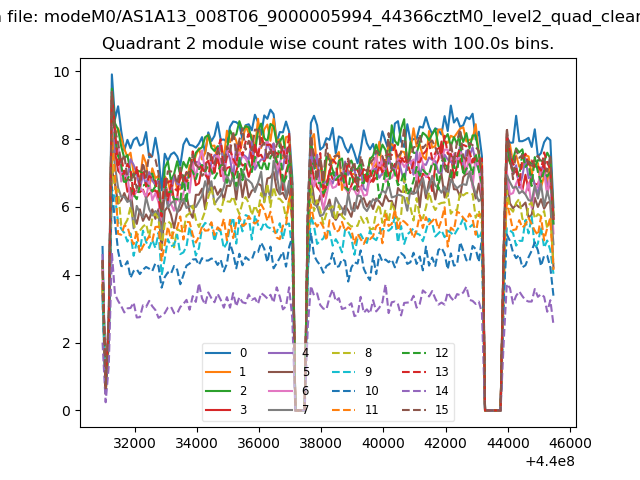
| Module-wise count rates for Quadrant B Data is divided into 100 sec bins |
 |
 |
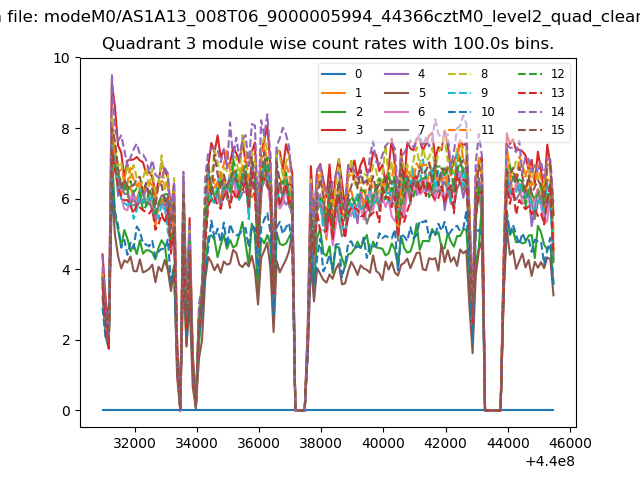
| Module-wise count rates for Quadrant C Data is divided into 100 sec bins |
 |
 |
| Module-wise count rates for Quadrant D Data is divided into 100 sec bins |
 |
 |
| Parameter | Plot |
|---|---|
| CZT HV Monitor | 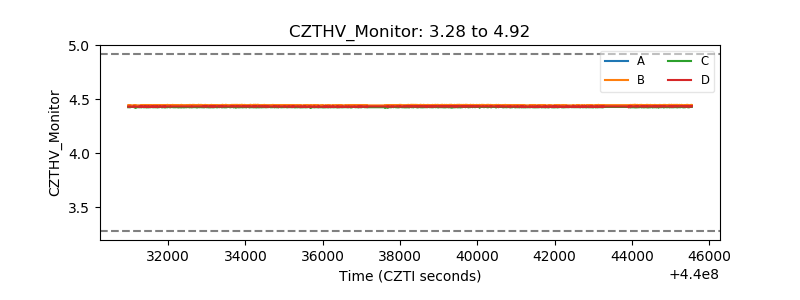 |
| D_VDD | 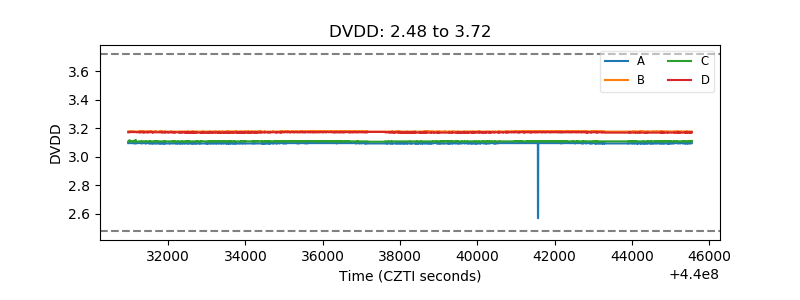 |
| Temperature 1 | 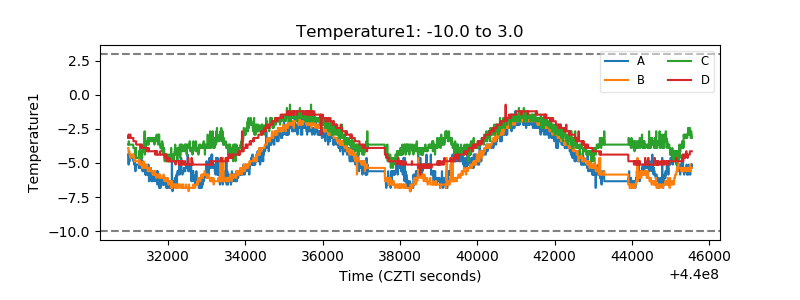 |
| Veto HV Monitor | 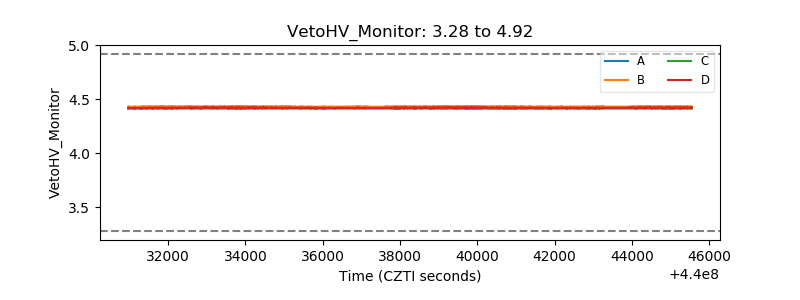 |
| Veto LLD | 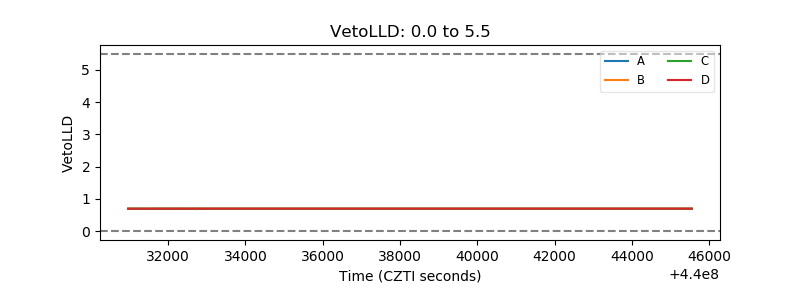 |
| Alpha Counter | 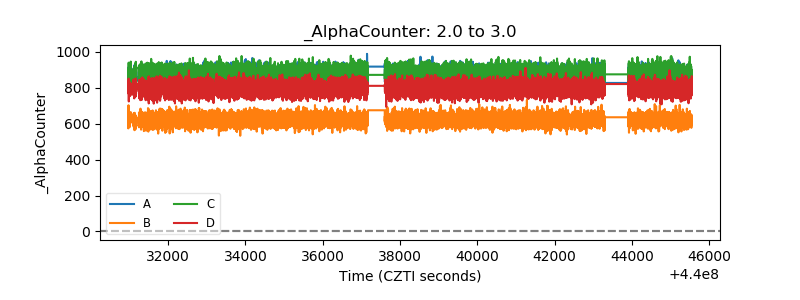 |
| _CPM_Rate | 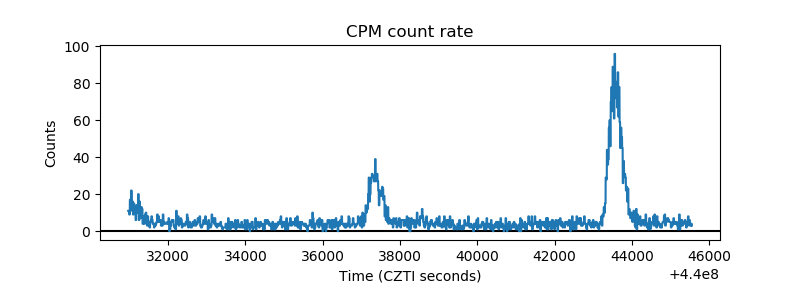 |
| CZT Counter | 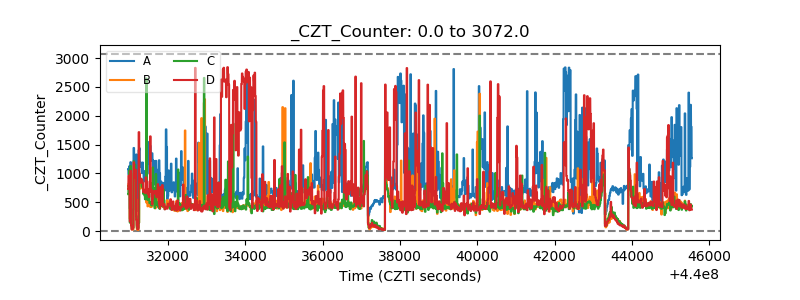 |
| +2.5 Volts monitor | 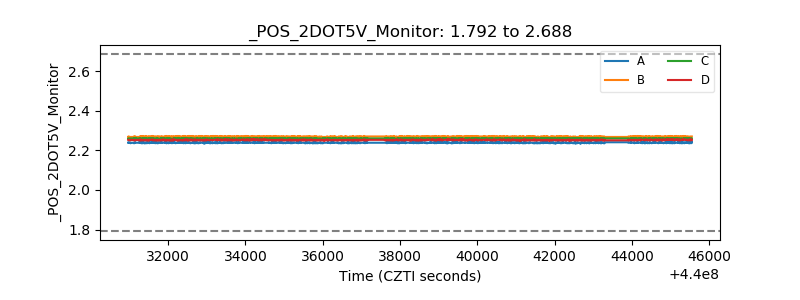 |
| +5 Volts monitor | 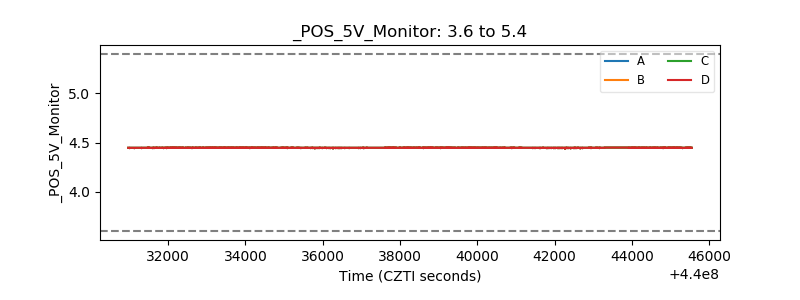 |
| _ROLL_ROT | 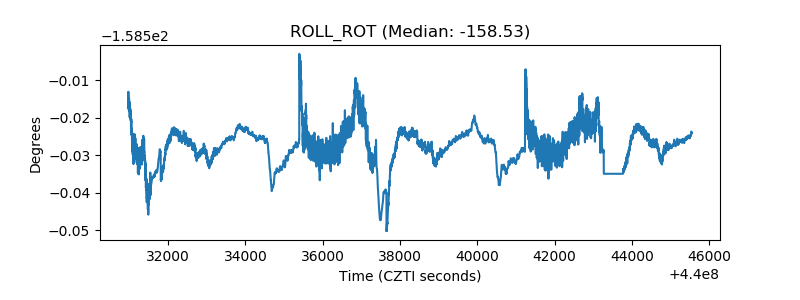 |
| _Roll_DEC | 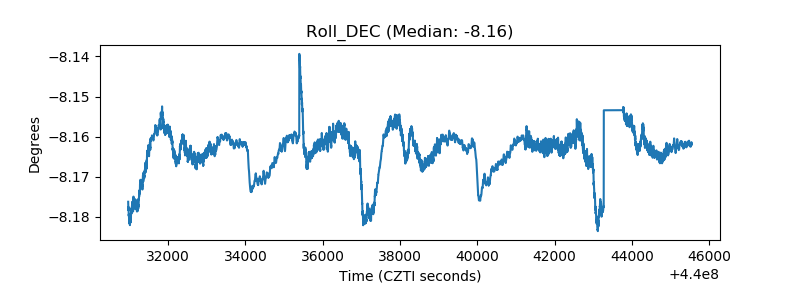 |
| _Roll_RA | 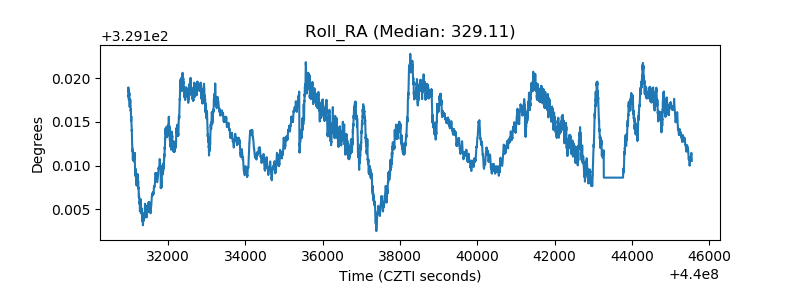 |
| Veto Counter | 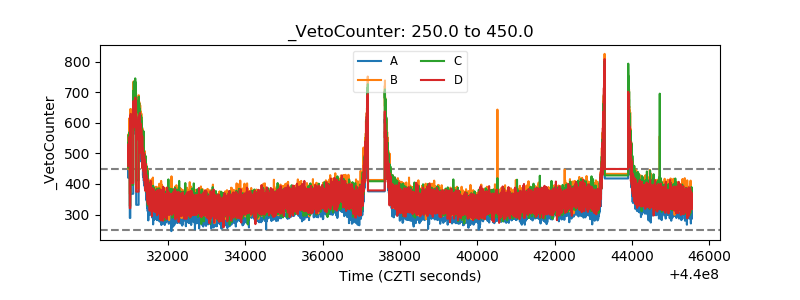 |