| Param | Original file | Final file |
|---|---|---|
| Filename | modeM0/AS1A13_008T06_9000005994_44367cztM0_level2.fits | modeM0/AS1A13_008T06_9000005994_44367cztM0_level2_quad_clean.evt |
| Size (bytes) | 613,768,320 | 112,328,640 |
| Size | 585.3 MB | 107.1 MB |
| Events in quadrant A | 9,729,244 | 647,034 |
| Events in quadrant B | 3,719,708 | 794,604 |
| Events in quadrant C | 3,654,803 | 764,946 |
| Events in quadrant D | 5,046,652 | 683,505 |
| Mode M9 | |||
|---|---|---|---|
| Quadrant | BADHDUFLAG | Total packets | Discarded packets |
| A | 0 | 14 | 0 |
| B | 0 | 14 | 0 |
| C | 0 | 14 | 0 |
| D | 0 | 14 | 0 |
| Mode SS | |||
|---|---|---|---|
| Quadrant | BADHDUFLAG | Total packets | Discarded packets |
| A | 0 | 150 | 0 |
| B | 0 | 150 | 0 |
| C | 0 | 150 | 0 |
| D | 0 | 150 | 0 |
| Mode M0 | |||
|---|---|---|---|
| Quadrant | BADHDUFLAG | Total packets | Discarded packets |
| A | 0 | 34172 | 2 |
| B | 0 | 15958 | 2 |
| C | 0 | 15983 | 2 |
| D | 0 | 19959 | 2 |
| Quadrant | Total seconds | Saturated seconds | Saturation percentage |
|---|---|---|---|
| A | 7340 | 1660 | 22.615804% |
| B | 7340 | 190 | 2.588556% |
| C | 7341 | 135 | 1.838987% |
| D | 7341 | 373 | 5.081052% |
Noise dominated data is calculated using 1-second bins in cleaned event files. If a bin has >2000 counts, and if more than 50% of those come from <1% of pixels, then it is considered to be noise-dominated and hence unusable.
| Quadrant | # 1 sec bins | Bins with >0 counts | Bins with >2000 counts | High rate bins dominated by noise | Noise dominated (total time) | Noise dominated (detector-on time) | Marked lightcurve |
|---|---|---|---|---|---|---|---|
| A | 8760 | 7340 | 1274 | 1274 | 14.54% | 17.36% | 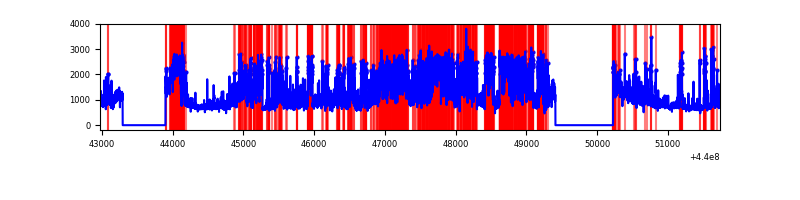 |
| B | 8760 | 7340 | 17 | 17 | 0.19% | 0.23% | 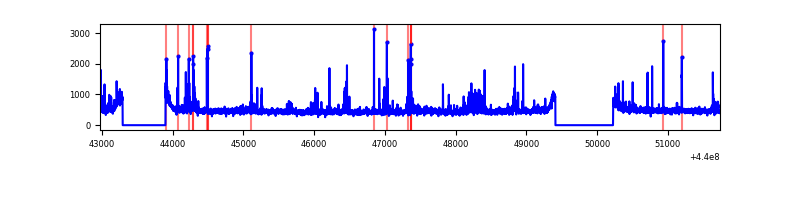 |
| C | 8761 | 7341 | 20 | 20 | 0.23% | 0.27% |  |
| D | 8761 | 7341 | 266 | 266 | 3.04% | 3.62% | 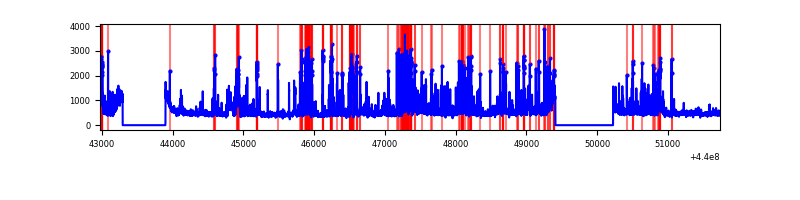 |
Top three noisy pixels from each quadrant. If the there are fewer than three noisy pixels in the level2.evt file, extra rows are filled as -1
| Pixel properties | Quadrant properties | ||||||
|---|---|---|---|---|---|---|---|
| Quadrant | DetID | PixID | Counts | Sigma | Mean | Median | Sigma |
| A | 15 | 223 | 4057335 | 24470.51 | 791 | 772 | 165.8 |
| A | 10 | 83 | 1701613 | 10260.03 | 791 | 772 | 165.8 |
| A | 13 | 248 | 748071 | 4507.95 | 791 | 772 | 165.8 |
| B | 0 | 190 | 118658 | 701.09 | 848 | 820 | 168.1 |
| B | 0 | 219 | 76680 | 451.34 | 848 | 820 | 168.1 |
| B | 5 | 172 | 66705 | 391.99 | 848 | 820 | 168.1 |
| C | 14 | 254 | 236536 | 1182.15 | 838 | 844 | 199.4 |
| C | 14 | 96 | 96401 | 479.28 | 838 | 844 | 199.4 |
| C | 3 | 233 | 31231 | 152.41 | 838 | 844 | 199.4 |
| D | 13 | 249 | 535280 | 2557.0 | 825 | 800 | 209.0 |
| D | 1 | 52 | 292774 | 1396.83 | 825 | 800 | 209.0 |
| D | 2 | 249 | 287291 | 1370.6 | 825 | 800 | 209.0 |
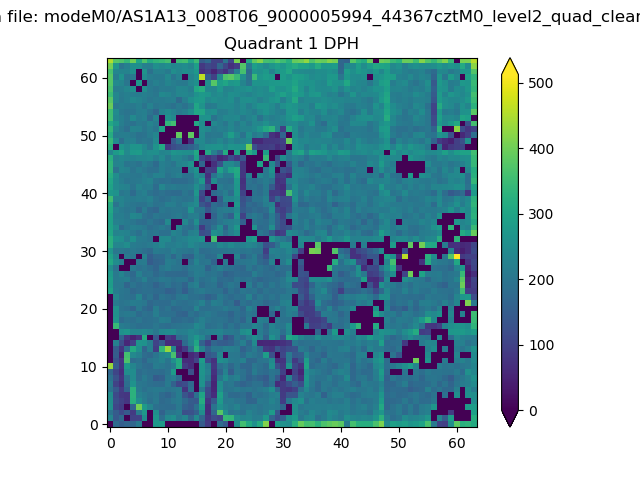
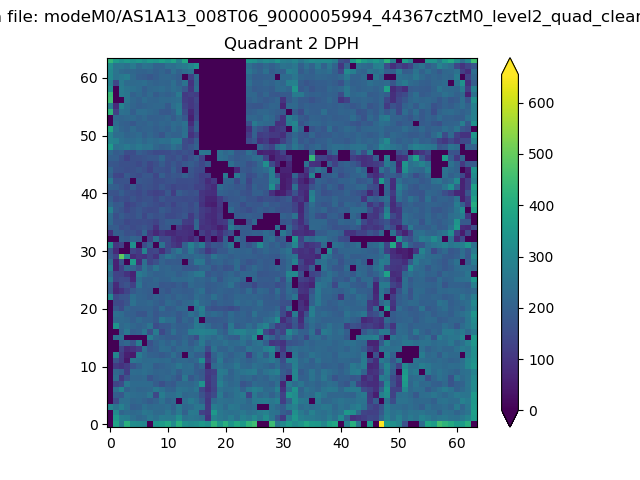
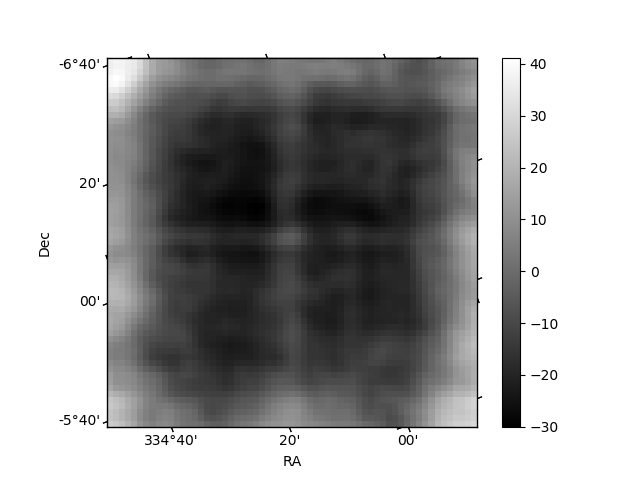
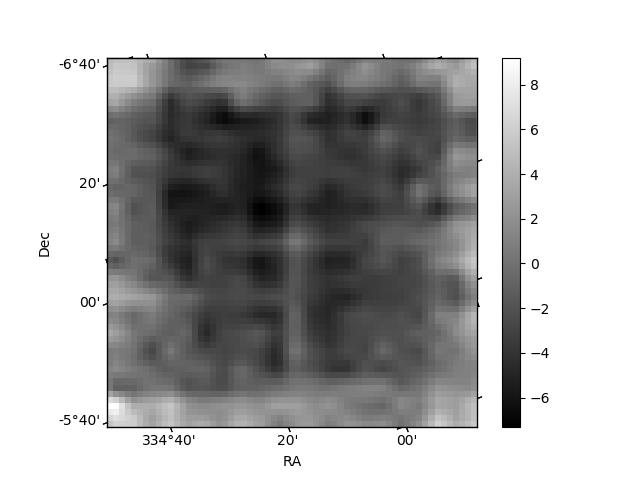
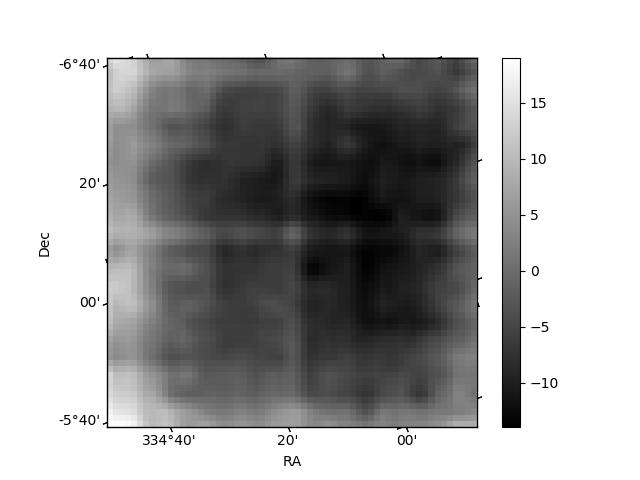
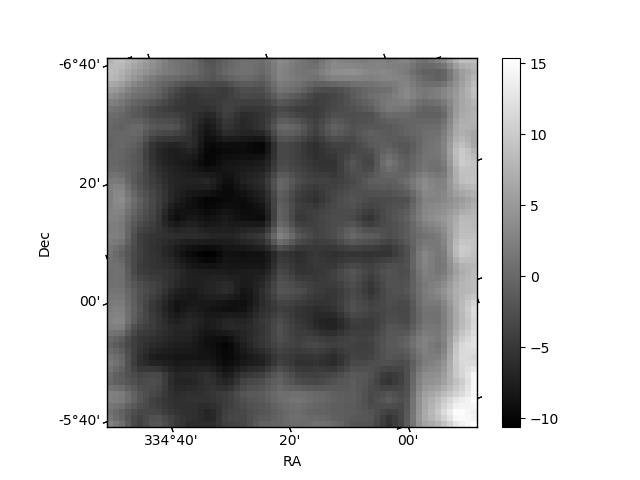
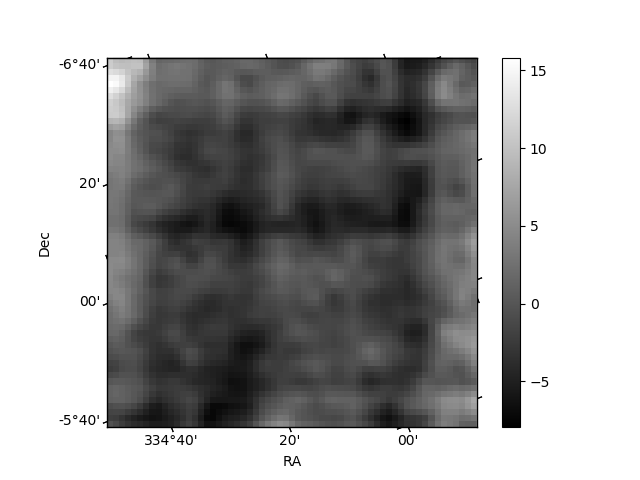
Histogram calculated using DETX and DETY for each event in the final _common_clean file
| Quadrant A | 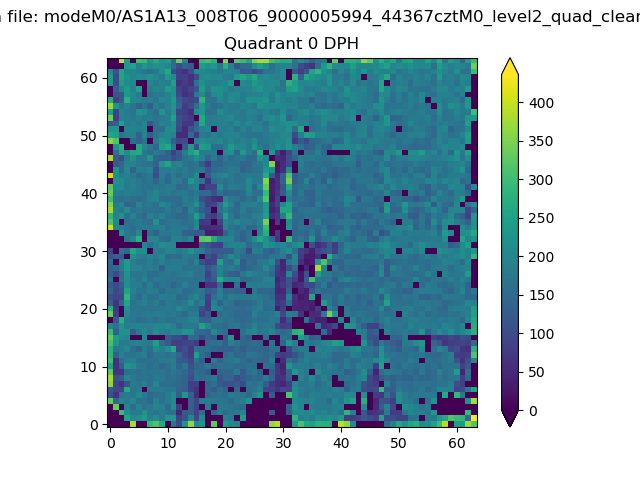 |
 |
Quadrant B |
|---|---|---|---|
| Quadrant D | 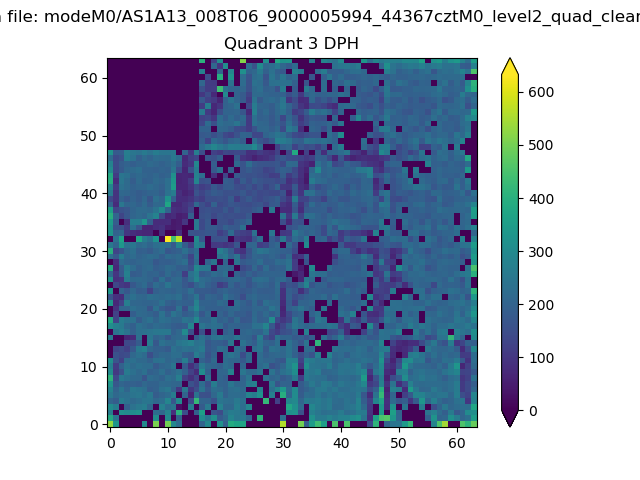 |
 |
Quadrant C |
| Plot type | Count rate plots | Images |
|---|---|---|
| Comparison with Poisson distribution Blue bars denote a histogram of data divided into 1 sec bins. Red curve is a Poisson curve with rate = median count rate of data. |
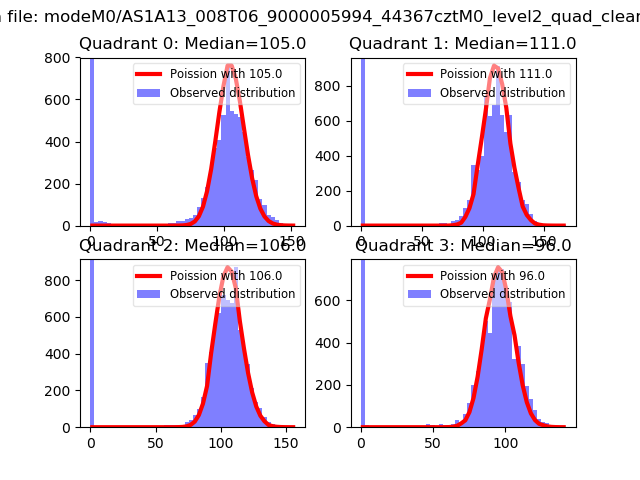 |
 |
| Quadrant-wise count rates Data is divided into 100 sec bins |
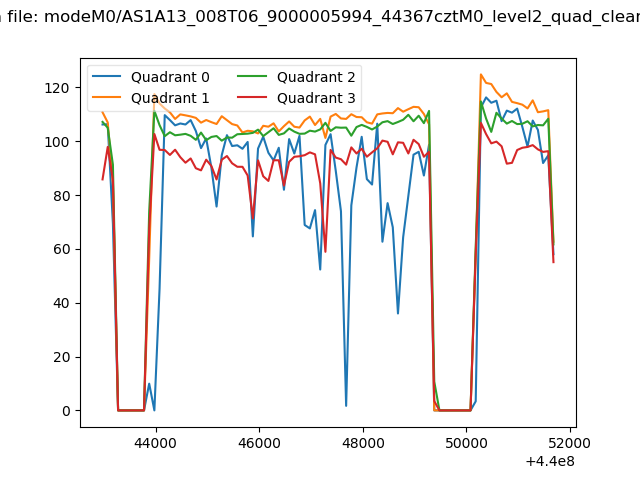 |
|
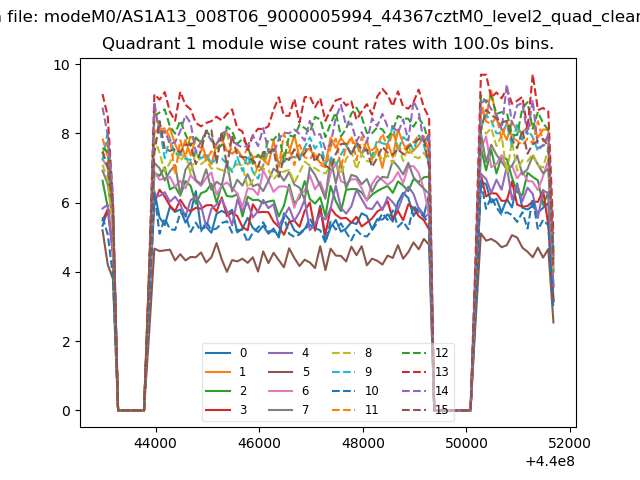
| Module-wise count rates for Quadrant A Data is divided into 100 sec bins |
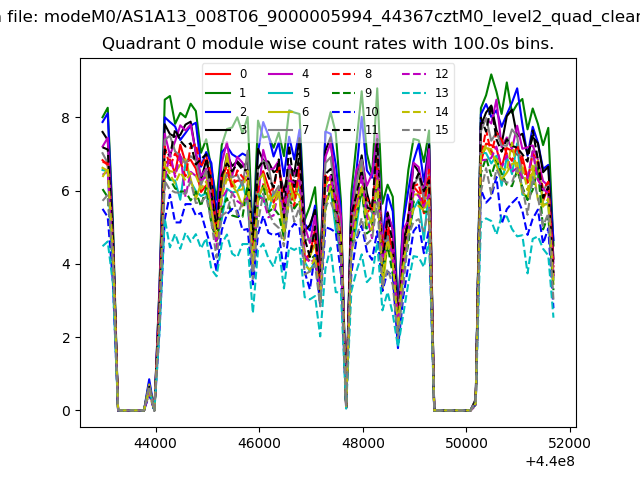 |
 |
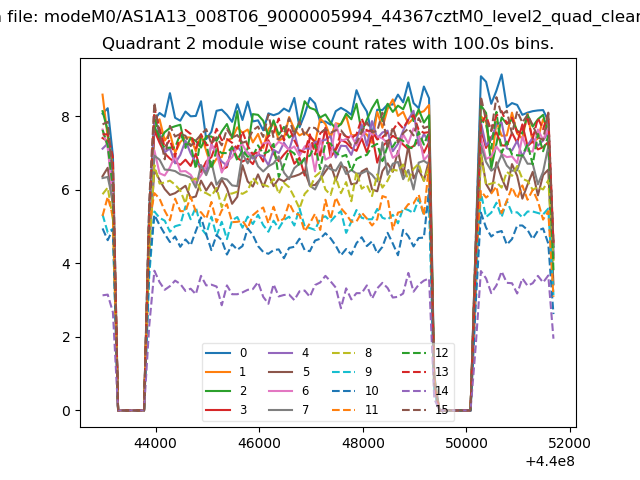
| Module-wise count rates for Quadrant B Data is divided into 100 sec bins |
 |
 |
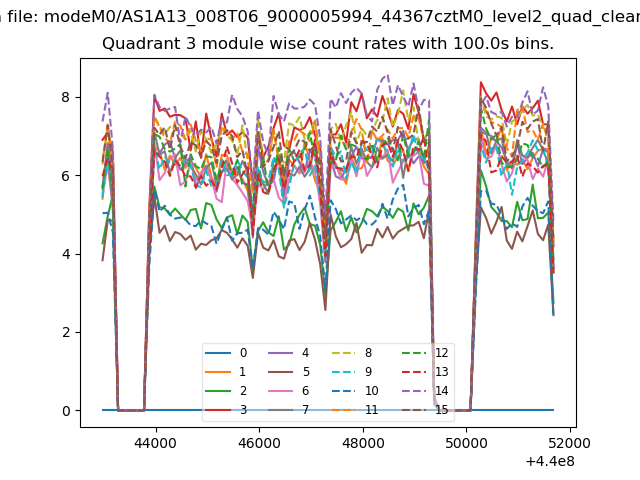
| Module-wise count rates for Quadrant C Data is divided into 100 sec bins |
 |
 |
| Module-wise count rates for Quadrant D Data is divided into 100 sec bins |
 |
 |
| Parameter | Plot |
|---|---|
| CZT HV Monitor | 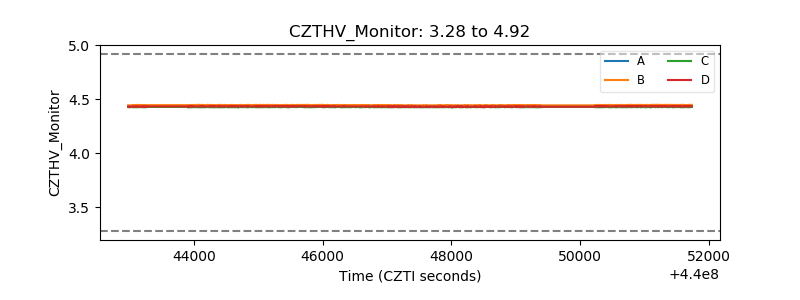 |
| D_VDD | 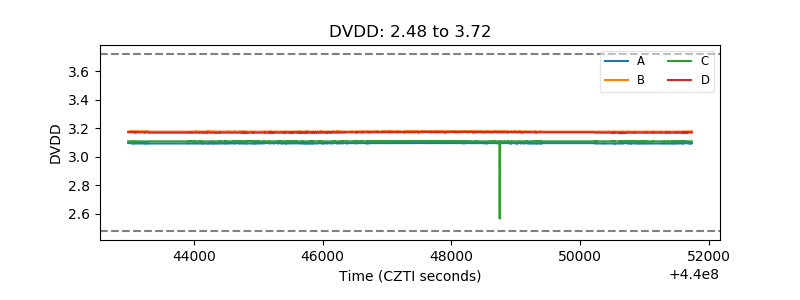 |
| Temperature 1 | 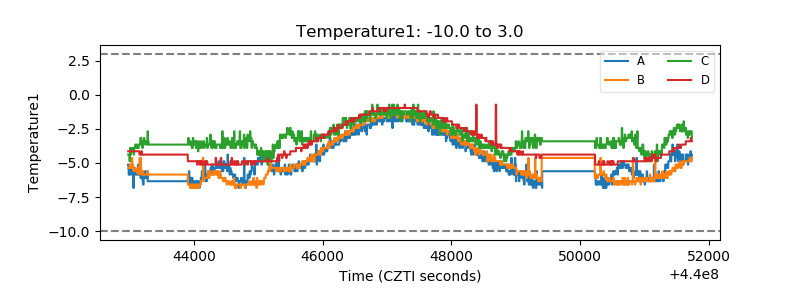 |
| Veto HV Monitor | 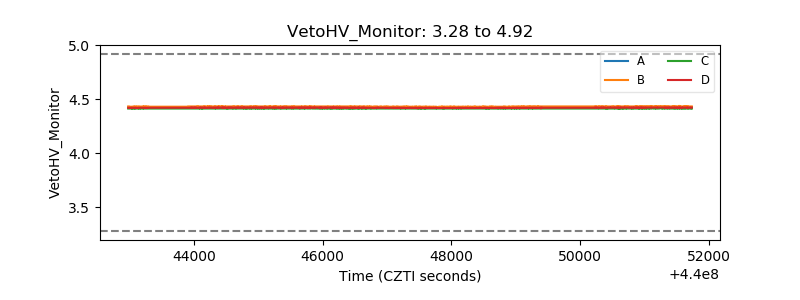 |
| Veto LLD | 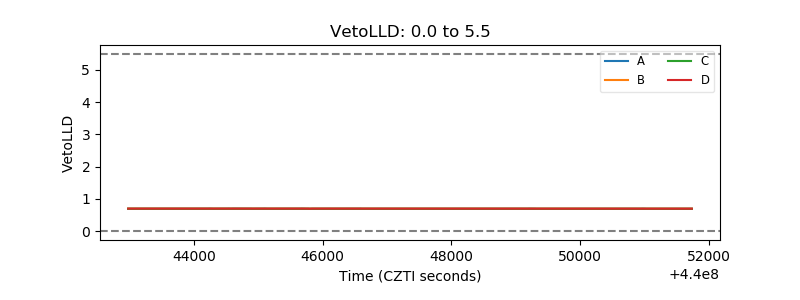 |
| Alpha Counter | 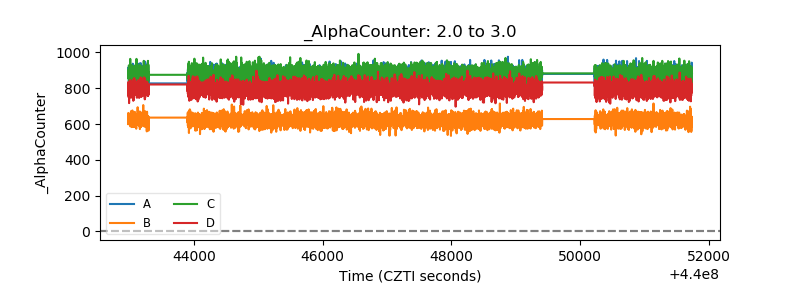 |
| _CPM_Rate | 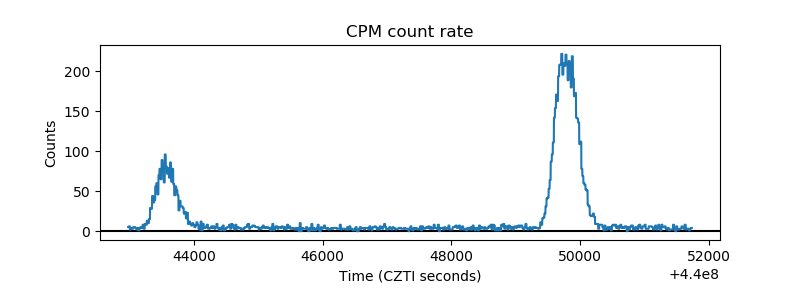 |
| CZT Counter | 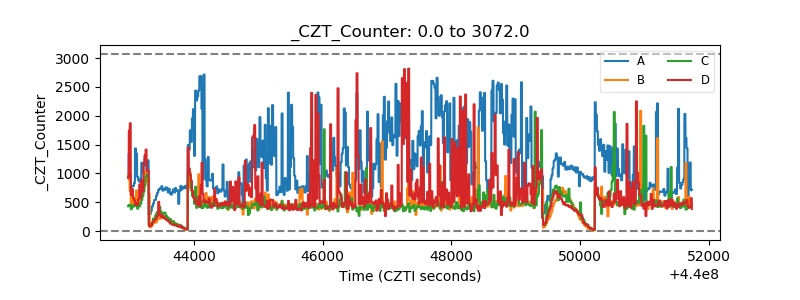 |
| +2.5 Volts monitor | 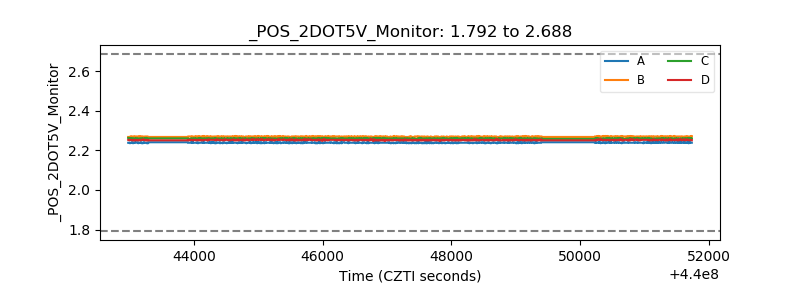 |
| +5 Volts monitor | 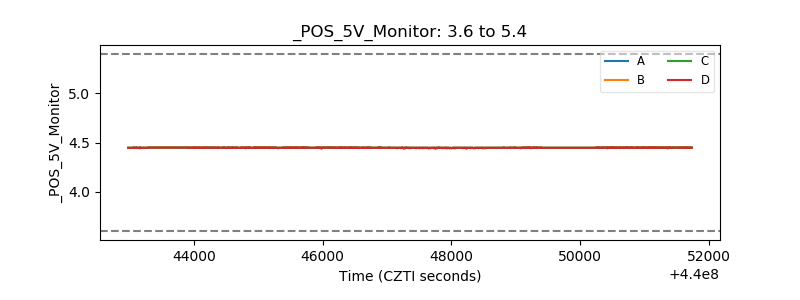 |
| _ROLL_ROT | 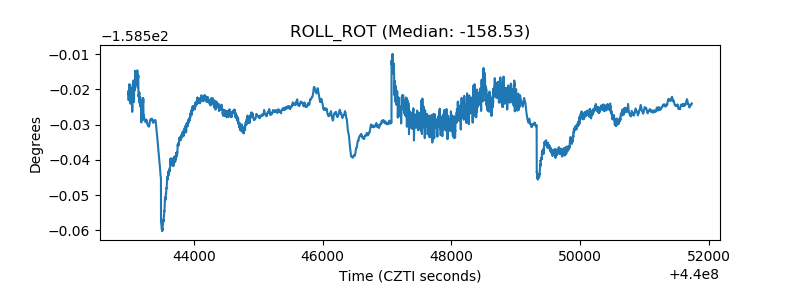 |
| _Roll_DEC | 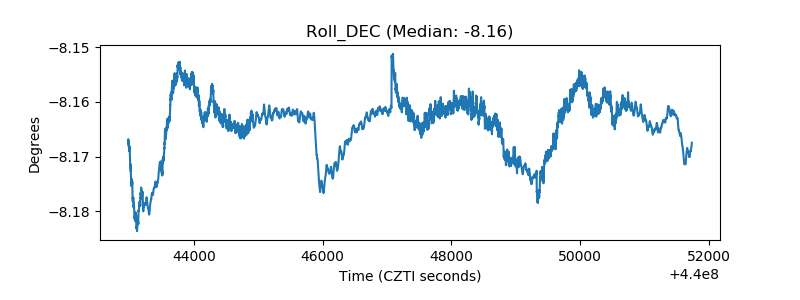 |
| _Roll_RA | 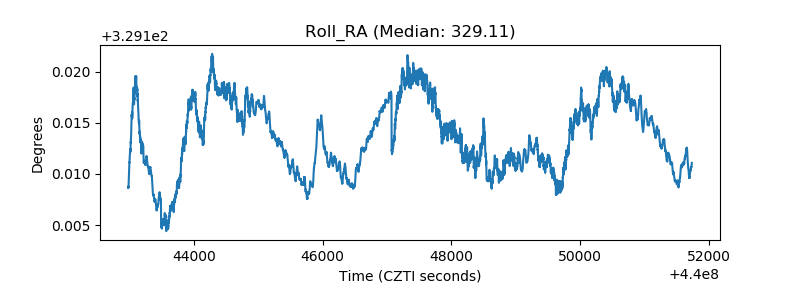 |
| Veto Counter | 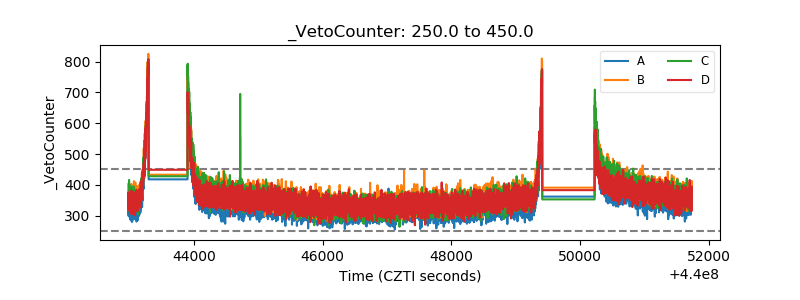 |