| Param | Original file | Final file |
|---|---|---|
| Filename | modeM0/AS1A13_008T06_9000005994_44370cztM0_level2.fits | modeM0/AS1A13_008T06_9000005994_44370cztM0_level2_quad_clean.evt |
| Size (bytes) | 415,500,480 | 64,664,640 |
| Size | 396.3 MB | 61.7 MB |
| Events in quadrant A | 7,210,885 | 322,859 |
| Events in quadrant B | 2,177,368 | 481,320 |
| Events in quadrant C | 2,730,843 | 441,851 |
| Events in quadrant D | 2,935,029 | 416,361 |
| Mode M9 | |||
|---|---|---|---|
| Quadrant | BADHDUFLAG | Total packets | Discarded packets |
| A | 1 | 140222807197736 | 140222092279854 |
| B | 1 | -1 | -1 |
| C | 1 | -1 | -1 |
| D | 1 | -1 | -1 |
| Mode SS | |||
|---|---|---|---|
| Quadrant | BADHDUFLAG | Total packets | Discarded packets |
| A | 0 | 84 | 0 |
| B | 0 | 84 | 0 |
| C | 0 | 84 | 0 |
| D | 0 | 84 | 0 |
| Mode M0 | |||
|---|---|---|---|
| Quadrant | BADHDUFLAG | Total packets | Discarded packets |
| A | 0 | 24339 | 1 |
| B | 0 | 9226 | 1 |
| C | 0 | 11023 | 1 |
| D | 0 | 11556 | 1 |
| Quadrant | Total seconds | Saturated seconds | Saturation percentage |
|---|---|---|---|
| A | 4193 | 1705 | 40.663010% |
| B | 4193 | 55 | 1.311710% |
| C | 4193 | 248 | 5.914620% |
| D | 4193 | 154 | 3.672788% |
Noise dominated data is calculated using 1-second bins in cleaned event files. If a bin has >2000 counts, and if more than 50% of those come from <1% of pixels, then it is considered to be noise-dominated and hence unusable.
| Quadrant | # 1 sec bins | Bins with >0 counts | Bins with >2000 counts | High rate bins dominated by noise | Noise dominated (total time) | Noise dominated (detector-on time) | Marked lightcurve |
|---|---|---|---|---|---|---|---|
| A | 4193 | 4193 | 1517 | 1517 | 36.18% | 36.18% | 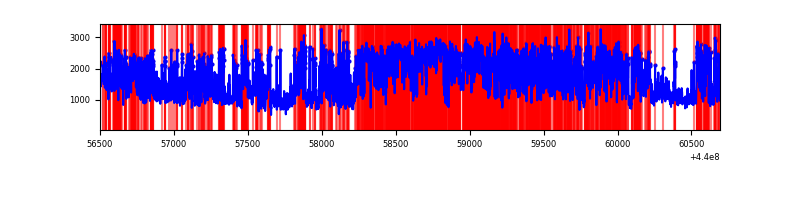 |
| B | 4193 | 4193 | 29 | 29 | 0.69% | 0.69% | 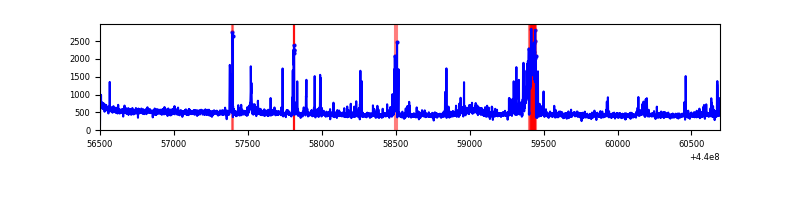 |
| C | 4193 | 4193 | 225 | 225 | 5.37% | 5.37% | 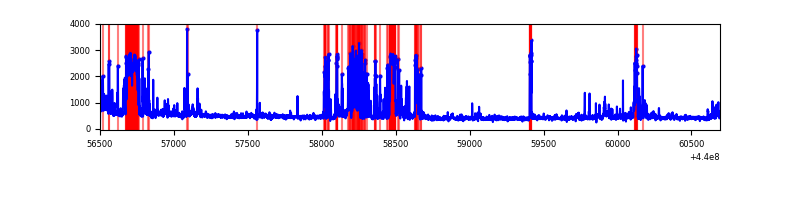 |
| D | 4193 | 4193 | 155 | 155 | 3.70% | 3.70% | 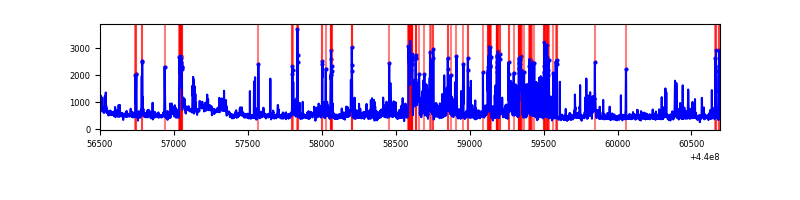 |
Top three noisy pixels from each quadrant. If the there are fewer than three noisy pixels in the level2.evt file, extra rows are filled as -1
| Pixel properties | Quadrant properties | ||||||
|---|---|---|---|---|---|---|---|
| Quadrant | DetID | PixID | Counts | Sigma | Mean | Median | Sigma |
| A | 15 | 223 | 4396461 | 49472.39 | 419 | 410 | 88.9 |
| A | 10 | 83 | 1007811 | 11337.12 | 419 | 410 | 88.9 |
| A | 13 | 248 | 153227 | 1719.78 | 419 | 410 | 88.9 |
| B | 15 | 36 | 112120 | 1169.03 | 474 | 460 | 95.5 |
| B | 5 | 172 | 59361 | 616.67 | 474 | 460 | 95.5 |
| B | 0 | 219 | 36718 | 379.61 | 474 | 460 | 95.5 |
| C | 14 | 96 | 891151 | 8305.24 | 449 | 452 | 107.2 |
| C | 14 | 254 | 52269 | 483.16 | 449 | 452 | 107.2 |
| C | 14 | 112 | 13357 | 120.33 | 449 | 452 | 107.2 |
| D | 13 | 249 | 346195 | 2985.33 | 458 | 446 | 115.8 |
| D | 5 | 222 | 258352 | 2226.86 | 458 | 446 | 115.8 |
| D | 8 | 240 | 180795 | 1557.2 | 458 | 446 | 115.8 |
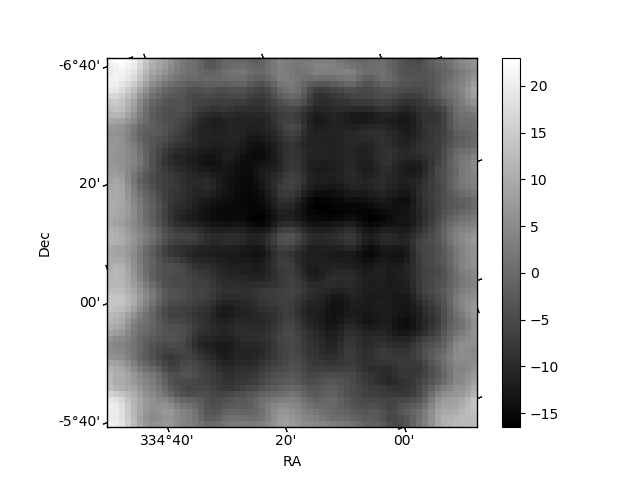
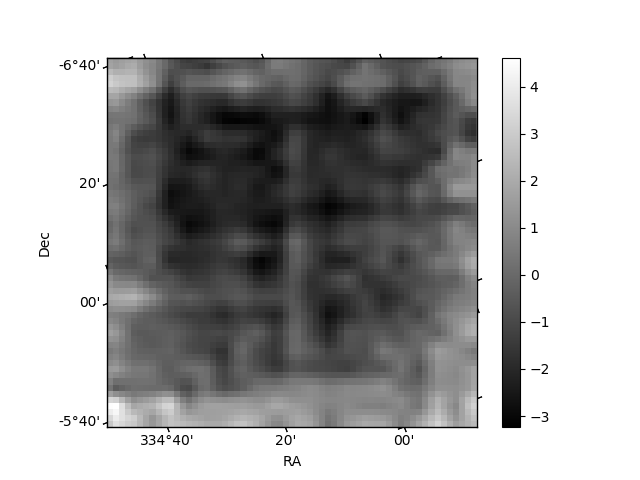
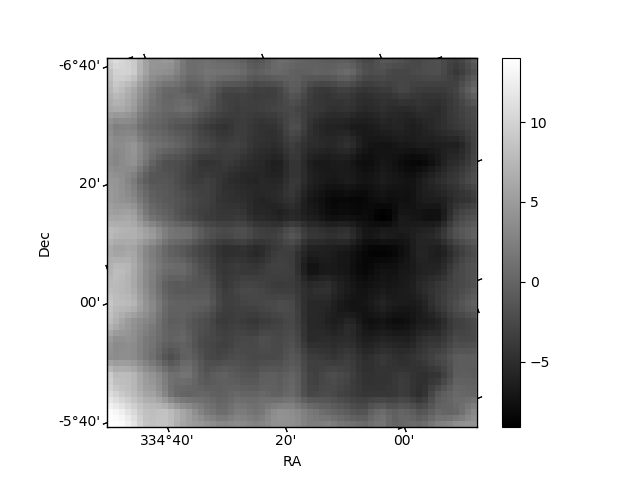
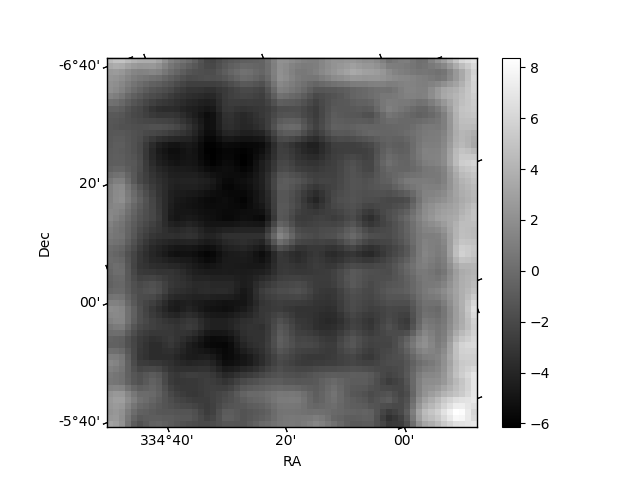
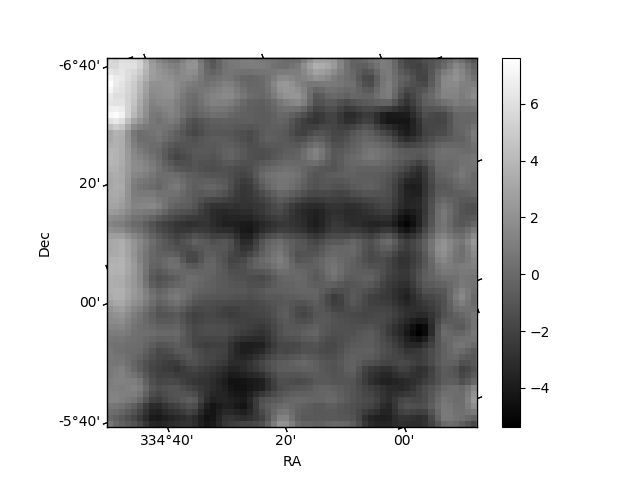
Histogram calculated using DETX and DETY for each event in the final _common_clean file
| Quadrant A | 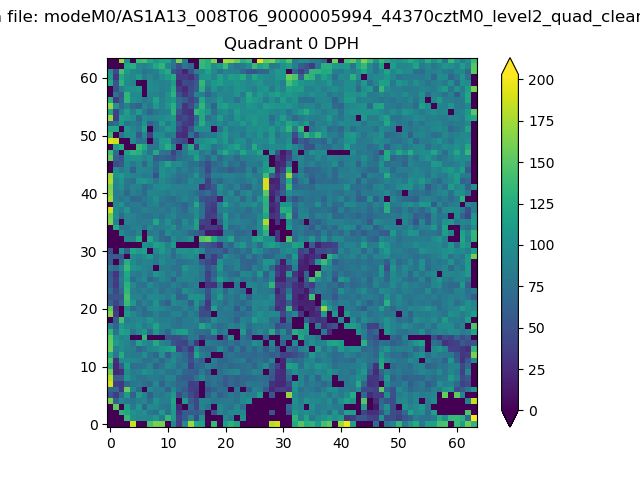 |
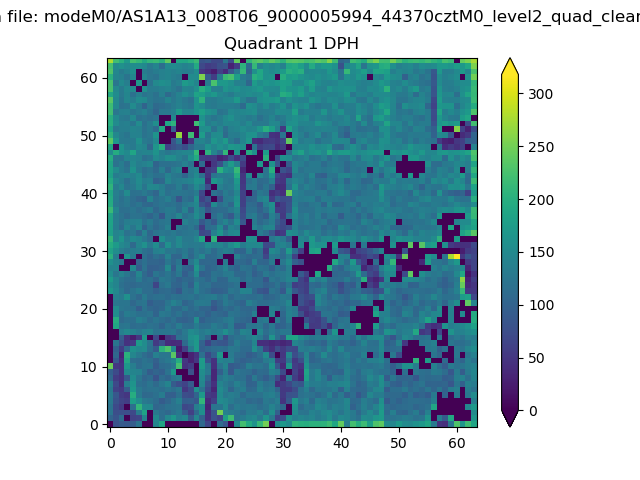 |
Quadrant B |
|---|---|---|---|
| Quadrant D | 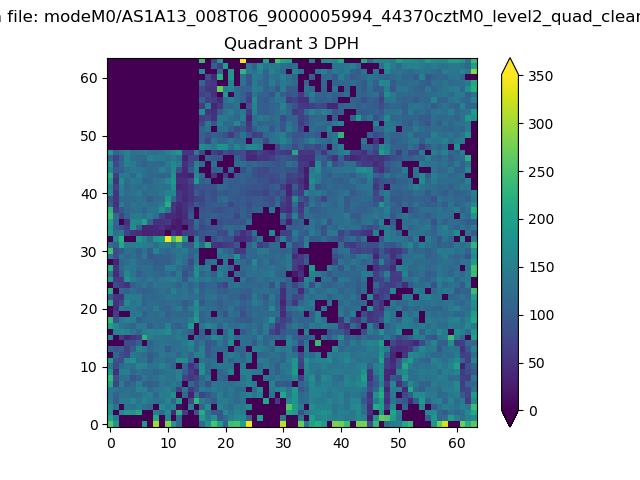 |
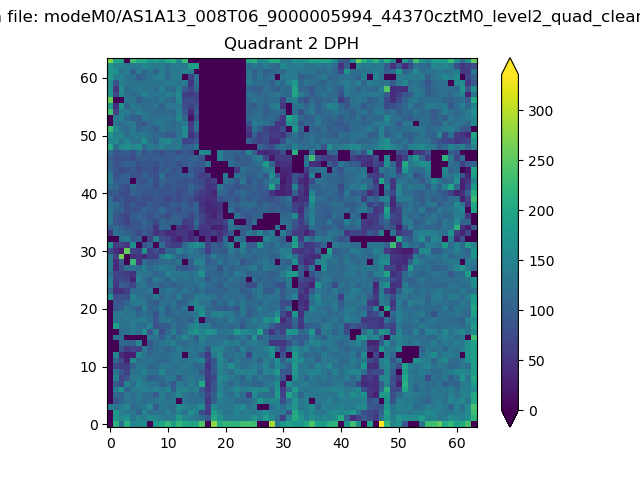 |
Quadrant C |
| Plot type | Count rate plots | Images |
|---|---|---|
| Comparison with Poisson distribution Blue bars denote a histogram of data divided into 1 sec bins. Red curve is a Poisson curve with rate = median count rate of data. |
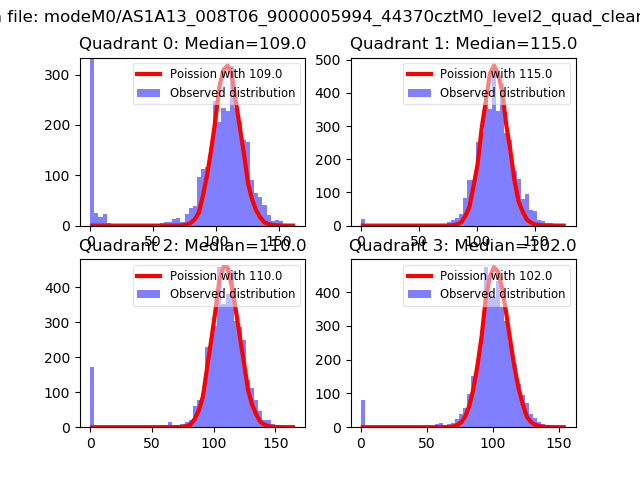 |
 |
| Quadrant-wise count rates Data is divided into 100 sec bins |
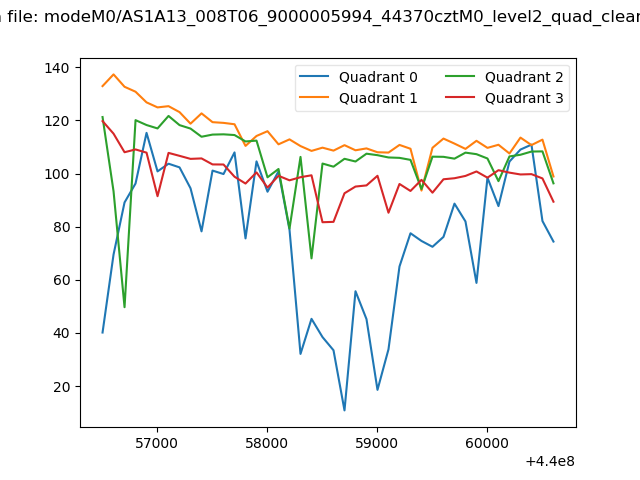 |
|
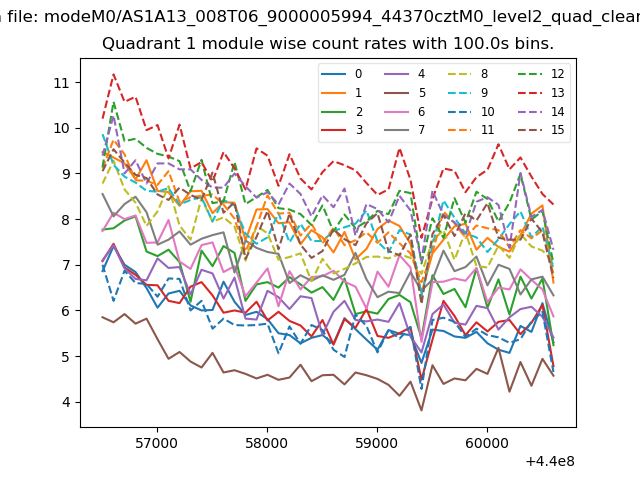
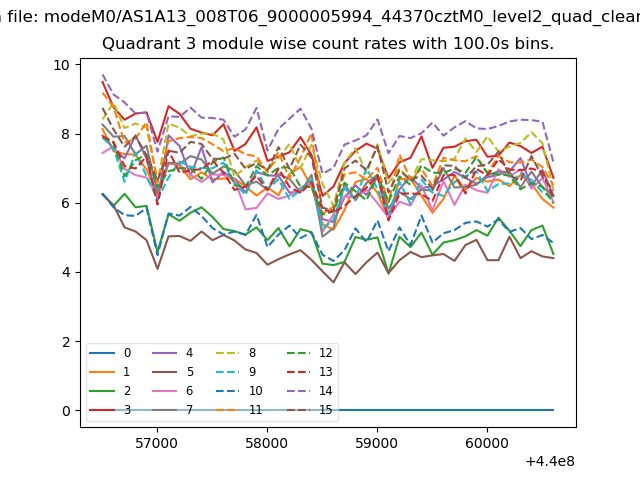
| Module-wise count rates for Quadrant A Data is divided into 100 sec bins |
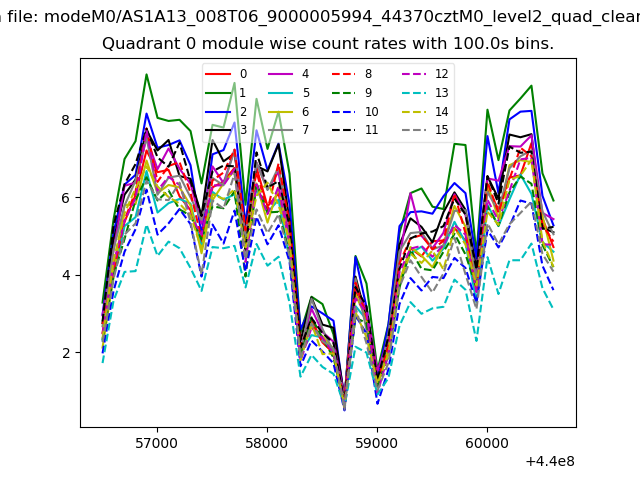 |
 |
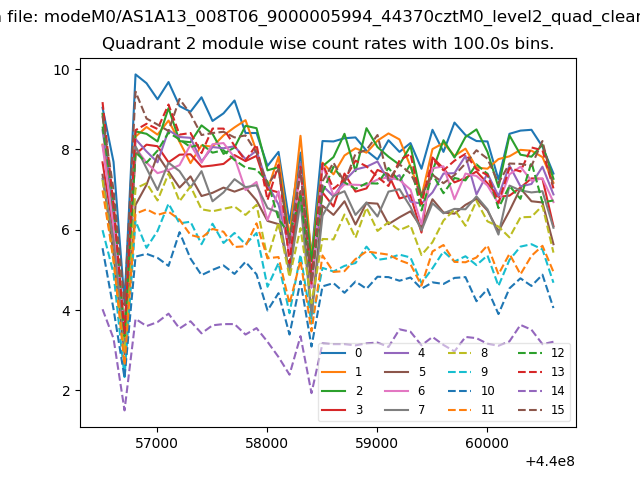
| Module-wise count rates for Quadrant B Data is divided into 100 sec bins |
 |
 |
| Module-wise count rates for Quadrant C Data is divided into 100 sec bins |
 |
 |
| Module-wise count rates for Quadrant D Data is divided into 100 sec bins |
 |
 |
| Parameter | Plot |
|---|---|
| CZT HV Monitor | 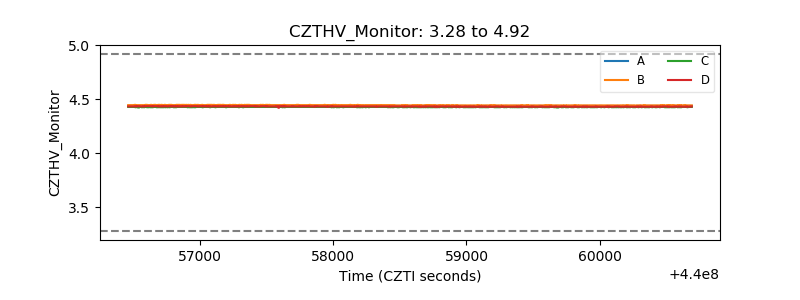 |
| D_VDD | 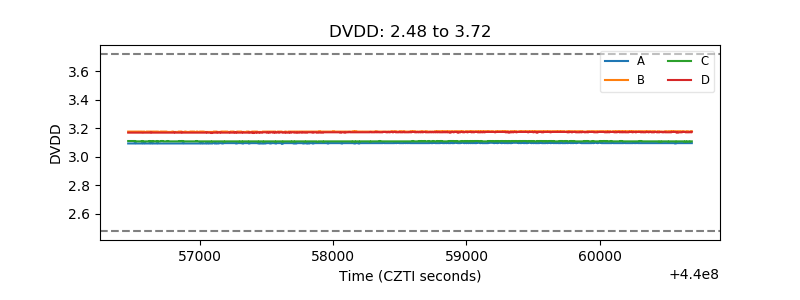 |
| Temperature 1 | 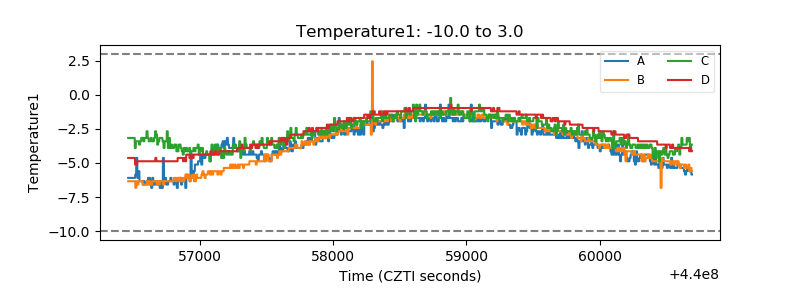 |
| Veto HV Monitor | 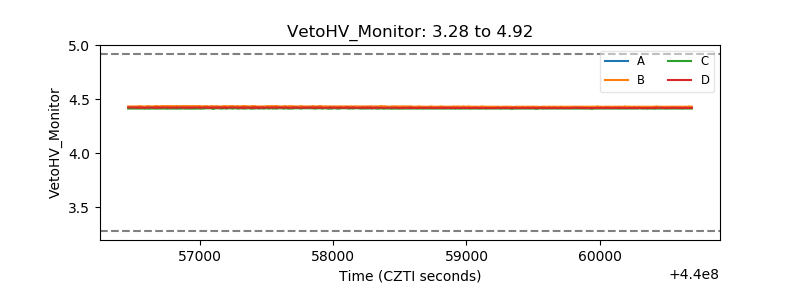 |
| Veto LLD | 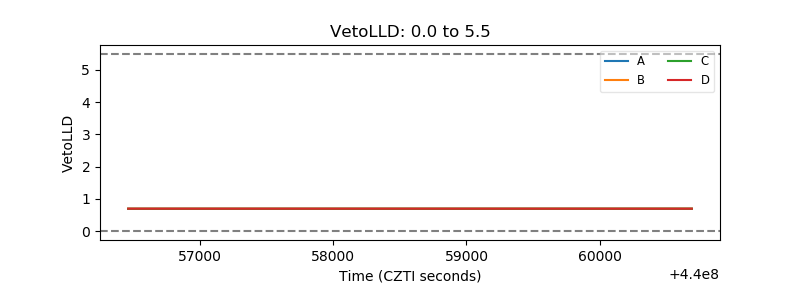 |
| Alpha Counter |  |
| _CPM_Rate | 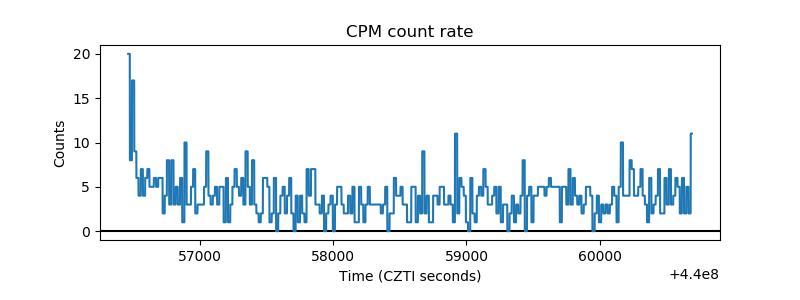 |
| CZT Counter | 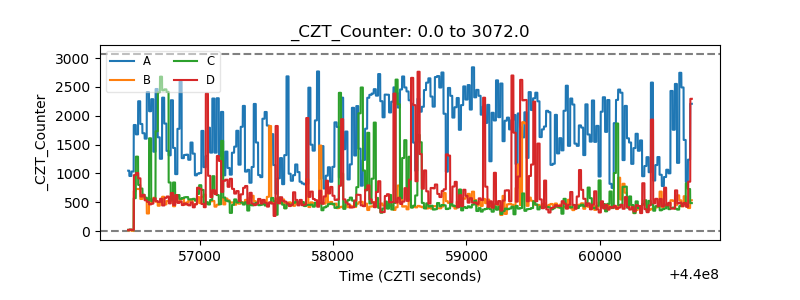 |
| +2.5 Volts monitor | 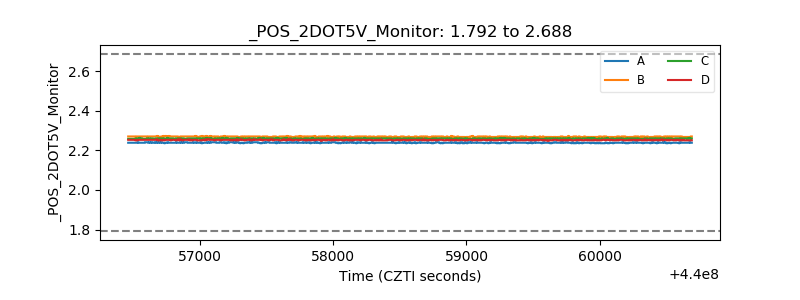 |
| +5 Volts monitor | 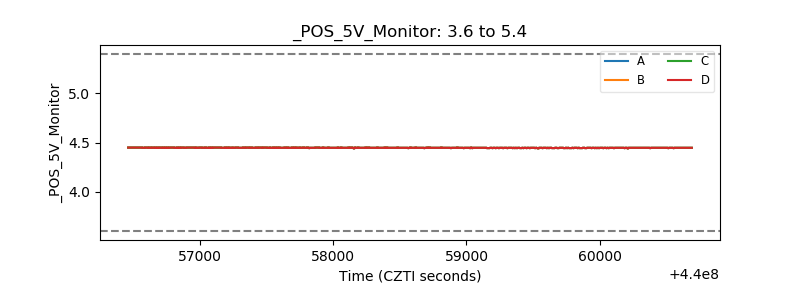 |
| _ROLL_ROT | 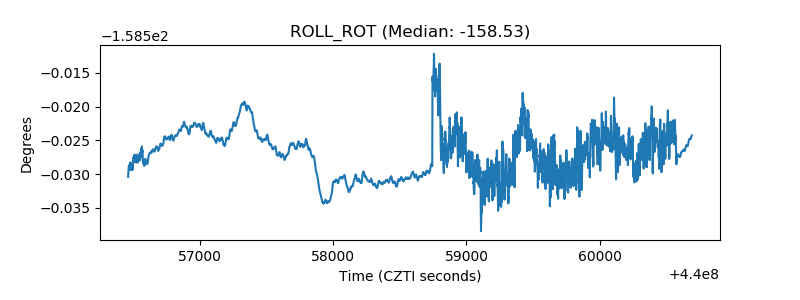 |
| _Roll_DEC | 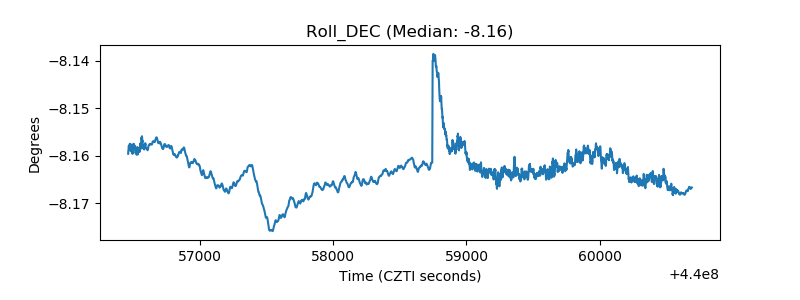 |
| _Roll_RA | 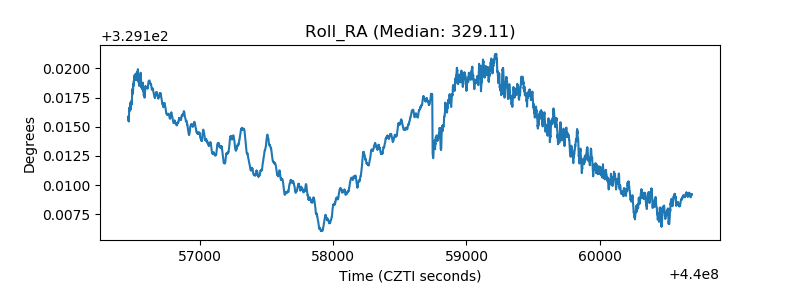 |
| Veto Counter | 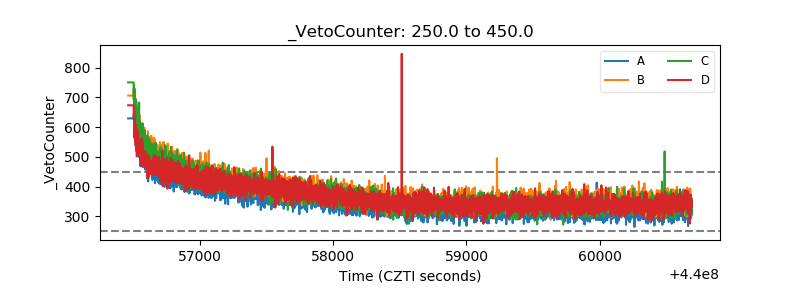 |