| Param | Original file | Final file |
|---|---|---|
| Filename | modeM0/AS1A13_008T05_9000005996_44370cztM0_level2.fits | modeM0/AS1A13_008T05_9000005996_44370cztM0_level2_quad_clean.evt |
| Size (bytes) | 167,832,000 | 35,634,240 |
| Size | 160.1 MB | 34.0 MB |
| Events in quadrant A | 2,177,510 | 229,222 |
| Events in quadrant B | 1,091,999 | 255,351 |
| Events in quadrant C | 1,418,324 | 228,729 |
| Events in quadrant D | 1,365,479 | 219,337 |
| Mode SS | |||
|---|---|---|---|
| Quadrant | BADHDUFLAG | Total packets | Discarded packets |
| A | 0 | 42 | 0 |
| B | 0 | 42 | 0 |
| C | 0 | 42 | 0 |
| D | 0 | 42 | 0 |
| Mode M0 | |||
|---|---|---|---|
| Quadrant | BADHDUFLAG | Total packets | Discarded packets |
| A | 0 | 7869 | 1 |
| B | 0 | 4421 | 1 |
| C | 0 | 5473 | 1 |
| D | 0 | 5333 | 1 |
| Mode M9 | |||
|---|---|---|---|
| Quadrant | BADHDUFLAG | Total packets | Discarded packets |
| A | 0 | 11 | 0 |
| B | 0 | 11 | 0 |
| C | 0 | 11 | 0 |
| D | 0 | 11 | 0 |
| Quadrant | Total seconds | Saturated seconds | Saturation percentage |
|---|---|---|---|
| A | 2019 | 249 | 12.332838% |
| B | 2019 | 76 | 3.764240% |
| C | 2019 | 182 | 9.014364% |
| D | 2019 | 91 | 4.507182% |
Noise dominated data is calculated using 1-second bins in cleaned event files. If a bin has >2000 counts, and if more than 50% of those come from <1% of pixels, then it is considered to be noise-dominated and hence unusable.
| Quadrant | # 1 sec bins | Bins with >0 counts | Bins with >2000 counts | High rate bins dominated by noise | Noise dominated (total time) | Noise dominated (detector-on time) | Marked lightcurve |
|---|---|---|---|---|---|---|---|
| A | 3094 | 2019 | 70 | 70 | 2.26% | 3.47% | 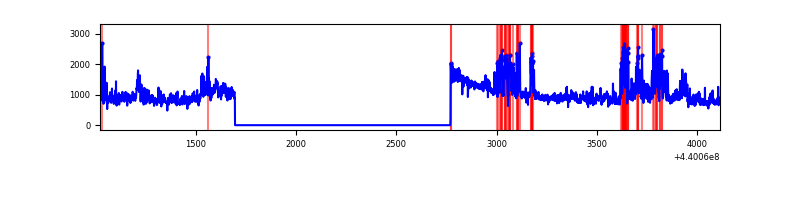 |
| B | 3094 | 2019 | 1 | 1 | 0.03% | 0.05% | 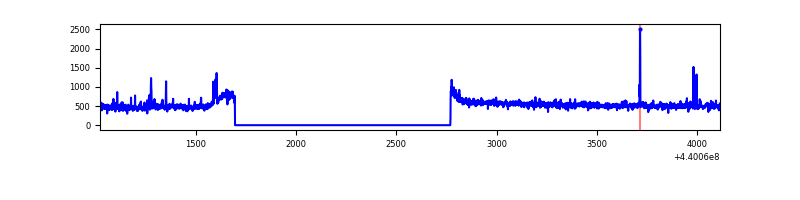 |
| C | 3093 | 2018 | 123 | 123 | 3.98% | 6.10% |  |
| D | 3094 | 2019 | 36 | 36 | 1.16% | 1.78% | 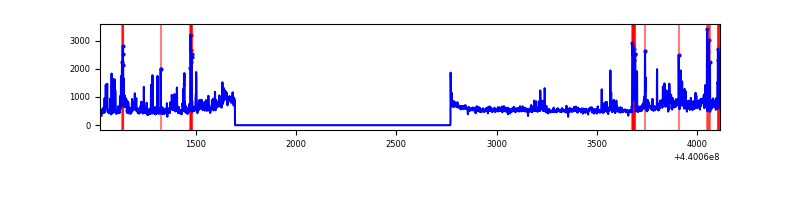 |
Top three noisy pixels from each quadrant. If the there are fewer than three noisy pixels in the level2.evt file, extra rows are filled as -1
| Pixel properties | Quadrant properties | ||||||
|---|---|---|---|---|---|---|---|
| Quadrant | DetID | PixID | Counts | Sigma | Mean | Median | Sigma |
| A | 10 | 83 | 554261 | 9866.74 | 262 | 256 | 56.1 |
| A | 15 | 223 | 338978 | 6032.59 | 262 | 256 | 56.1 |
| A | 13 | 248 | 259197 | 4611.7 | 262 | 256 | 56.1 |
| B | 5 | 255 | 15409 | 281.01 | 265 | 258 | 53.9 |
| B | 0 | 190 | 8319 | 149.51 | 265 | 258 | 53.9 |
| B | 12 | 111 | 6743 | 120.28 | 265 | 258 | 53.9 |
| C | 14 | 96 | 356357 | 5843.75 | 254 | 256 | 60.9 |
| C | 14 | 254 | 41069 | 669.76 | 254 | 256 | 60.9 |
| C | 1 | 3 | 18546 | 300.15 | 254 | 256 | 60.9 |
| D | 13 | 249 | 166800 | 2505.55 | 261 | 252 | 66.5 |
| D | 5 | 222 | 82619 | 1239.13 | 261 | 252 | 66.5 |
| D | 2 | 249 | 34228 | 511.14 | 261 | 252 | 66.5 |
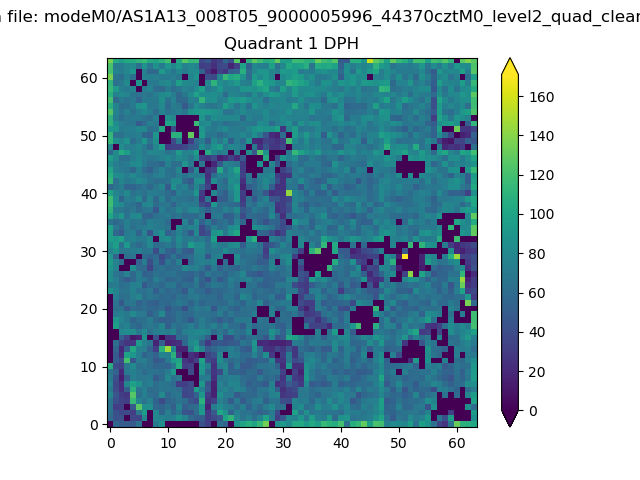
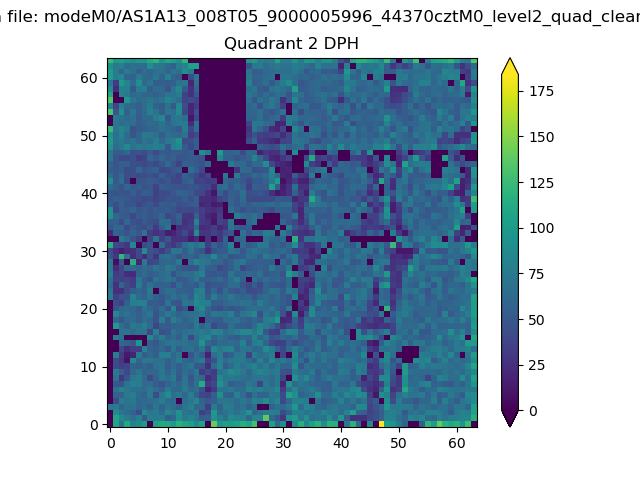
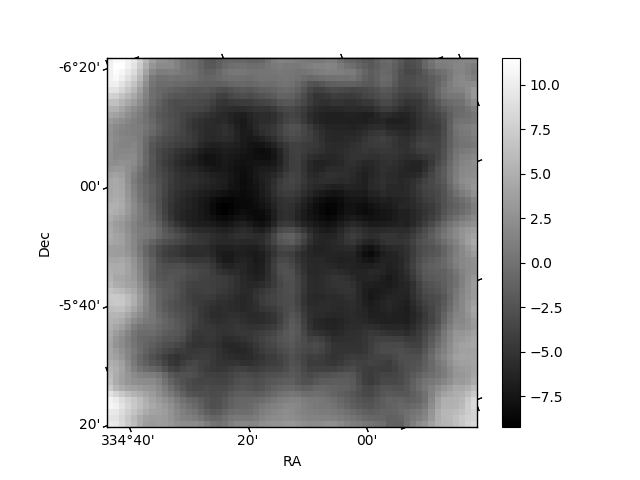
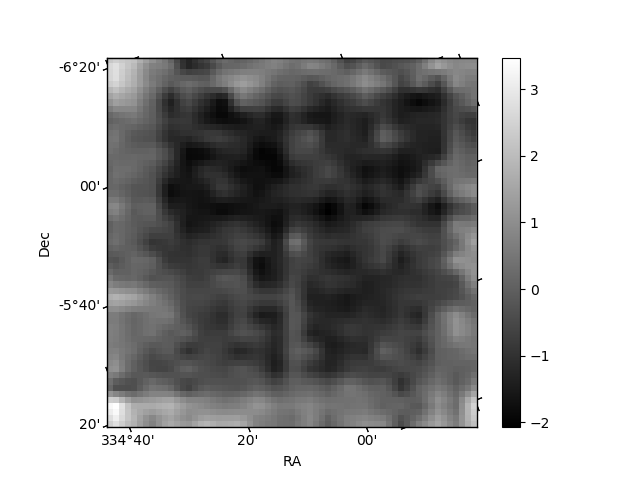
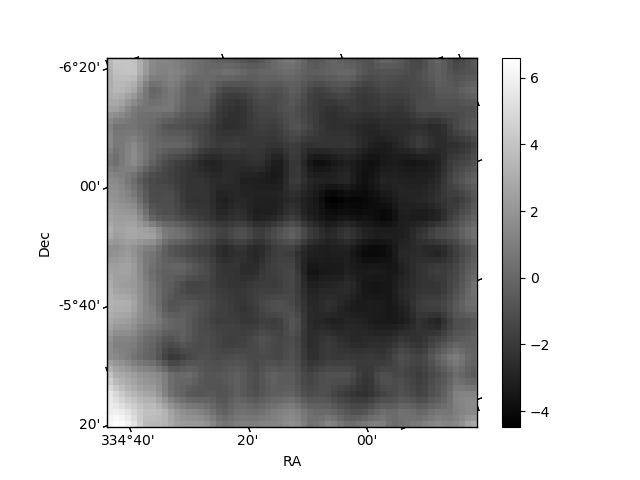
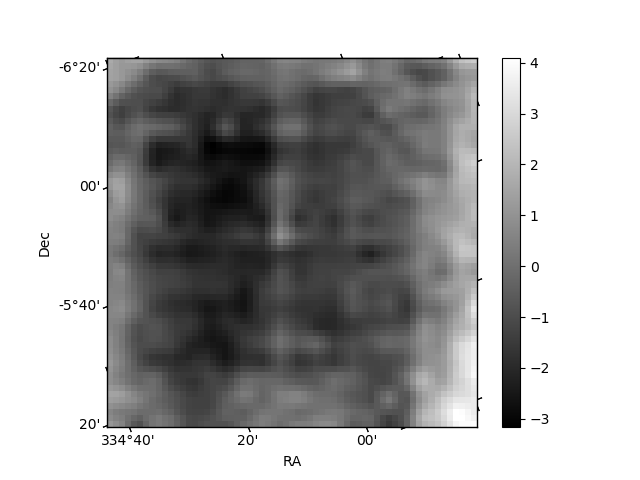
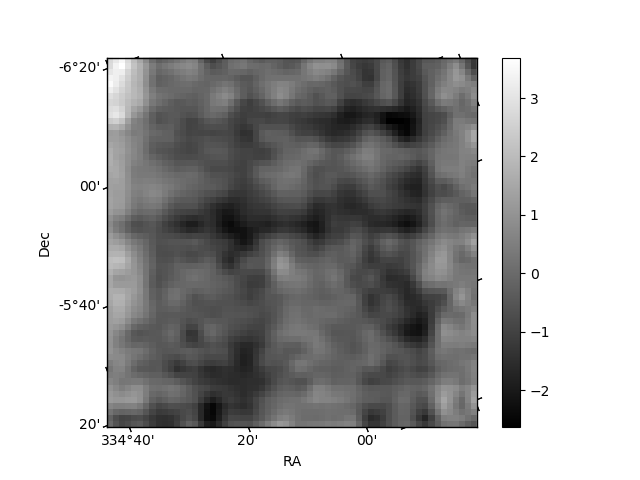
Histogram calculated using DETX and DETY for each event in the final _common_clean file
| Quadrant A | 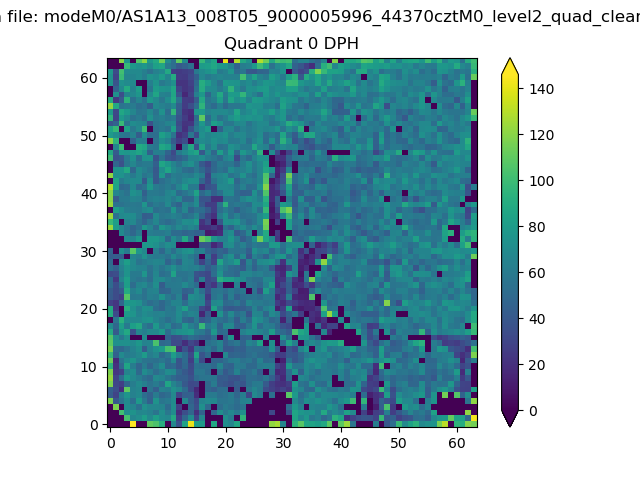 |
 |
Quadrant B |
|---|---|---|---|
| Quadrant D | 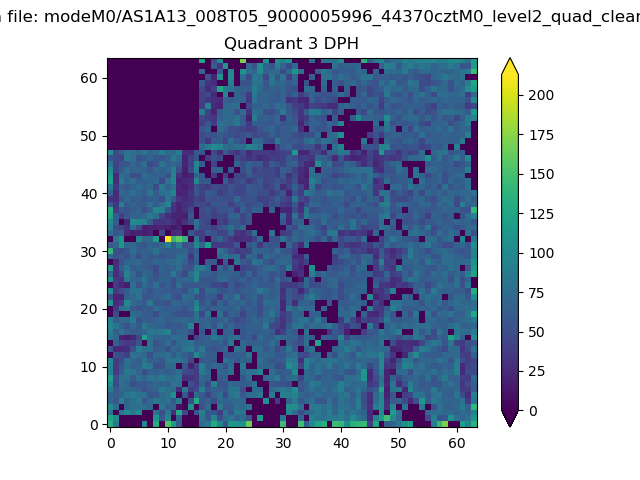 |
 |
Quadrant C |
| Plot type | Count rate plots | Images |
|---|---|---|
| Comparison with Poisson distribution Blue bars denote a histogram of data divided into 1 sec bins. Red curve is a Poisson curve with rate = median count rate of data. |
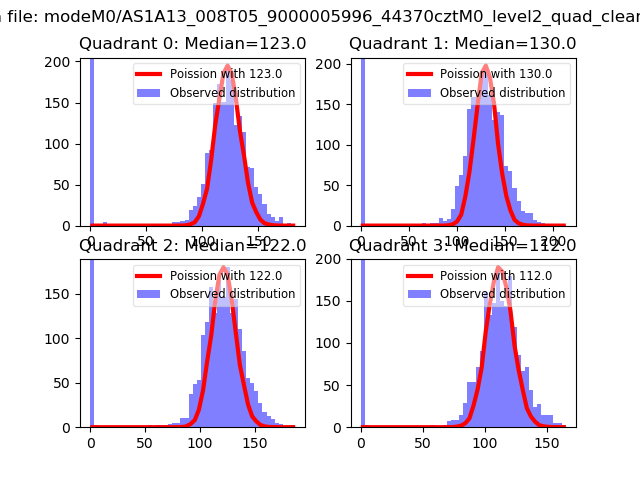 |
 |
| Quadrant-wise count rates Data is divided into 100 sec bins |
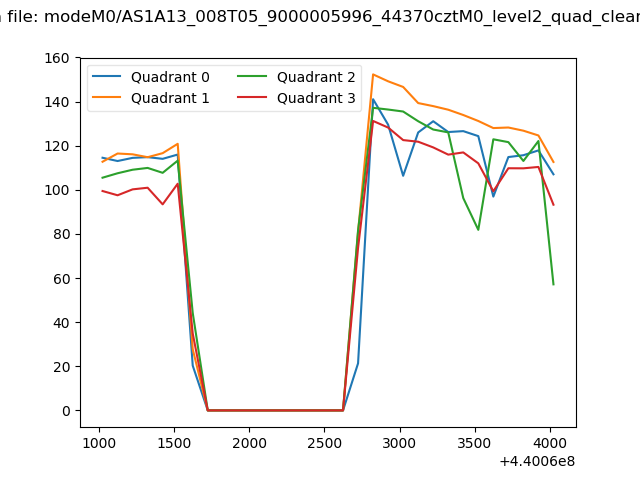 |
|
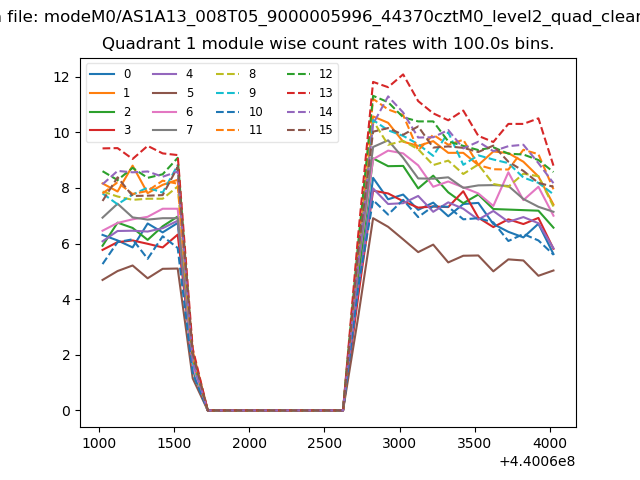
| Module-wise count rates for Quadrant A Data is divided into 100 sec bins |
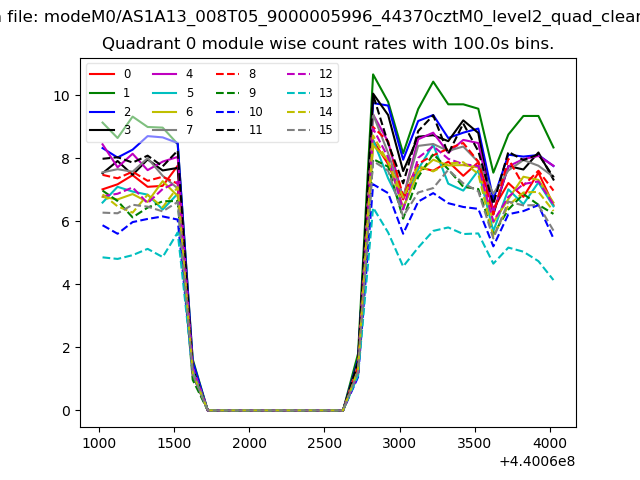 |
 |
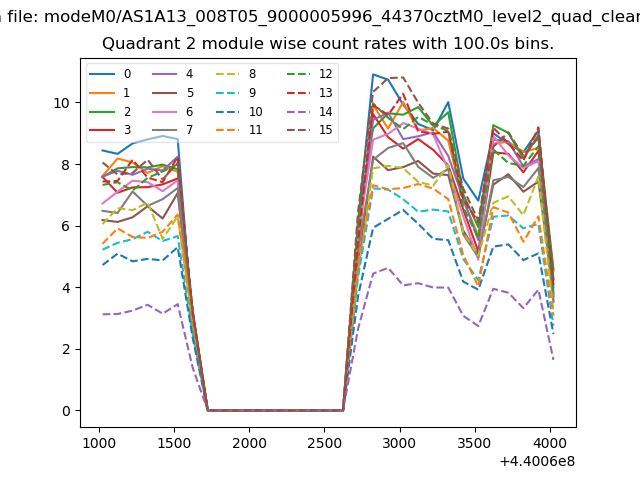
| Module-wise count rates for Quadrant B Data is divided into 100 sec bins |
 |
 |
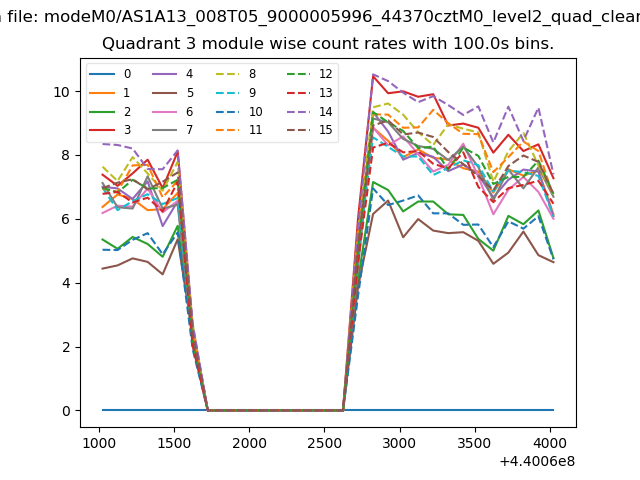
| Module-wise count rates for Quadrant C Data is divided into 100 sec bins |
 |
 |
| Module-wise count rates for Quadrant D Data is divided into 100 sec bins |
 |
 |
| Parameter | Plot |
|---|---|
| CZT HV Monitor | 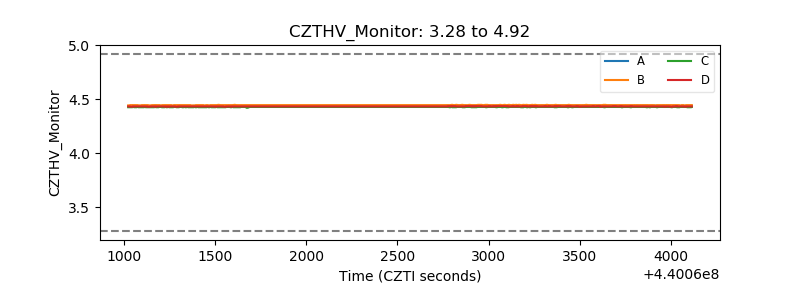 |
| D_VDD | 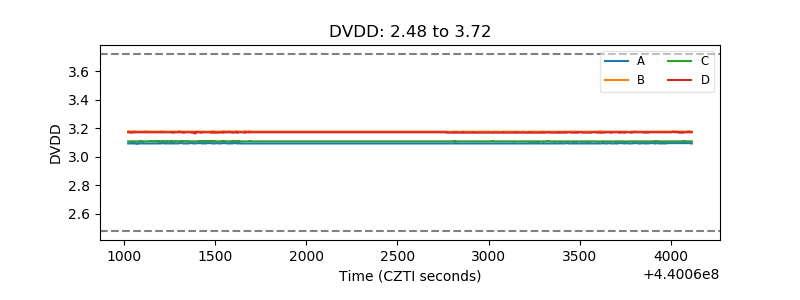 |
| Temperature 1 | 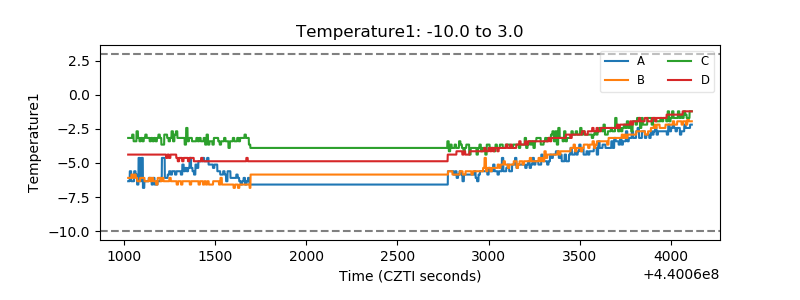 |
| Veto HV Monitor | 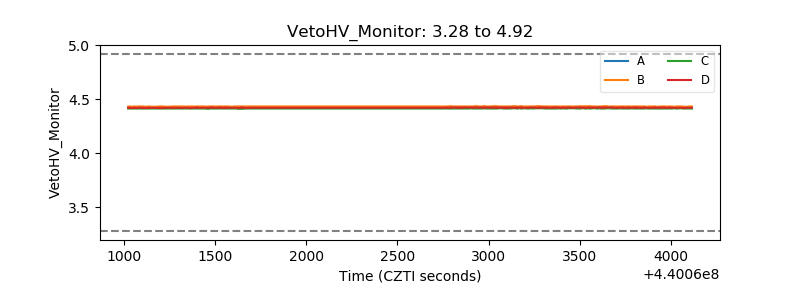 |
| Veto LLD | 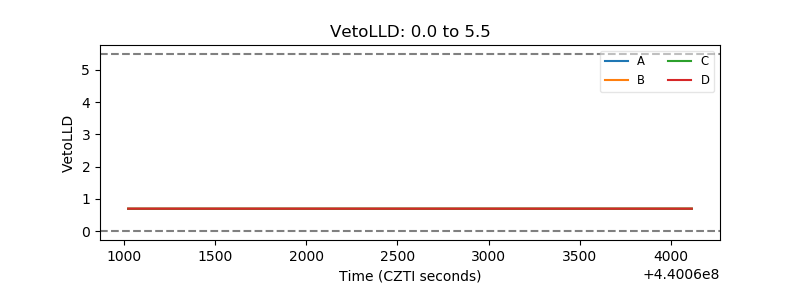 |
| Alpha Counter | 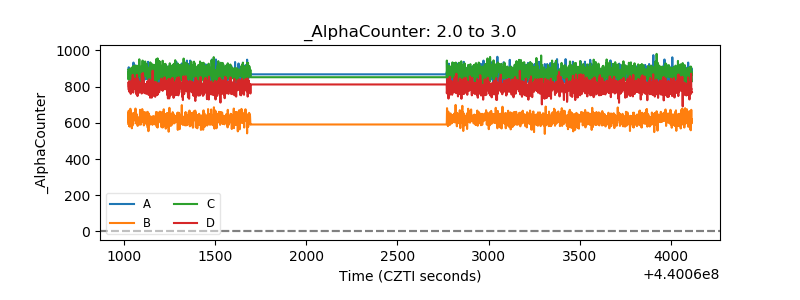 |
| _CPM_Rate | 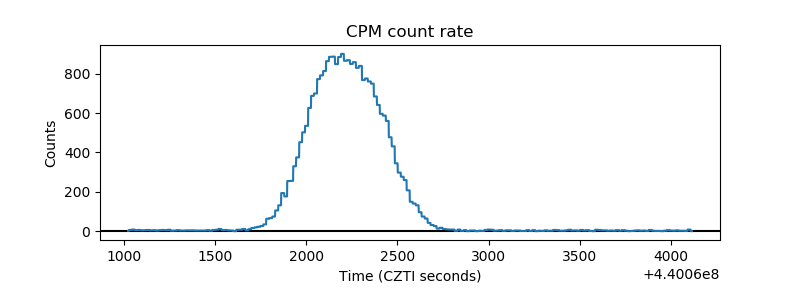 |
| CZT Counter | 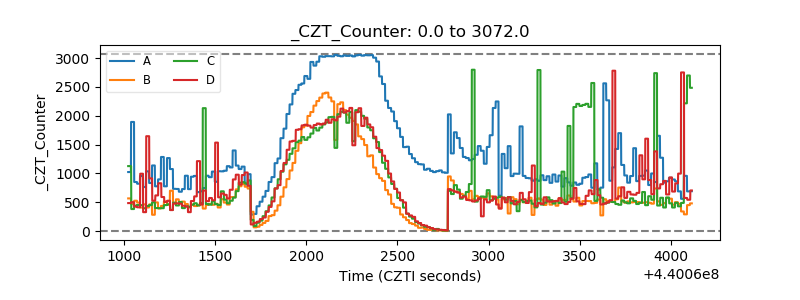 |
| +2.5 Volts monitor | 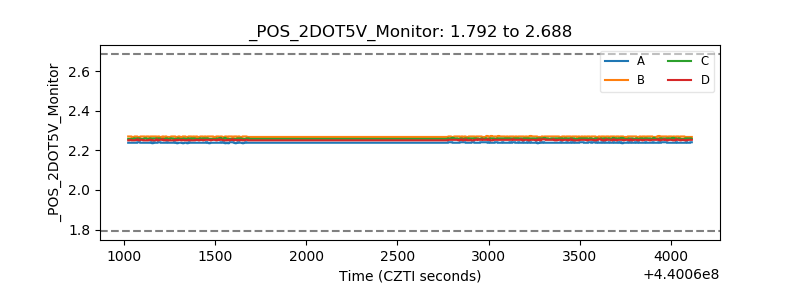 |
| +5 Volts monitor | 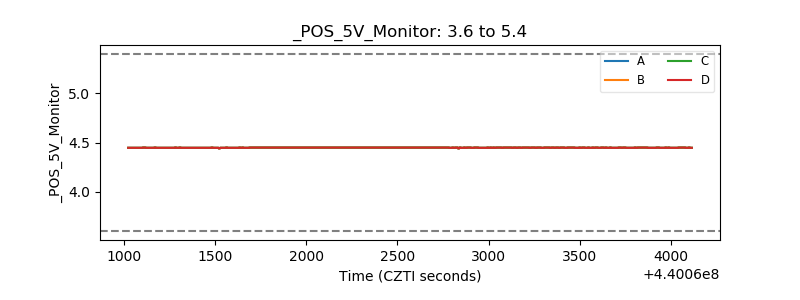 |
| _ROLL_ROT |  |
| _Roll_DEC | 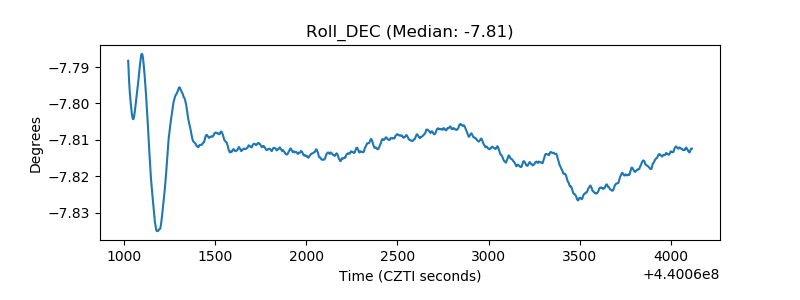 |
| _Roll_RA | 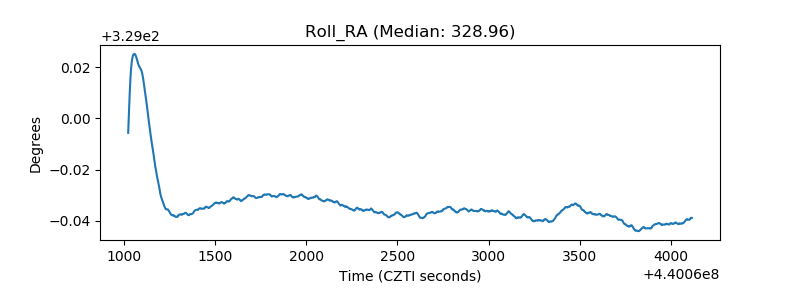 |
| Veto Counter | 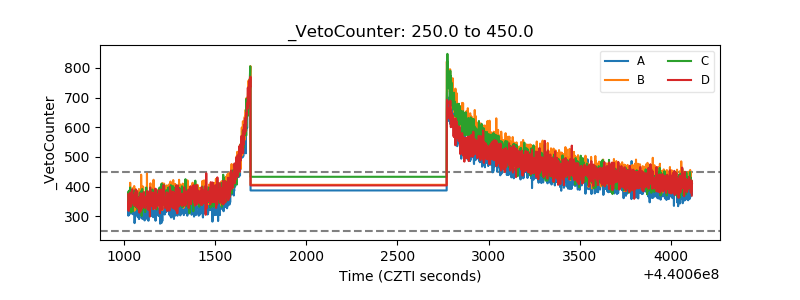 |