| Param | Original file | Final file |
|---|---|---|
| Filename | modeM0/AS1A13_008T05_9000005996_44372cztM0_level2.fits | modeM0/AS1A13_008T05_9000005996_44372cztM0_level2_quad_clean.evt |
| Size (bytes) | 490,944,960 | 102,153,600 |
| Size | 468.2 MB | 97.4 MB |
| Events in quadrant A | 7,446,178 | 602,551 |
| Events in quadrant B | 3,269,372 | 737,014 |
| Events in quadrant C | 3,042,826 | 700,874 |
| Events in quadrant D | 3,950,492 | 635,018 |
| Mode SS | |||
|---|---|---|---|
| Quadrant | BADHDUFLAG | Total packets | Discarded packets |
| A | 0 | 122 | 0 |
| B | 0 | 122 | 0 |
| C | 0 | 122 | 0 |
| D | 0 | 122 | 0 |
| Mode M0 | |||
|---|---|---|---|
| Quadrant | BADHDUFLAG | Total packets | Discarded packets |
| A | 0 | 26586 | 1 |
| B | 0 | 13519 | 1 |
| C | 0 | 12999 | 1 |
| D | 0 | 15604 | 1 |
| Mode M9 | |||
|---|---|---|---|
| Quadrant | BADHDUFLAG | Total packets | Discarded packets |
| A | 0 | 12 | 0 |
| B | 0 | 12 | 0 |
| C | 0 | 12 | 0 |
| D | 0 | 12 | 0 |
| Quadrant | Total seconds | Saturated seconds | Saturation percentage |
|---|---|---|---|
| A | 5978 | 1288 | 21.545667% |
| B | 5978 | 140 | 2.341920% |
| C | 5979 | 75 | 1.254390% |
| D | 5979 | 239 | 3.997324% |
Noise dominated data is calculated using 1-second bins in cleaned event files. If a bin has >2000 counts, and if more than 50% of those come from <1% of pixels, then it is considered to be noise-dominated and hence unusable.
| Quadrant | # 1 sec bins | Bins with >0 counts | Bins with >2000 counts | High rate bins dominated by noise | Noise dominated (total time) | Noise dominated (detector-on time) | Marked lightcurve |
|---|---|---|---|---|---|---|---|
| A | 7152 | 5977 | 1024 | 1024 | 14.32% | 17.13% | 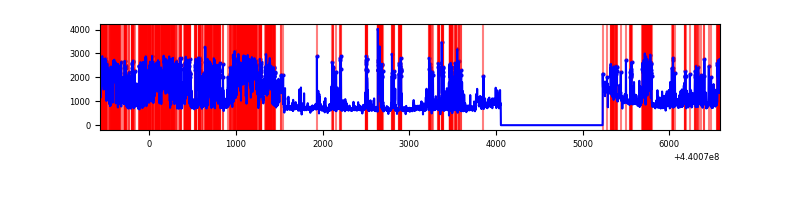 |
| B | 7153 | 5978 | 35 | 35 | 0.49% | 0.59% | 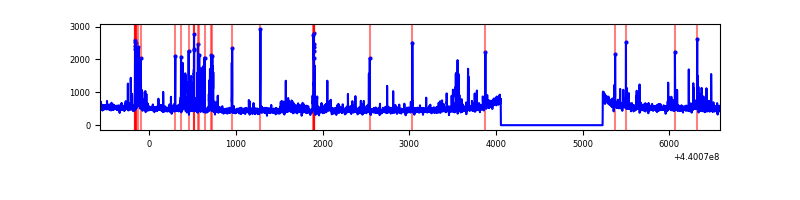 |
| C | 7154 | 5979 | 27 | 27 | 0.38% | 0.45% | 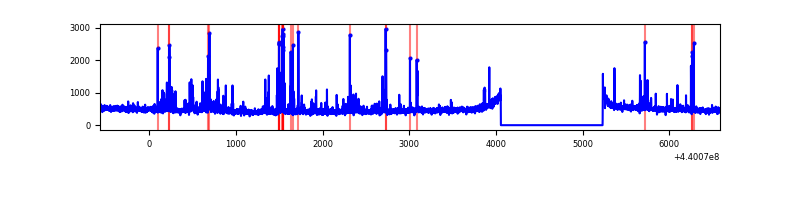 |
| D | 7154 | 5979 | 164 | 164 | 2.29% | 2.74% | 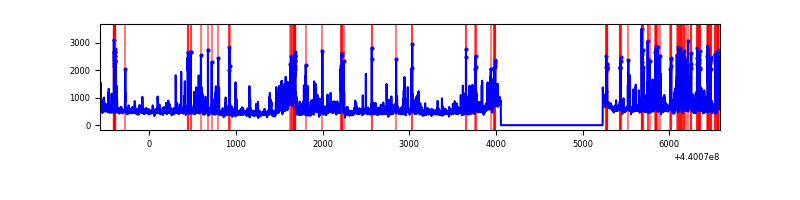 |
Top three noisy pixels from each quadrant. If the there are fewer than three noisy pixels in the level2.evt file, extra rows are filled as -1
| Pixel properties | Quadrant properties | ||||||
|---|---|---|---|---|---|---|---|
| Quadrant | DetID | PixID | Counts | Sigma | Mean | Median | Sigma |
| A | 15 | 223 | 2419441 | 17591.84 | 666 | 654 | 137.5 |
| A | 10 | 83 | 1496539 | 10879.57 | 666 | 654 | 137.5 |
| A | 13 | 248 | 912610 | 6632.66 | 666 | 654 | 137.5 |
| B | 5 | 255 | 101493 | 699.16 | 724 | 703 | 144.2 |
| B | 15 | 36 | 87749 | 603.82 | 724 | 703 | 144.2 |
| B | 7 | 221 | 57572 | 394.49 | 724 | 703 | 144.2 |
| C | 14 | 254 | 187038 | 1135.83 | 700 | 704 | 164.1 |
| C | 14 | 96 | 58623 | 353.05 | 700 | 704 | 164.1 |
| C | 2 | 14 | 24476 | 144.91 | 700 | 704 | 164.1 |
| D | 13 | 249 | 371996 | 2106.62 | 700 | 680 | 176.3 |
| D | 1 | 52 | 156261 | 882.67 | 700 | 680 | 176.3 |
| D | 7 | 55 | 121826 | 687.31 | 700 | 680 | 176.3 |
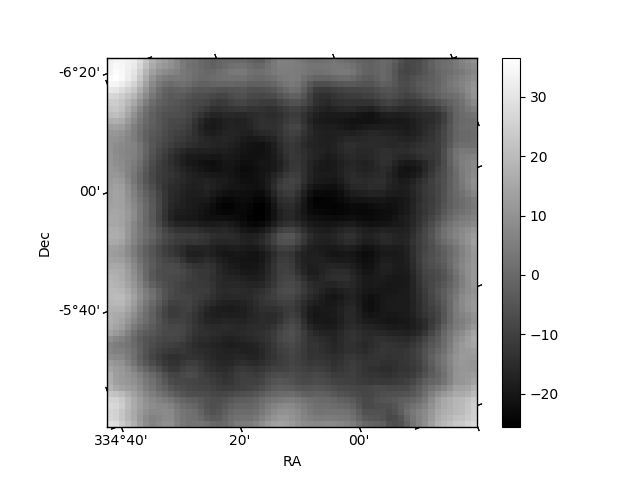
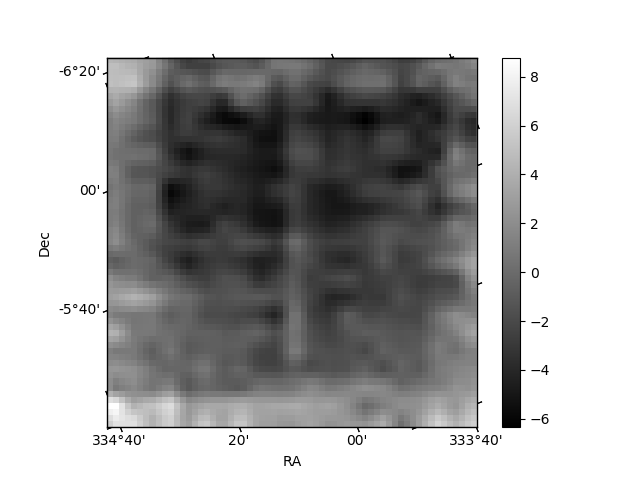
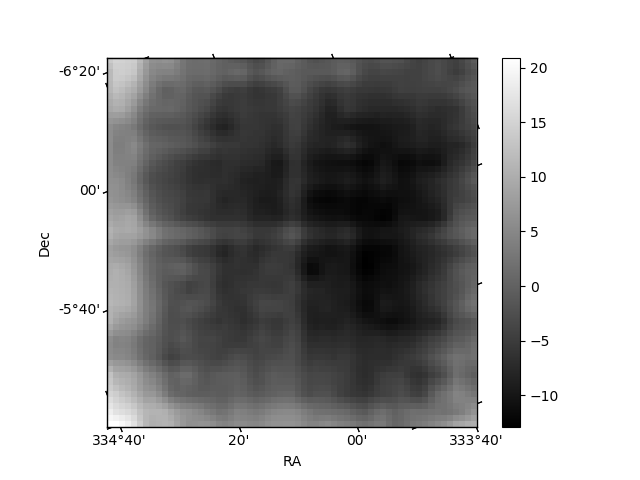
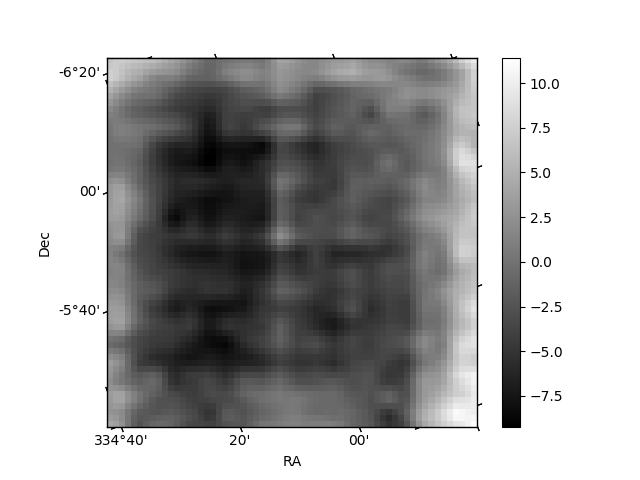
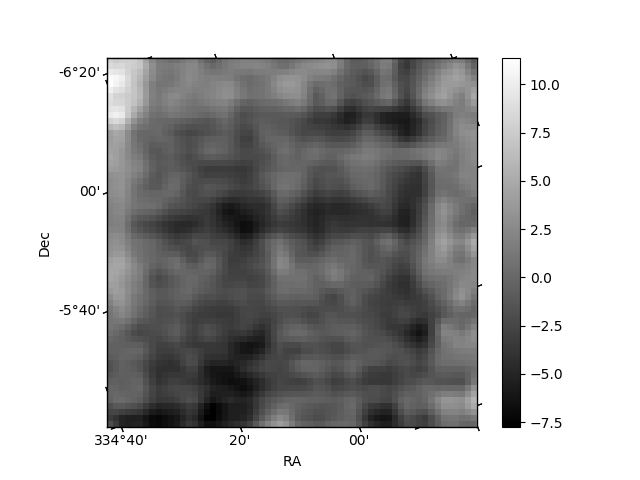
Histogram calculated using DETX and DETY for each event in the final _common_clean file
| Quadrant A | 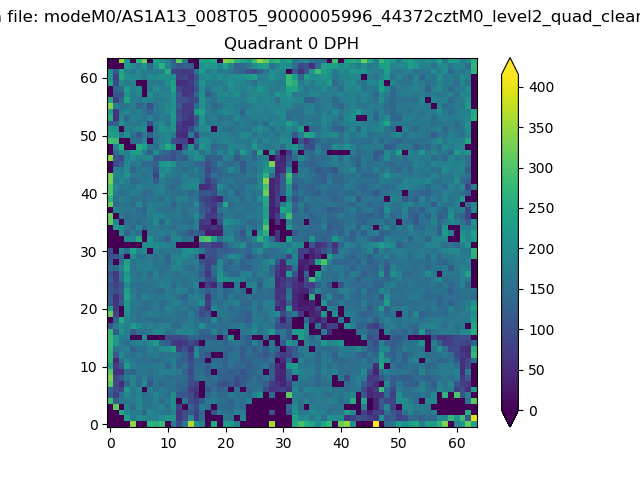 |
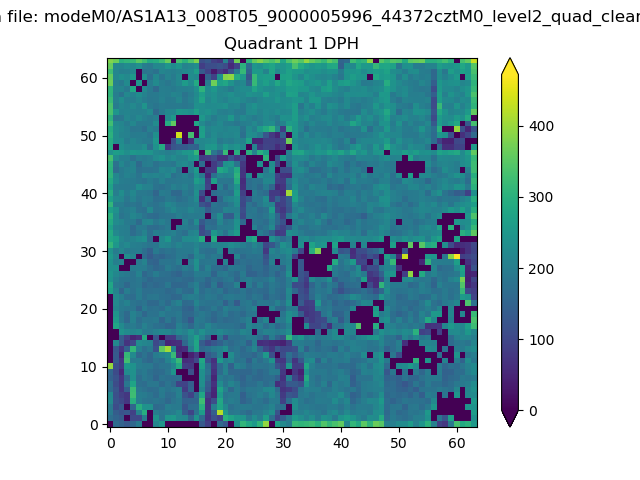 |
Quadrant B |
|---|---|---|---|
| Quadrant D | 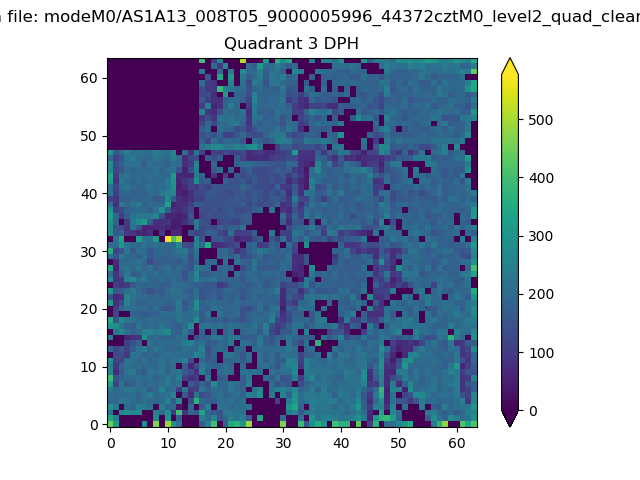 |
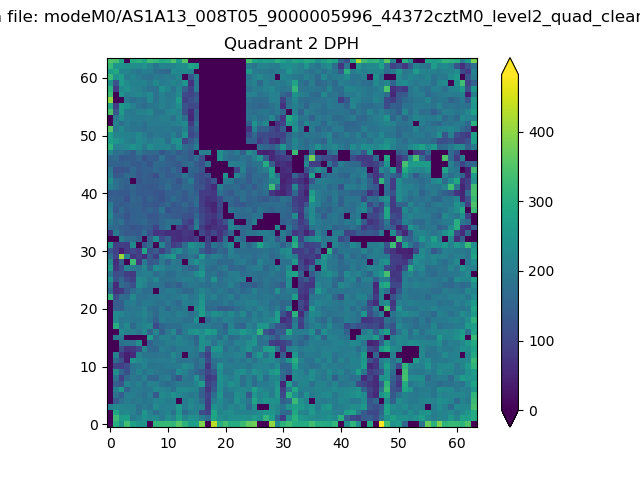 |
Quadrant C |
| Plot type | Count rate plots | Images |
|---|---|---|
| Comparison with Poisson distribution Blue bars denote a histogram of data divided into 1 sec bins. Red curve is a Poisson curve with rate = median count rate of data. |
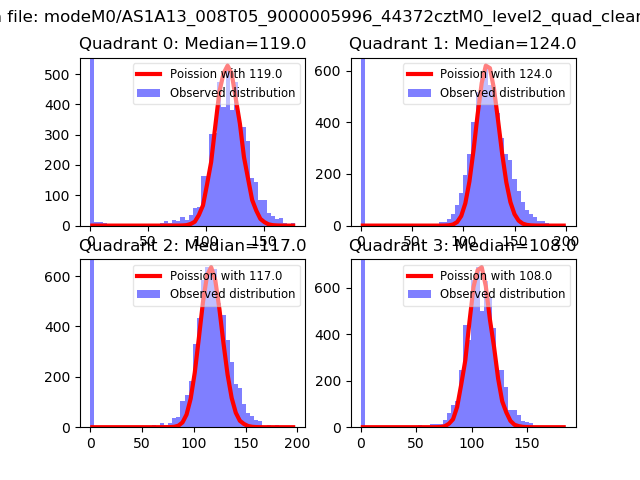 |
 |
| Quadrant-wise count rates Data is divided into 100 sec bins |
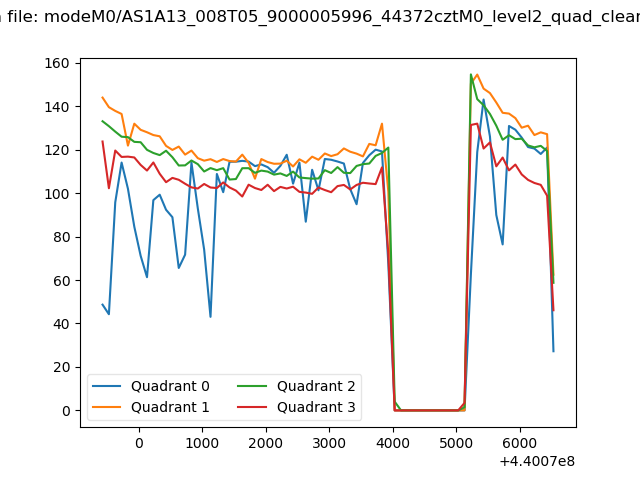 |
|
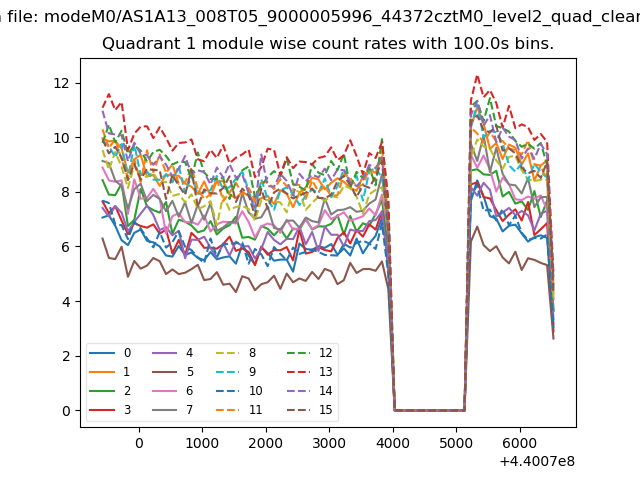
| Module-wise count rates for Quadrant A Data is divided into 100 sec bins |
 |
 |
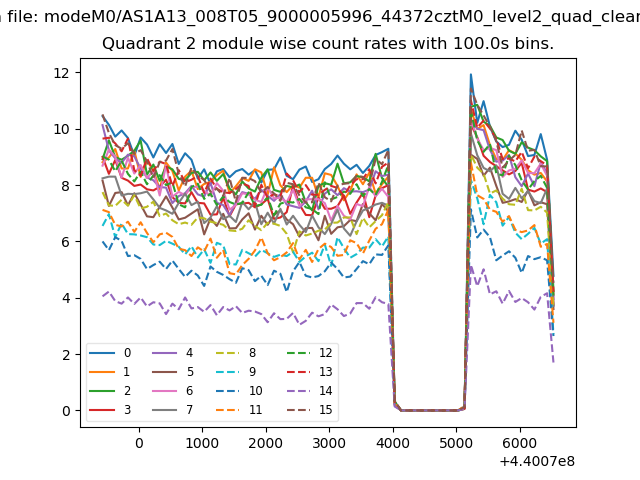
| Module-wise count rates for Quadrant B Data is divided into 100 sec bins |
 |
 |
| Module-wise count rates for Quadrant C Data is divided into 100 sec bins |
 |
 |
| Module-wise count rates for Quadrant D Data is divided into 100 sec bins |
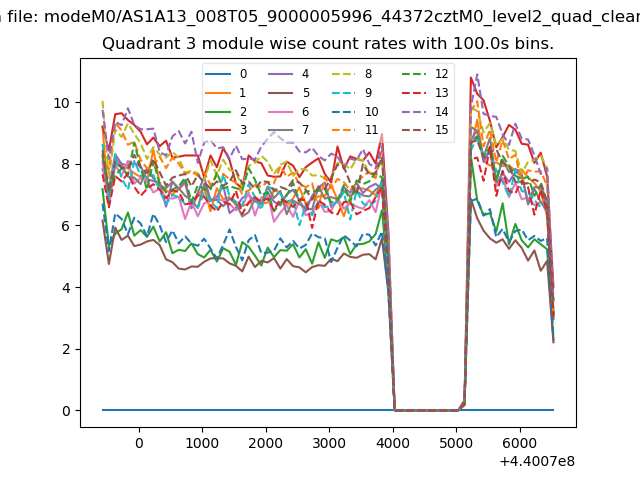 |
 |
| Parameter | Plot |
|---|---|
| CZT HV Monitor | 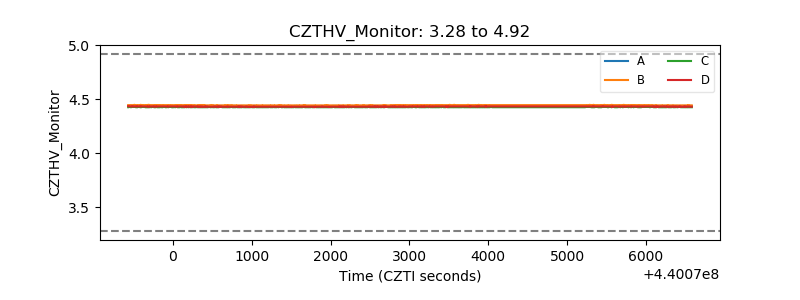 |
| D_VDD | 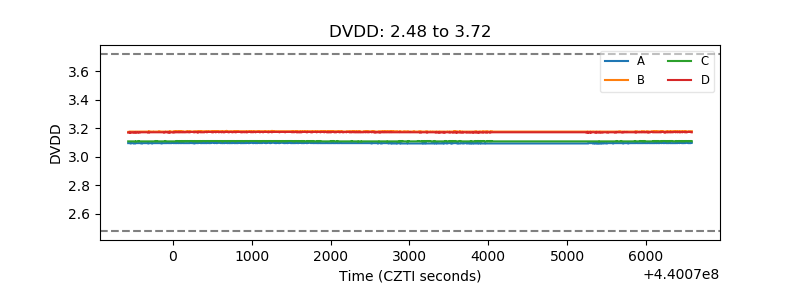 |
| Temperature 1 | 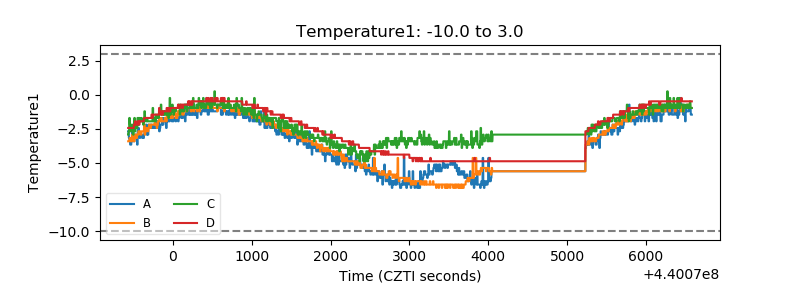 |
| Veto HV Monitor | 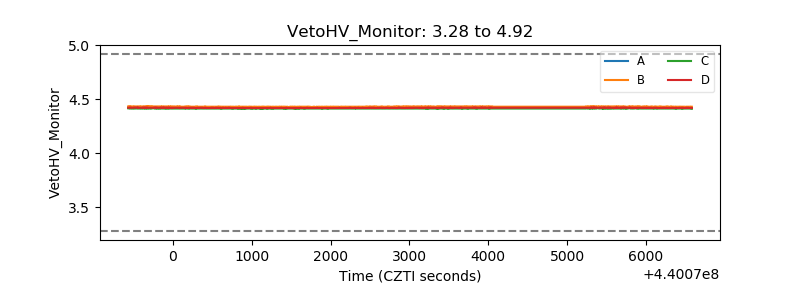 |
| Veto LLD | 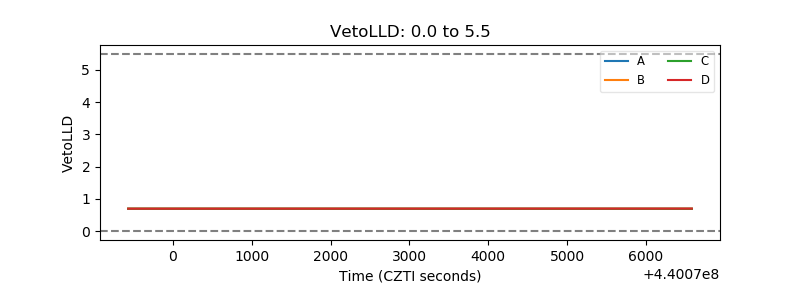 |
| Alpha Counter | 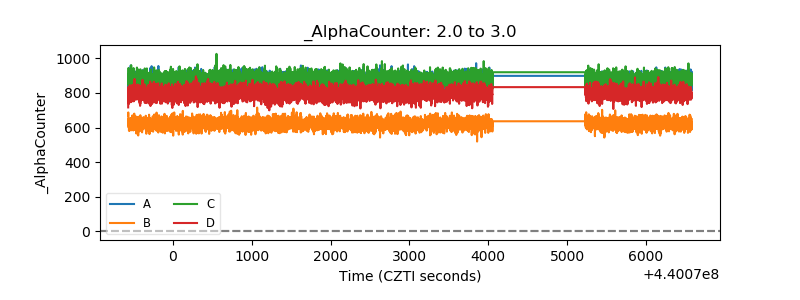 |
| _CPM_Rate | 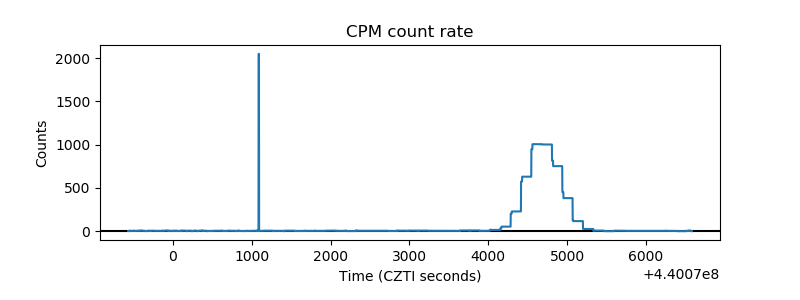 |
| CZT Counter | 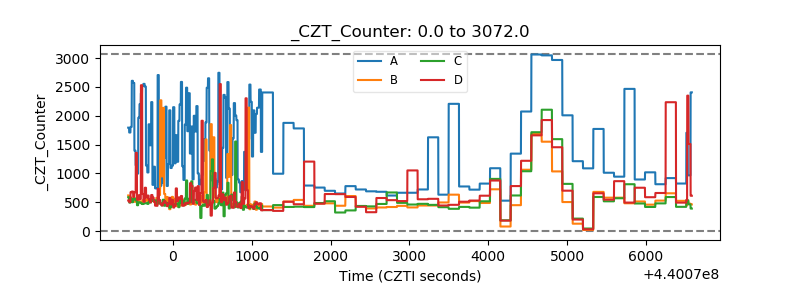 |
| +2.5 Volts monitor | 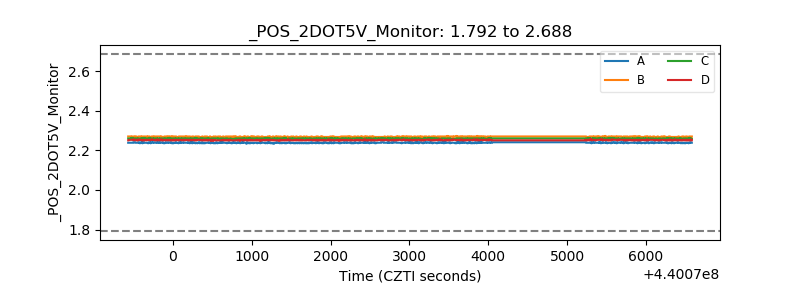 |
| +5 Volts monitor | 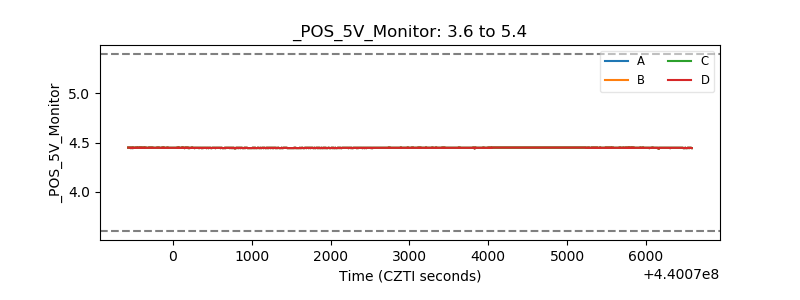 |
| _ROLL_ROT | 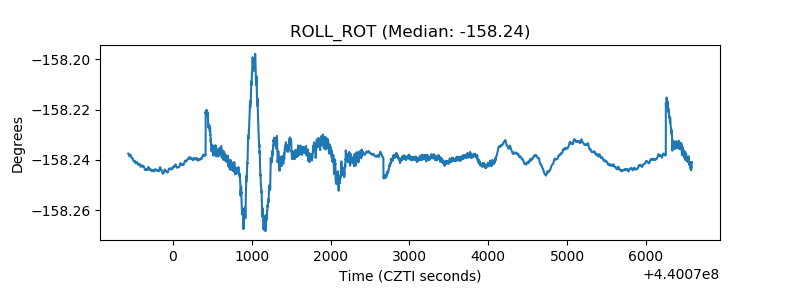 |
| _Roll_DEC | 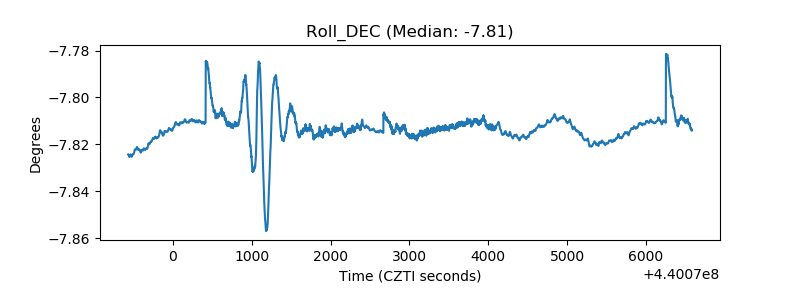 |
| _Roll_RA | 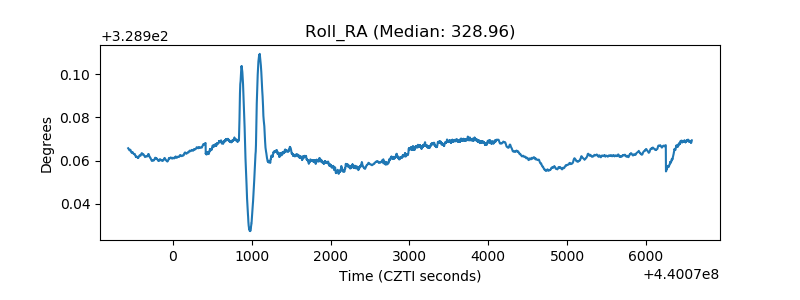 |
| Veto Counter |  |