| Param | Original file | Final file |
|---|---|---|
| Filename | modeM0/AS1A13_008T05_9000005996_44375cztM0_level2.fits | modeM0/AS1A13_008T05_9000005996_44375cztM0_level2_quad_clean.evt |
| Size (bytes) | 518,690,880 | 108,031,680 |
| Size | 494.7 MB | 103.0 MB |
| Events in quadrant A | 5,705,988 | 735,111 |
| Events in quadrant B | 3,254,678 | 758,540 |
| Events in quadrant C | 3,340,579 | 723,098 |
| Events in quadrant D | 6,379,481 | 587,185 |
| Mode SS | |||
|---|---|---|---|
| Quadrant | BADHDUFLAG | Total packets | Discarded packets |
| A | 0 | 136 | 0 |
| B | 0 | 136 | 0 |
| C | 0 | 136 | 0 |
| D | 0 | 136 | 0 |
| Mode M0 | |||
|---|---|---|---|
| Quadrant | BADHDUFLAG | Total packets | Discarded packets |
| A | 0 | 22208 | 1 |
| B | 0 | 14170 | 1 |
| C | 0 | 14746 | 1 |
| D | 0 | 23660 | 5 |
| Mode M9 | |||
|---|---|---|---|
| Quadrant | BADHDUFLAG | Total packets | Discarded packets |
| A | 0 | 8 | 0 |
| B | 0 | 8 | 0 |
| C | 0 | 8 | 0 |
| D | 0 | 8 | 0 |
| Quadrant | Total seconds | Saturated seconds | Saturation percentage |
|---|---|---|---|
| A | 6697 | 202 | 3.016276% |
| B | 6698 | 73 | 1.089878% |
| C | 6698 | 64 | 0.955509% |
| D | 6697 | 939 | 14.021204% |
Noise dominated data is calculated using 1-second bins in cleaned event files. If a bin has >2000 counts, and if more than 50% of those come from <1% of pixels, then it is considered to be noise-dominated and hence unusable.
| Quadrant | # 1 sec bins | Bins with >0 counts | Bins with >2000 counts | High rate bins dominated by noise | Noise dominated (total time) | Noise dominated (detector-on time) | Marked lightcurve |
|---|---|---|---|---|---|---|---|
| A | 7527 | 6698 | 106 | 106 | 1.41% | 1.58% | 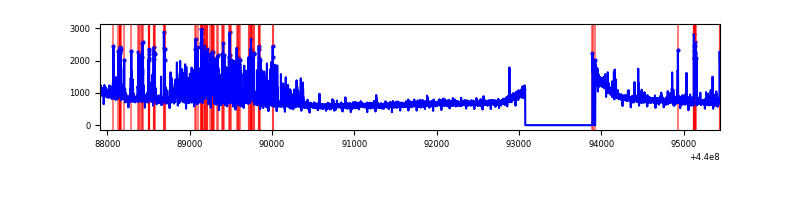 |
| B | 7528 | 6699 | 10 | 10 | 0.13% | 0.15% | 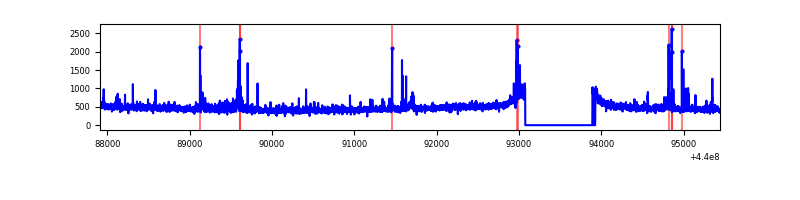 |
| C | 7528 | 6700 | 48 | 48 | 0.64% | 0.72% | 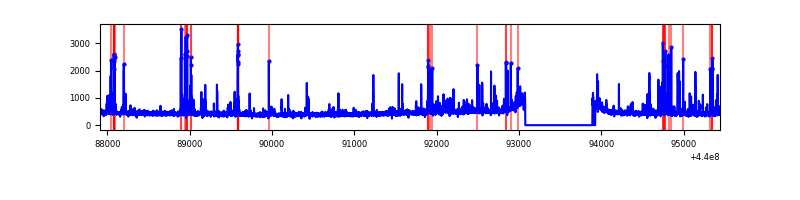 |
| D | 7527 | 6699 | 853 | 853 | 11.33% | 12.73% | 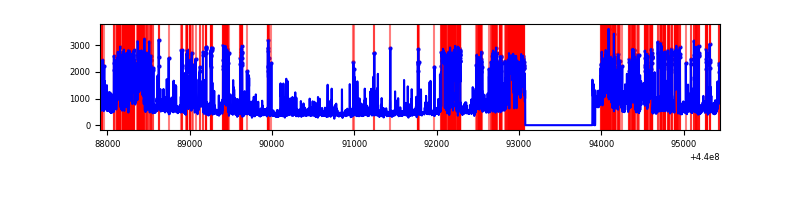 |
Top three noisy pixels from each quadrant. If the there are fewer than three noisy pixels in the level2.evt file, extra rows are filled as -1
| Pixel properties | Quadrant properties | ||||||
|---|---|---|---|---|---|---|---|
| Quadrant | DetID | PixID | Counts | Sigma | Mean | Median | Sigma |
| A | 10 | 83 | 1802178 | 11309.61 | 762 | 746 | 159.3 |
| A | 15 | 223 | 694385 | 4354.75 | 762 | 746 | 159.3 |
| A | 13 | 248 | 114920 | 716.8 | 762 | 746 | 159.3 |
| B | 0 | 190 | 75071 | 486.47 | 767 | 742 | 152.8 |
| B | 0 | 219 | 26798 | 170.53 | 767 | 742 | 152.8 |
| B | 4 | 173 | 22616 | 143.16 | 767 | 742 | 152.8 |
| C | 14 | 254 | 267894 | 1524.82 | 742 | 747 | 175.2 |
| C | 15 | 158 | 77481 | 437.98 | 742 | 747 | 175.2 |
| C | 14 | 96 | 49671 | 279.25 | 742 | 747 | 175.2 |
| D | 13 | 249 | 1276491 | 7187.76 | 698 | 675 | 177.5 |
| D | 1 | 52 | 846917 | 4767.6 | 698 | 675 | 177.5 |
| D | 5 | 235 | 415559 | 2337.4 | 698 | 675 | 177.5 |
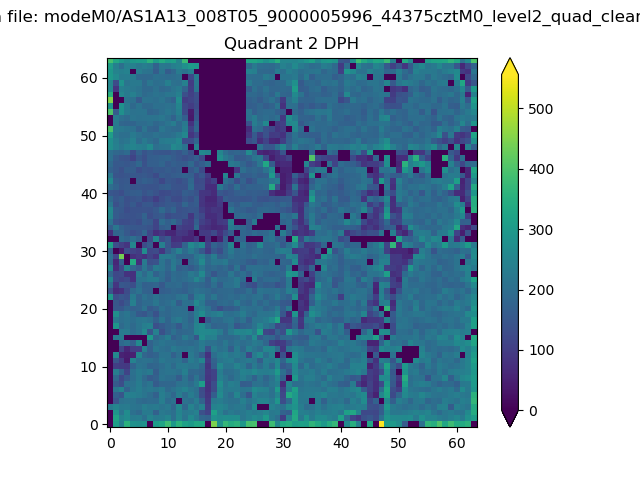
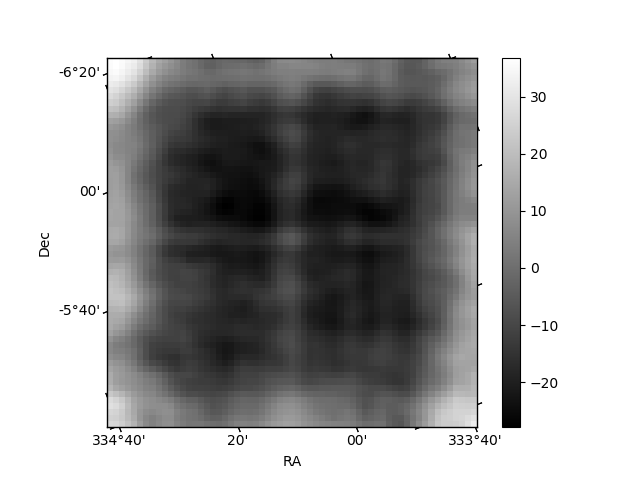
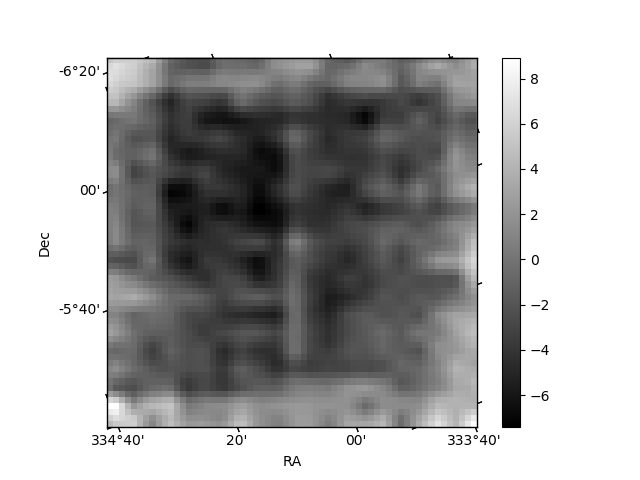
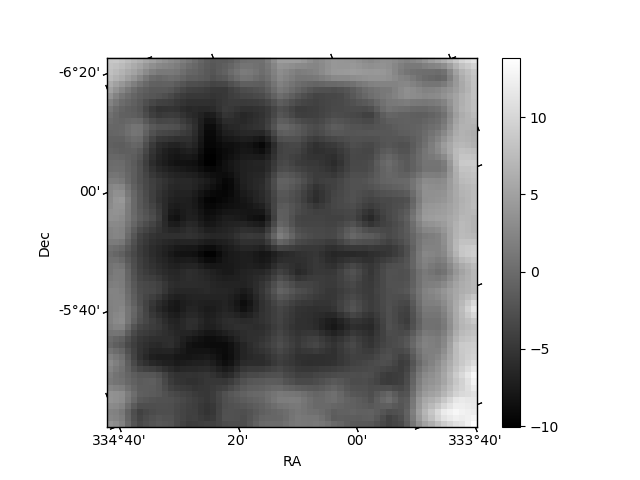
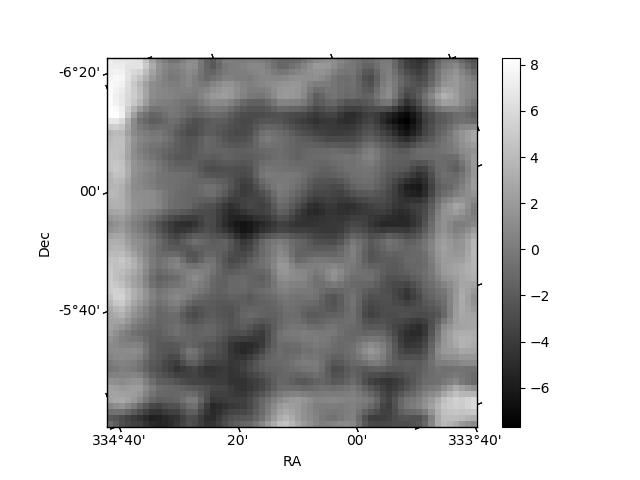
Histogram calculated using DETX and DETY for each event in the final _common_clean file
| Quadrant A | 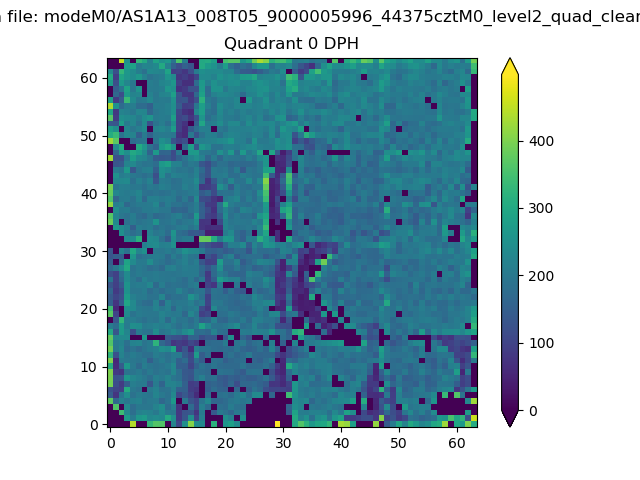 |
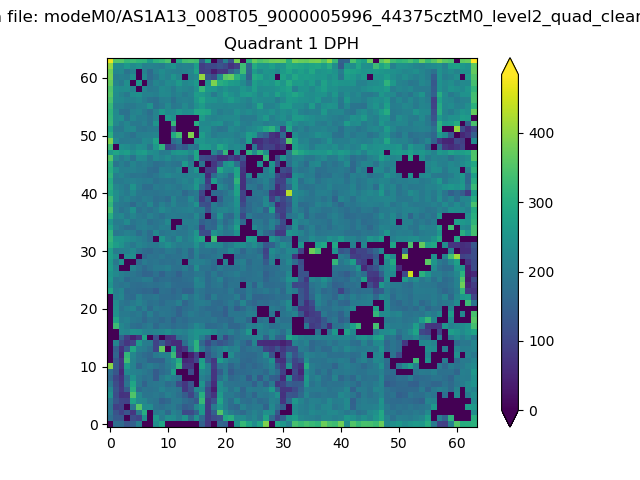 |
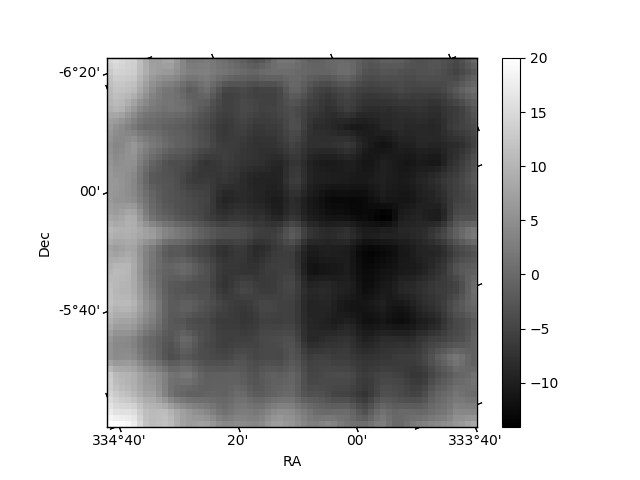
Quadrant B |
|---|---|---|---|
| Quadrant D | 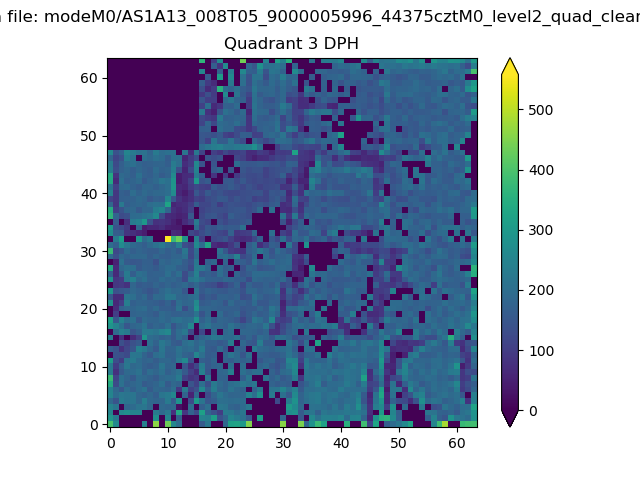 |
 |
Quadrant C |
| Plot type | Count rate plots | Images |
|---|---|---|
| Comparison with Poisson distribution Blue bars denote a histogram of data divided into 1 sec bins. Red curve is a Poisson curve with rate = median count rate of data. |
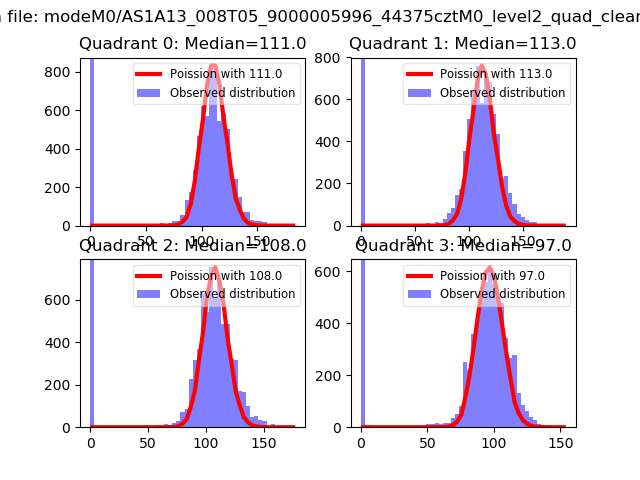 |
 |
| Quadrant-wise count rates Data is divided into 100 sec bins |
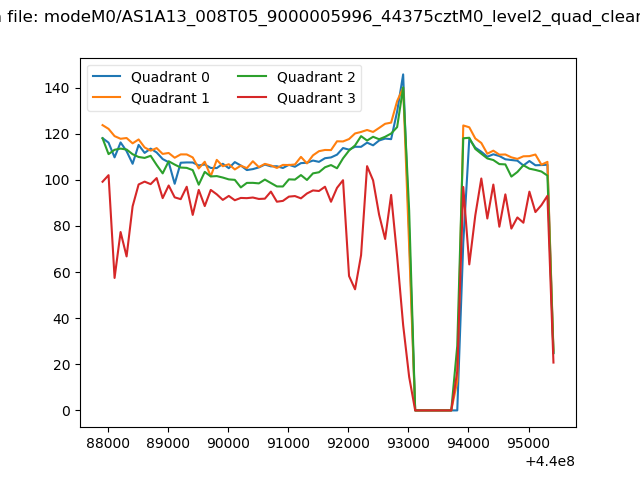 |
|
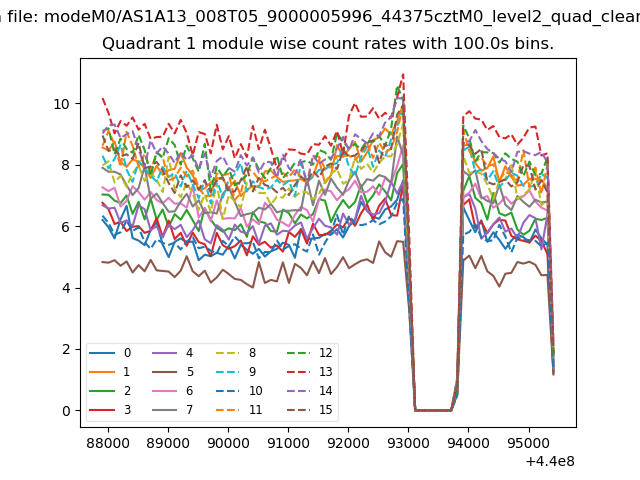
| Module-wise count rates for Quadrant A Data is divided into 100 sec bins |
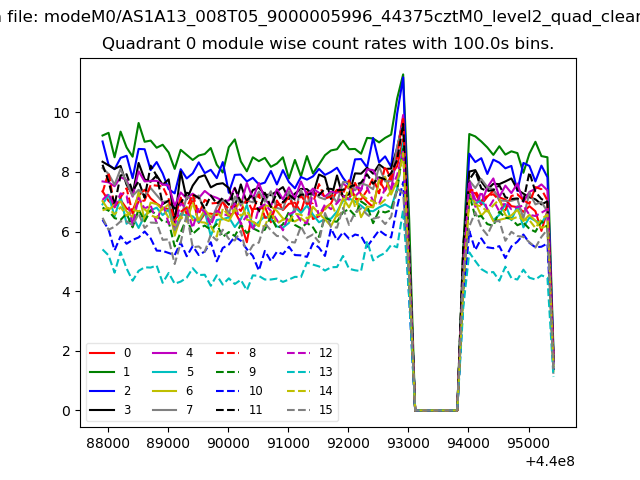 |
 |
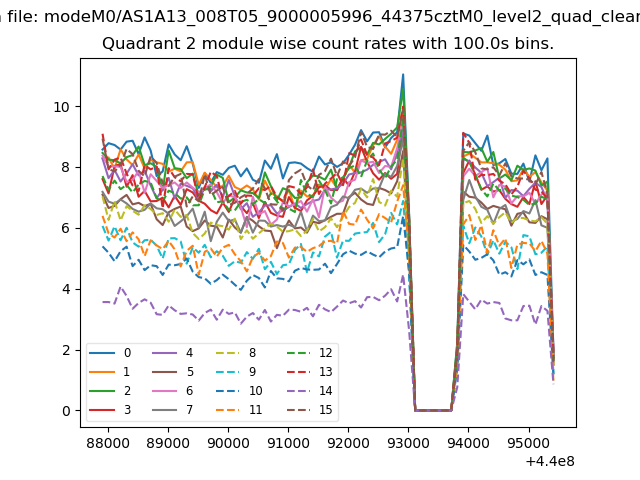
| Module-wise count rates for Quadrant B Data is divided into 100 sec bins |
 |
 |
| Module-wise count rates for Quadrant C Data is divided into 100 sec bins |
 |
 |
| Module-wise count rates for Quadrant D Data is divided into 100 sec bins |
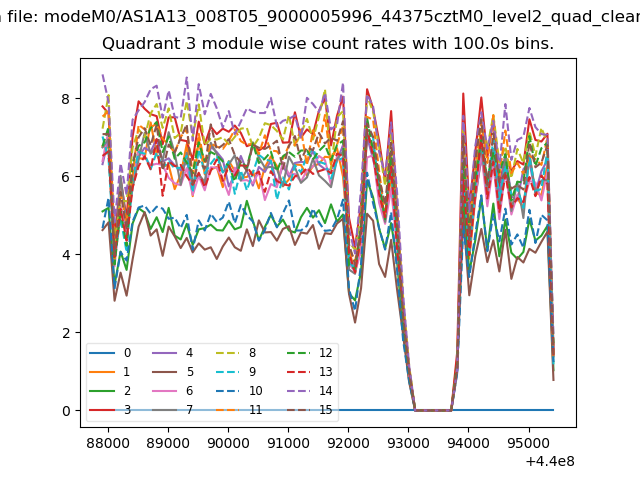 |
 |
| Parameter | Plot |
|---|---|
| CZT HV Monitor | 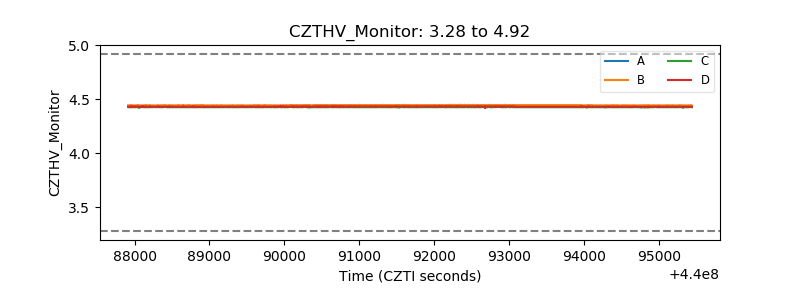 |
| D_VDD | 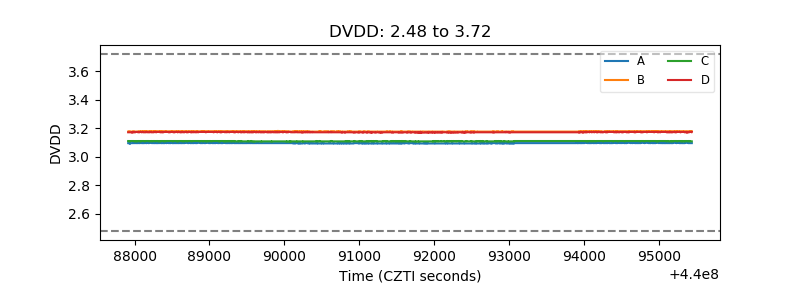 |
| Temperature 1 | 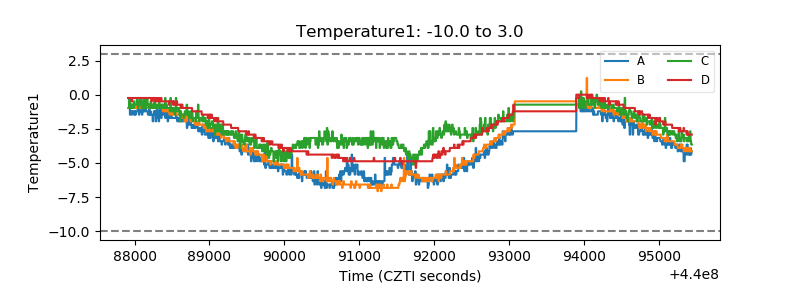 |
| Veto HV Monitor | 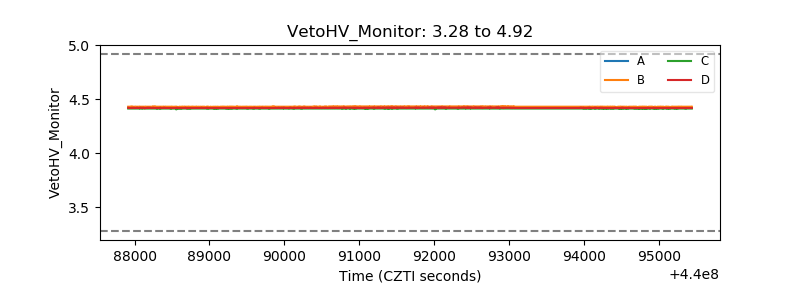 |
| Veto LLD |  |
| Alpha Counter | 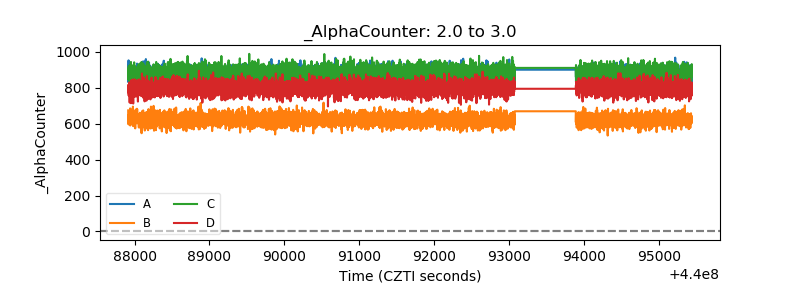 |
| _CPM_Rate | 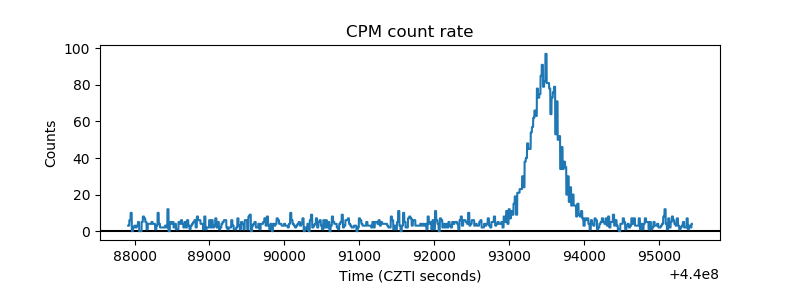 |
| CZT Counter | 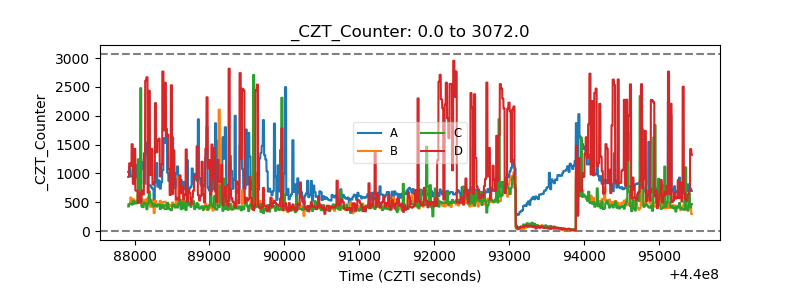 |
| +2.5 Volts monitor | 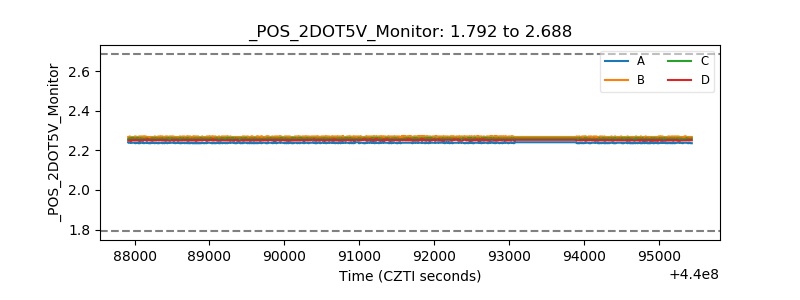 |
| +5 Volts monitor | 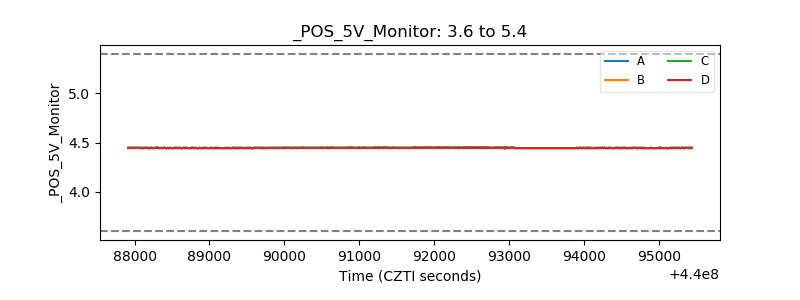 |
| _ROLL_ROT | 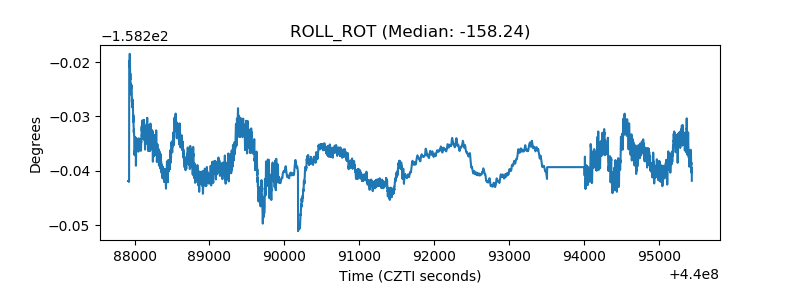 |
| _Roll_DEC | 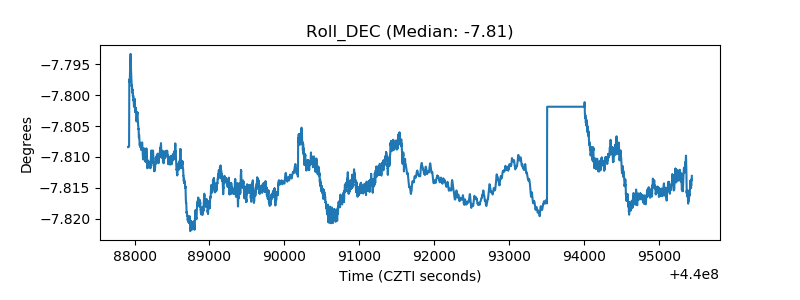 |
| _Roll_RA | 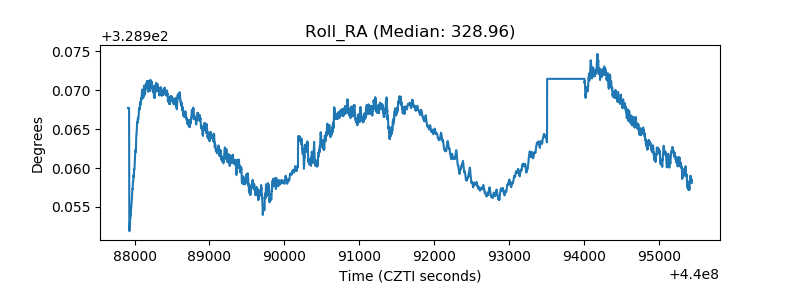 |
| Veto Counter | 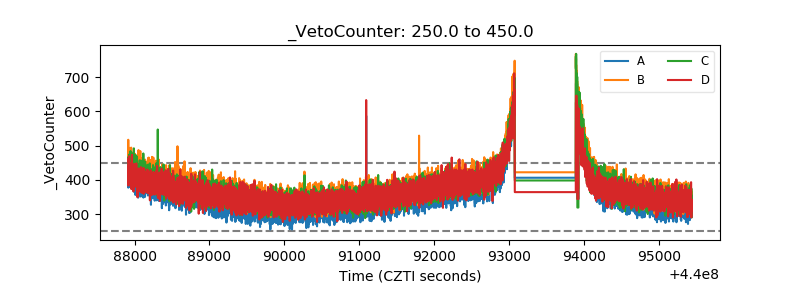 |