| Param | Original file | Final file |
|---|---|---|
| Filename | modeM0/AS1A13_008T05_9000005996_44376cztM0_level2.fits | modeM0/AS1A13_008T05_9000005996_44376cztM0_level2_quad_clean.evt |
| Size (bytes) | 574,879,680 | 116,608,320 |
| Size | 548.2 MB | 111.2 MB |
| Events in quadrant A | 6,023,305 | 781,961 |
| Events in quadrant B | 3,615,717 | 813,951 |
| Events in quadrant C | 3,809,968 | 774,632 |
| Events in quadrant D | 7,261,983 | 649,108 |
| Mode SS | |||
|---|---|---|---|
| Quadrant | BADHDUFLAG | Total packets | Discarded packets |
| A | 0 | 150 | 0 |
| B | 0 | 150 | 0 |
| C | 0 | 150 | 0 |
| D | 0 | 150 | 0 |
| Mode M0 | |||
|---|---|---|---|
| Quadrant | BADHDUFLAG | Total packets | Discarded packets |
| A | 0 | 23733 | 1 |
| B | 0 | 15725 | 1 |
| C | 0 | 16509 | 1 |
| D | 0 | 26573 | 1 |
| Mode M9 | |||
|---|---|---|---|
| Quadrant | BADHDUFLAG | Total packets | Discarded packets |
| A | 0 | 4 | 0 |
| B | 0 | 4 | 0 |
| C | 0 | 4 | 0 |
| D | 0 | 4 | 0 |
| Quadrant | Total seconds | Saturated seconds | Saturation percentage |
|---|---|---|---|
| A | 7343 | 291 | 3.962958% |
| B | 7343 | 67 | 0.912434% |
| C | 7343 | 93 | 1.266512% |
| D | 7343 | 833 | 11.344137% |
Noise dominated data is calculated using 1-second bins in cleaned event files. If a bin has >2000 counts, and if more than 50% of those come from <1% of pixels, then it is considered to be noise-dominated and hence unusable.
| Quadrant | # 1 sec bins | Bins with >0 counts | Bins with >2000 counts | High rate bins dominated by noise | Noise dominated (total time) | Noise dominated (detector-on time) | Marked lightcurve |
|---|---|---|---|---|---|---|---|
| A | 7713 | 7344 | 174 | 174 | 2.26% | 2.37% | 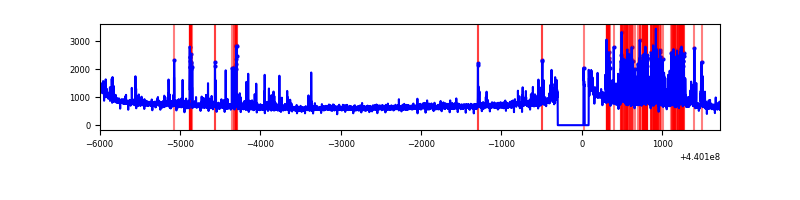 |
| B | 7713 | 7344 | 14 | 14 | 0.18% | 0.19% | 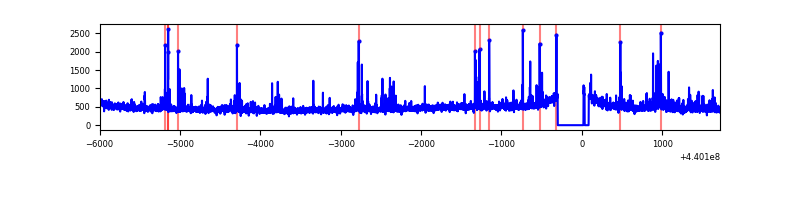 |
| C | 7712 | 7344 | 64 | 64 | 0.83% | 0.87% | 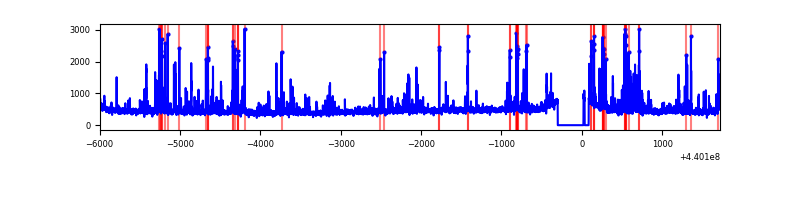 |
| D | 7713 | 7344 | 836 | 836 | 10.84% | 11.38% | 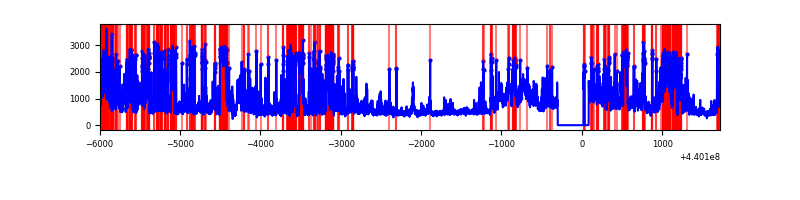 |
Top three noisy pixels from each quadrant. If the there are fewer than three noisy pixels in the level2.evt file, extra rows are filled as -1
| Pixel properties | Quadrant properties | ||||||
|---|---|---|---|---|---|---|---|
| Quadrant | DetID | PixID | Counts | Sigma | Mean | Median | Sigma |
| A | 10 | 83 | 1900302 | 11027.97 | 825 | 807 | 172.2 |
| A | 15 | 223 | 728629 | 4225.54 | 825 | 807 | 172.2 |
| A | 0 | 243 | 49543 | 282.95 | 825 | 807 | 172.2 |
| B | 5 | 172 | 53203 | 320.96 | 833 | 807 | 163.2 |
| B | 0 | 190 | 41972 | 252.16 | 833 | 807 | 163.2 |
| B | 0 | 183 | 39211 | 235.25 | 833 | 807 | 163.2 |
| C | 14 | 254 | 362567 | 1889.06 | 807 | 812 | 191.5 |
| C | 1 | 3 | 102416 | 530.57 | 807 | 812 | 191.5 |
| C | 2 | 14 | 54723 | 281.52 | 807 | 812 | 191.5 |
| D | 1 | 52 | 998536 | 5014.26 | 778 | 753 | 199.0 |
| D | 8 | 240 | 857159 | 4303.79 | 778 | 753 | 199.0 |
| D | 13 | 249 | 621910 | 3121.57 | 778 | 753 | 199.0 |
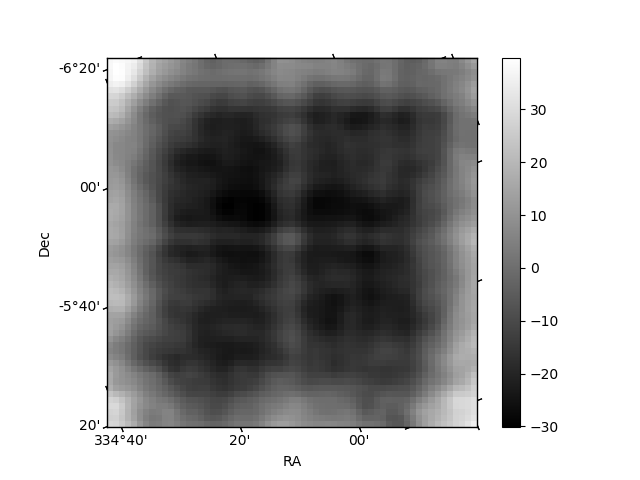
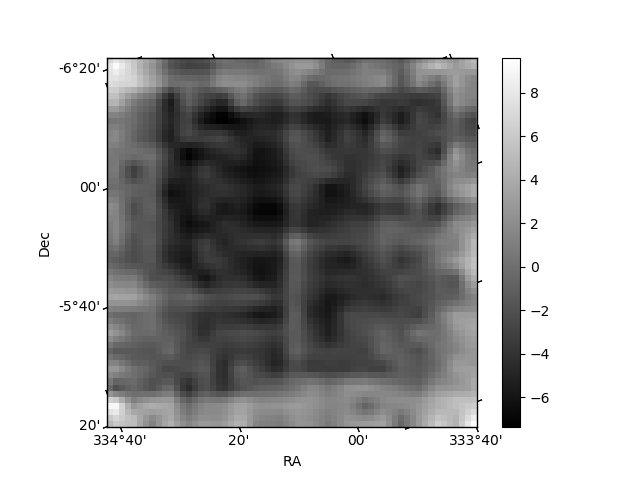
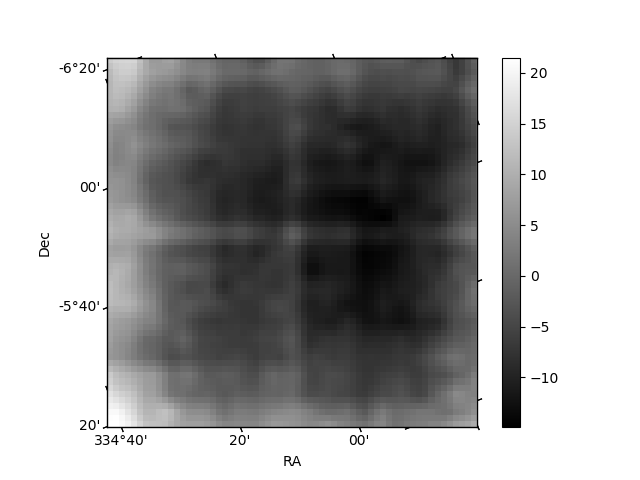
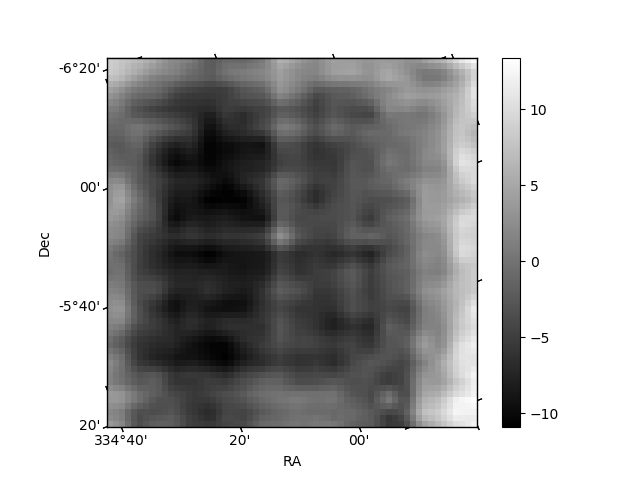
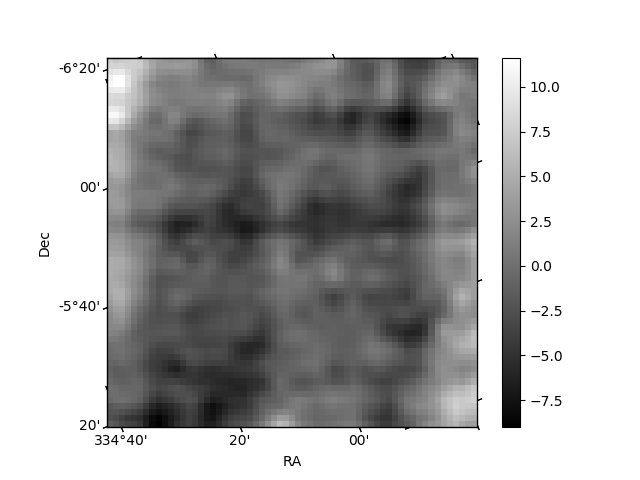
Histogram calculated using DETX and DETY for each event in the final _common_clean file
| Quadrant A | 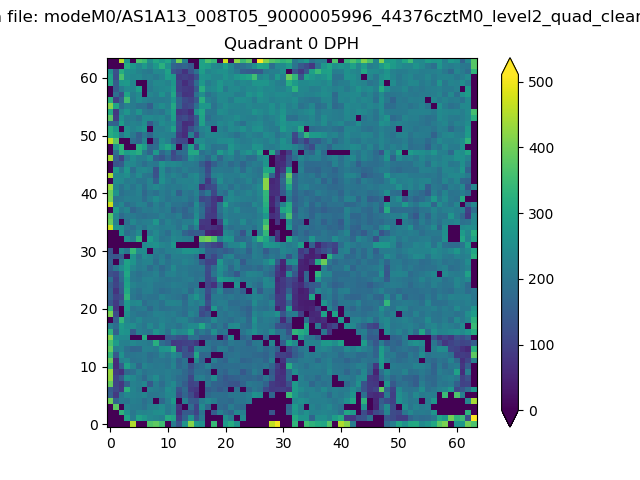 |
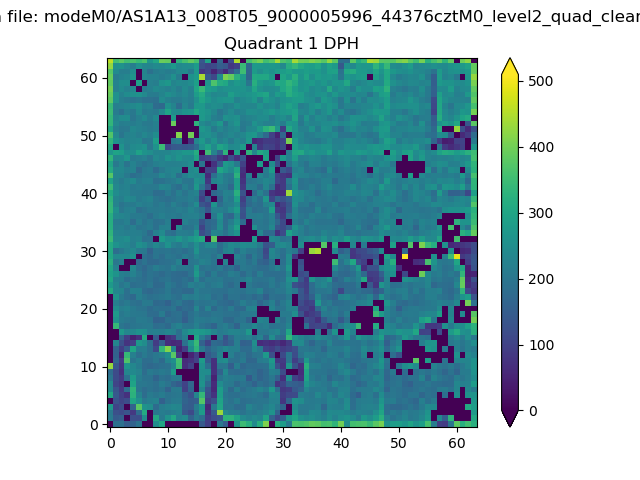 |
Quadrant B |
|---|---|---|---|
| Quadrant D | 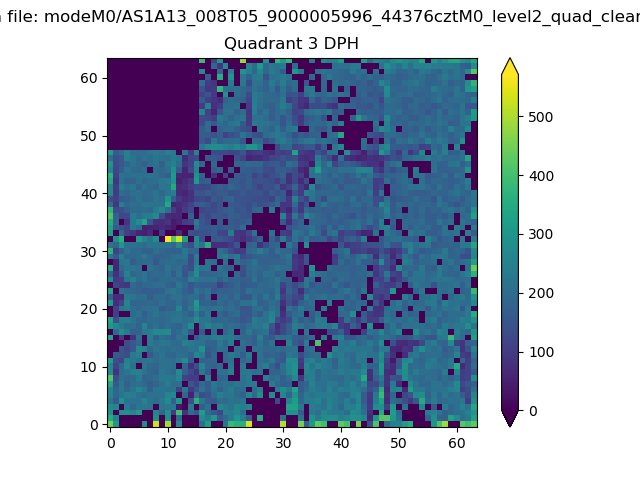 |
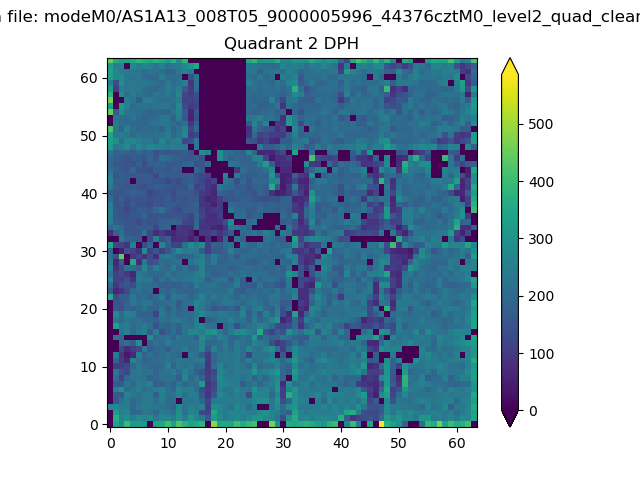 |
Quadrant C |
| Plot type | Count rate plots | Images |
|---|---|---|
| Comparison with Poisson distribution Blue bars denote a histogram of data divided into 1 sec bins. Red curve is a Poisson curve with rate = median count rate of data. |
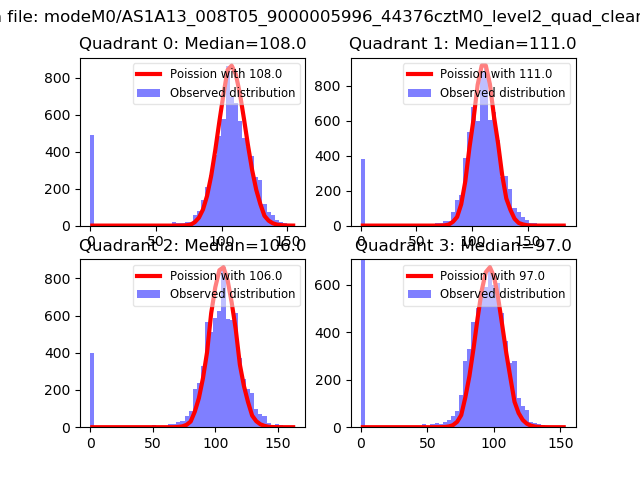 |
 |
| Quadrant-wise count rates Data is divided into 100 sec bins |
 |
|
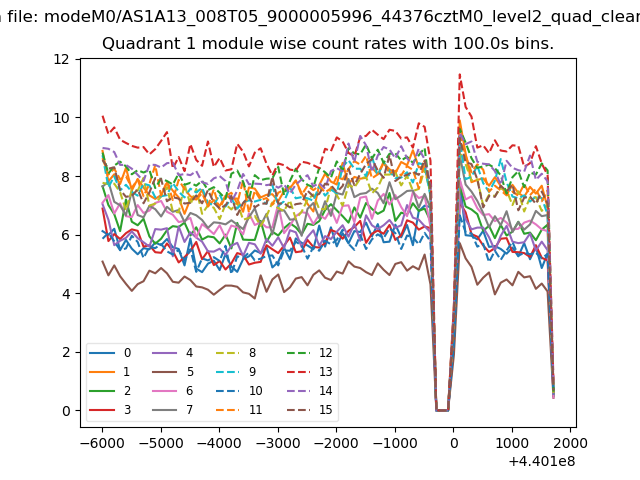
| Module-wise count rates for Quadrant A Data is divided into 100 sec bins |
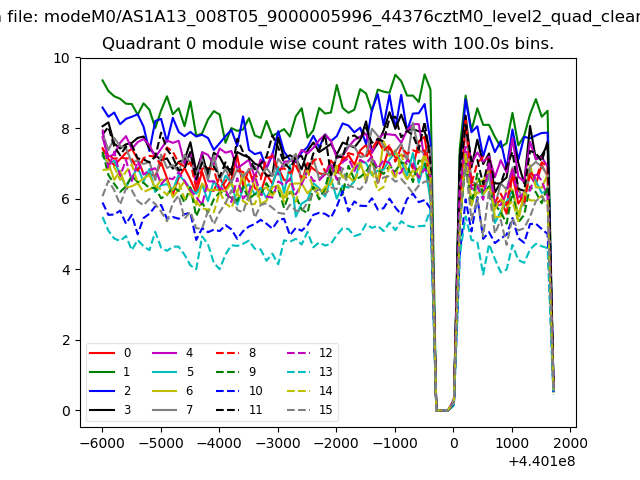 |
 |
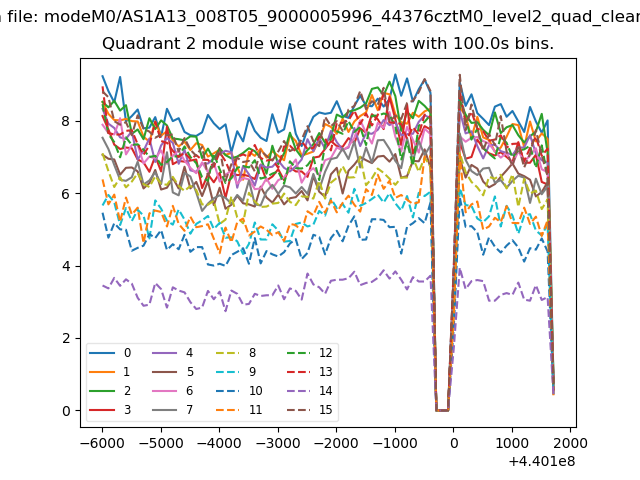
| Module-wise count rates for Quadrant B Data is divided into 100 sec bins |
 |
 |
| Module-wise count rates for Quadrant C Data is divided into 100 sec bins |
 |
 |
| Module-wise count rates for Quadrant D Data is divided into 100 sec bins |
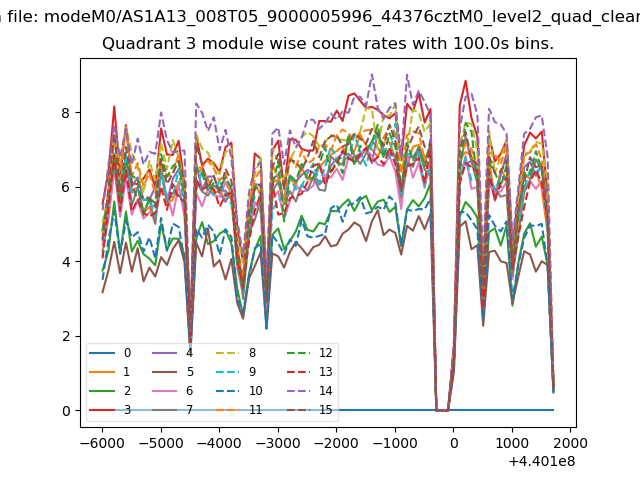 |
 |
| Parameter | Plot |
|---|---|
| CZT HV Monitor | 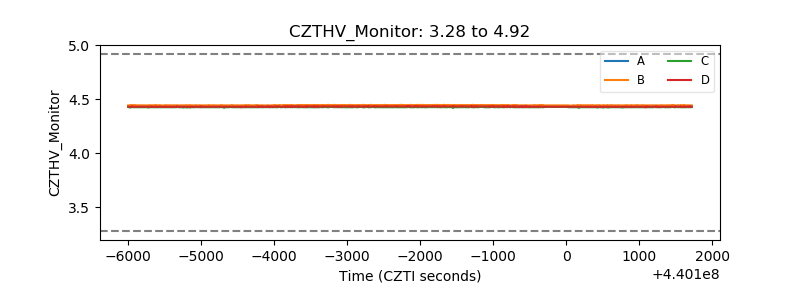 |
| D_VDD | 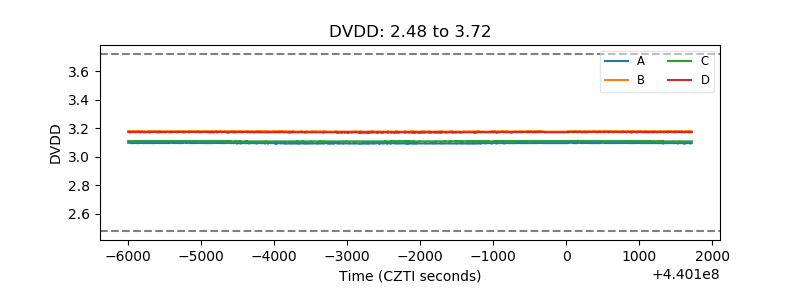 |
| Temperature 1 |  |
| Veto HV Monitor | 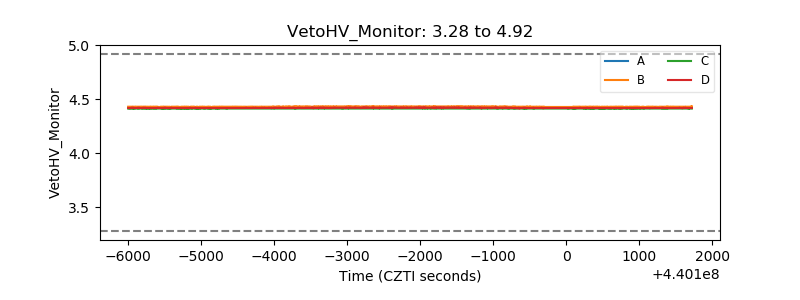 |
| Veto LLD | 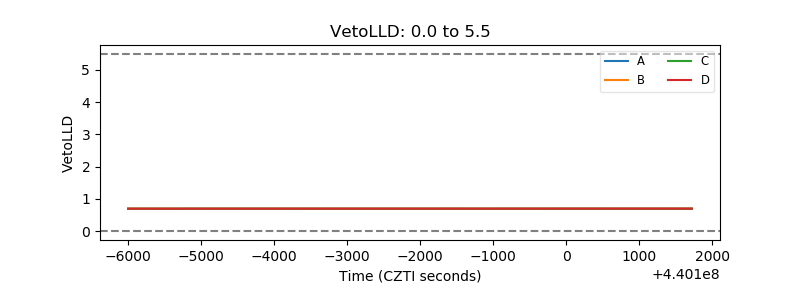 |
| Alpha Counter | 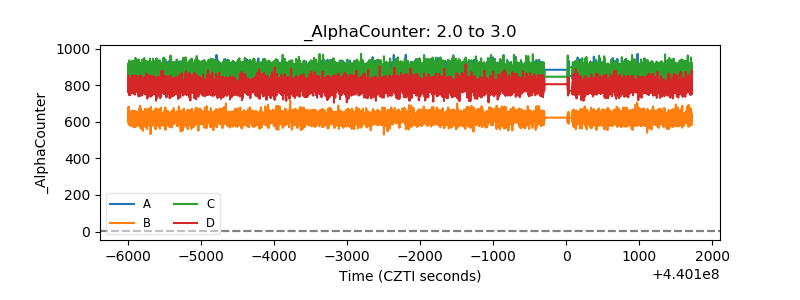 |
| _CPM_Rate | 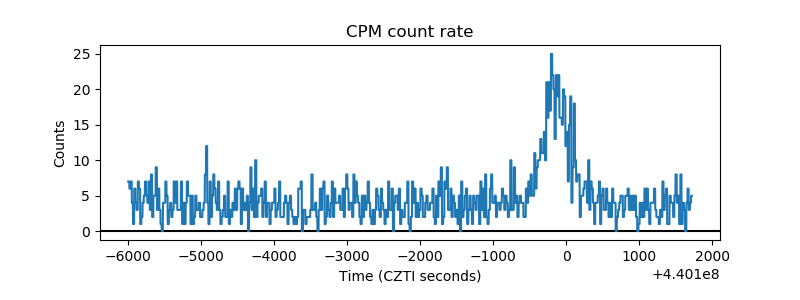 |
| CZT Counter | 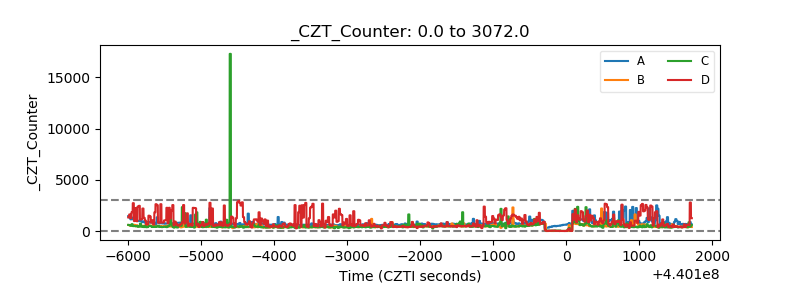 |
| +2.5 Volts monitor | 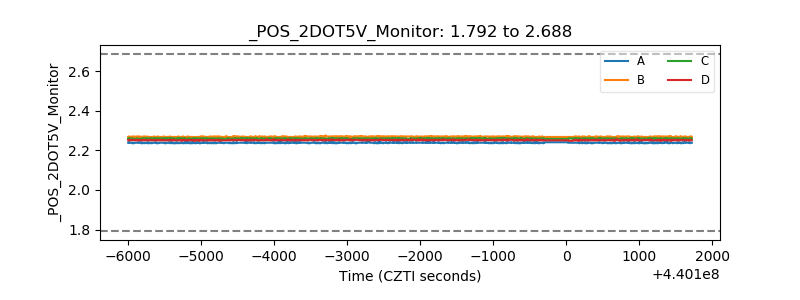 |
| +5 Volts monitor | 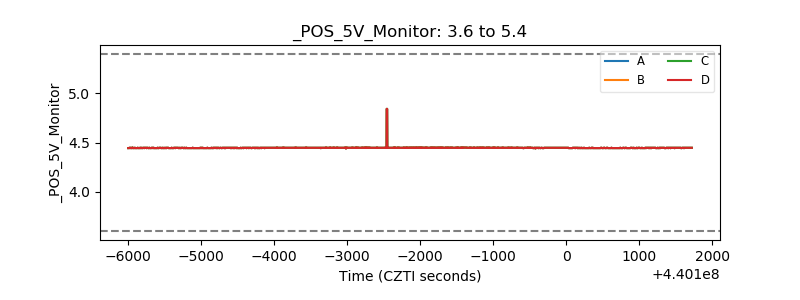 |
| _ROLL_ROT | 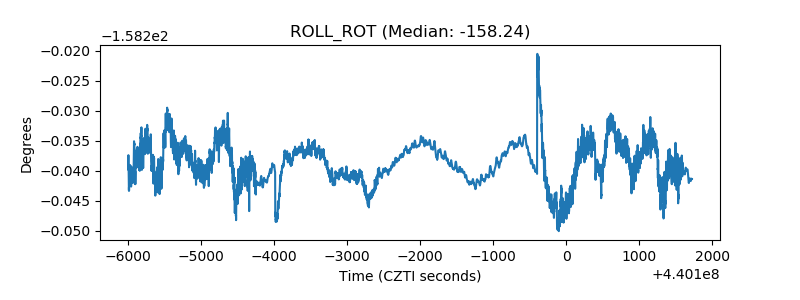 |
| _Roll_DEC | 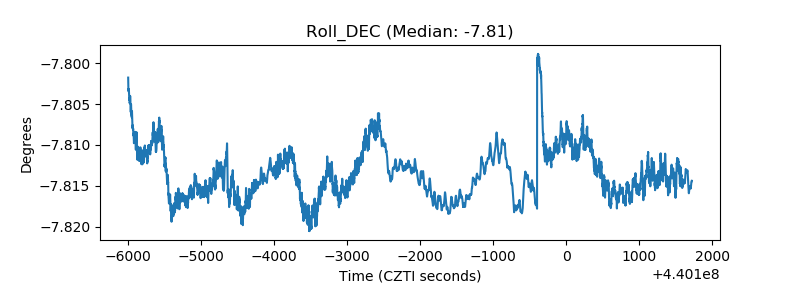 |
| _Roll_RA | 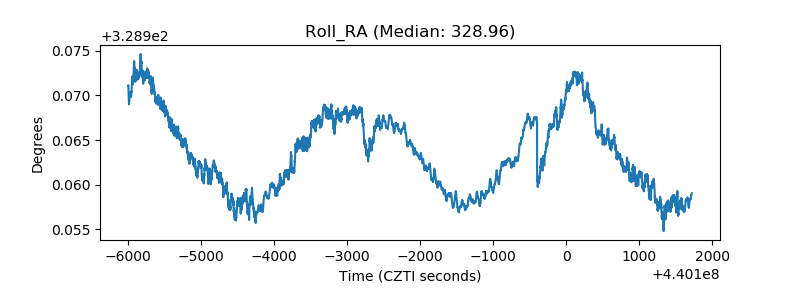 |
| Veto Counter | 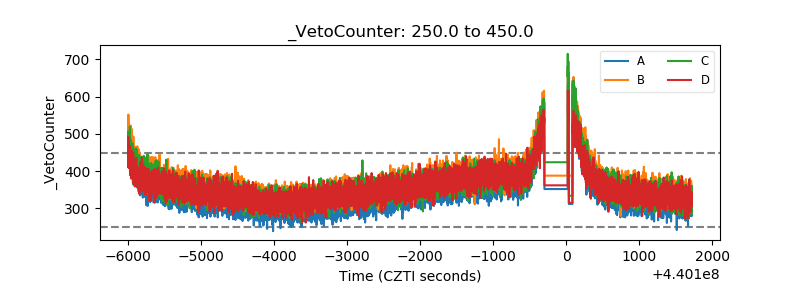 |