| Param | Original file | Final file |
|---|---|---|
| Filename | modeM0/AS1A13_008T05_9000005996_44377cztM0_level2.fits | modeM0/AS1A13_008T05_9000005996_44377cztM0_level2_quad_clean.evt |
| Size (bytes) | 645,451,200 | 119,972,160 |
| Size | 615.6 MB | 114.4 MB |
| Events in quadrant A | 6,077,830 | 813,565 |
| Events in quadrant B | 4,352,329 | 837,712 |
| Events in quadrant C | 4,035,360 | 805,638 |
| Events in quadrant D | 8,832,747 | 641,814 |
| Mode SS | |||
|---|---|---|---|
| Quadrant | BADHDUFLAG | Total packets | Discarded packets |
| A | 0 | 156 | 0 |
| B | 0 | 155 | 0 |
| C | 0 | 157 | 1 |
| D | 0 | 156 | 0 |
| Mode M0 | |||
|---|---|---|---|
| Quadrant | BADHDUFLAG | Total packets | Discarded packets |
| A | 0 | 24566 | 234 |
| B | 0 | 18317 | 221 |
| C | 0 | 17589 | 161 |
| D | 0 | 31986 | 463 |
| Mode M9 | |||
|---|---|---|---|
| Quadrant | BADHDUFLAG | Total packets | Discarded packets |
| A | 0 | 1 | 0 |
| B | 0 | 2 | 1 |
| C | 0 | 1 | 0 |
| D | 0 | 1 | 0 |
| Quadrant | Total seconds | Saturated seconds | Saturation percentage |
|---|---|---|---|
| A | 7671 | 296 | 3.858689% |
| B | 7671 | 199 | 2.594186% |
| C | 7670 | 84 | 1.095176% |
| D | 7668 | 1273 | 16.601461% |
Noise dominated data is calculated using 1-second bins in cleaned event files. If a bin has >2000 counts, and if more than 50% of those come from <1% of pixels, then it is considered to be noise-dominated and hence unusable.
| Quadrant | # 1 sec bins | Bins with >0 counts | Bins with >2000 counts | High rate bins dominated by noise | Noise dominated (total time) | Noise dominated (detector-on time) | Marked lightcurve |
|---|---|---|---|---|---|---|---|
| A | 7892 | 7689 | 151 | 151 | 1.91% | 1.96% | 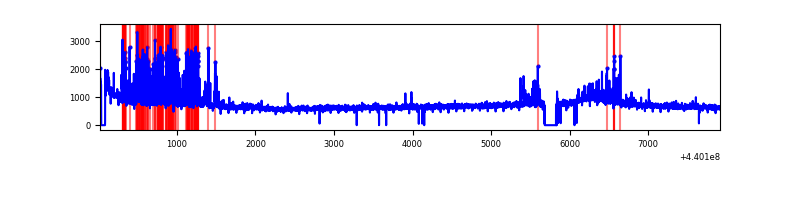 |
| B | 7892 | 7693 | 98 | 98 | 1.24% | 1.27% | 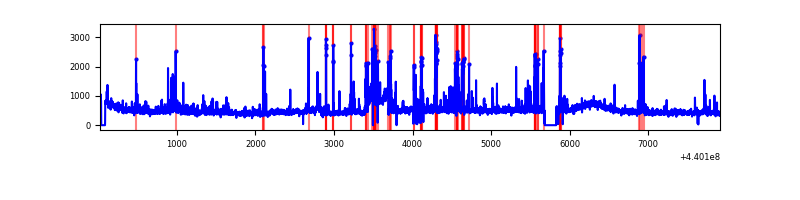 |
| C | 7892 | 7693 | 58 | 58 | 0.73% | 0.75% | 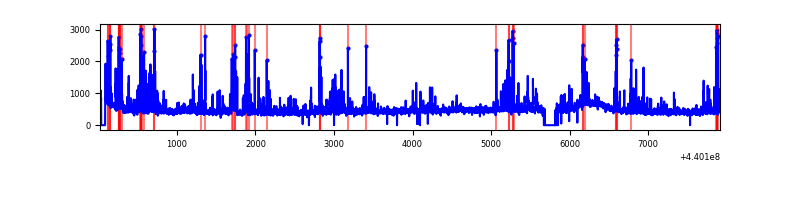 |
| D | 7891 | 7684 | 1350 | 1350 | 17.11% | 17.57% | 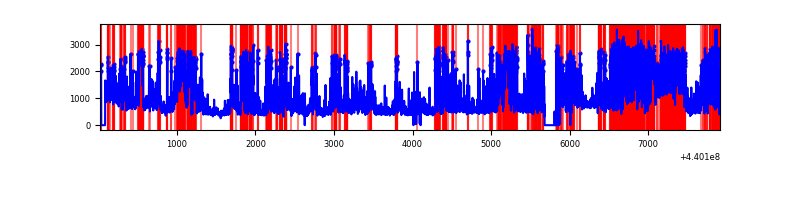 |
Top three noisy pixels from each quadrant. If the there are fewer than three noisy pixels in the level2.evt file, extra rows are filled as -1
| Pixel properties | Quadrant properties | ||||||
|---|---|---|---|---|---|---|---|
| Quadrant | DetID | PixID | Counts | Sigma | Mean | Median | Sigma |
| A | 10 | 83 | 1887899 | 10368.91 | 871 | 850 | 182.0 |
| A | 15 | 223 | 700926 | 3846.76 | 871 | 850 | 182.0 |
| A | 13 | 248 | 51599 | 278.85 | 871 | 850 | 182.0 |
| B | 5 | 32 | 299563 | 1731.31 | 871 | 846 | 172.5 |
| B | 5 | 255 | 142625 | 821.72 | 871 | 846 | 172.5 |
| B | 0 | 183 | 117264 | 674.74 | 871 | 846 | 172.5 |
| C | 14 | 254 | 389236 | 1920.5 | 851 | 858 | 202.2 |
| C | 2 | 14 | 157056 | 772.39 | 851 | 858 | 202.2 |
| C | 1 | 3 | 111132 | 545.3 | 851 | 858 | 202.2 |
| D | 13 | 249 | 1704251 | 8332.88 | 802 | 777 | 204.4 |
| D | 1 | 52 | 1025816 | 5014.18 | 802 | 777 | 204.4 |
| D | 4 | 221 | 695105 | 3396.44 | 802 | 777 | 204.4 |
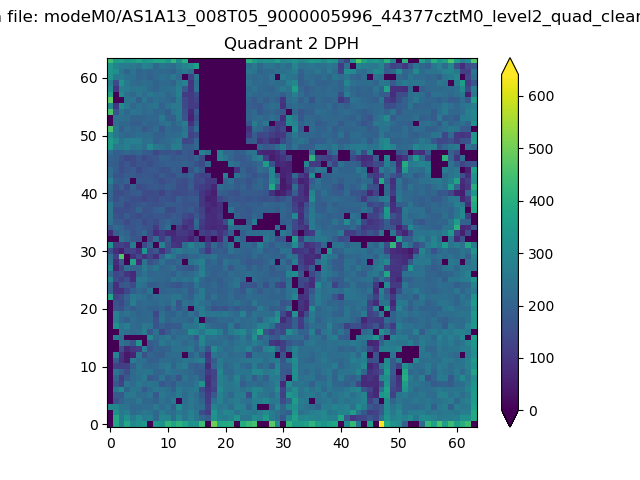
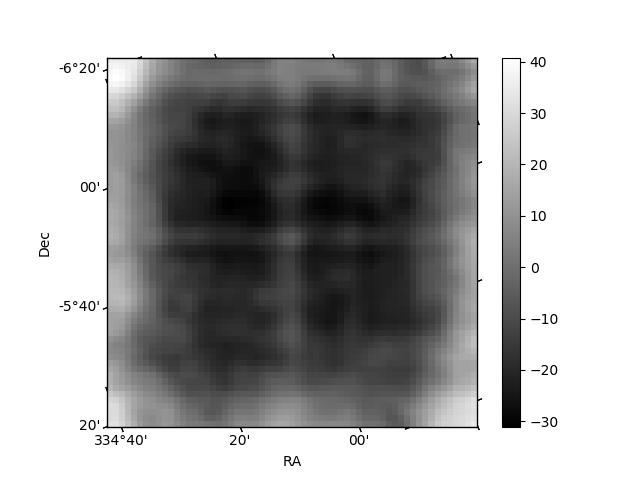
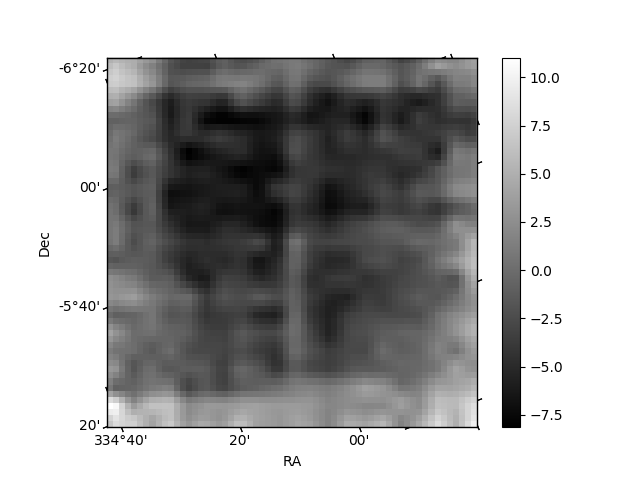
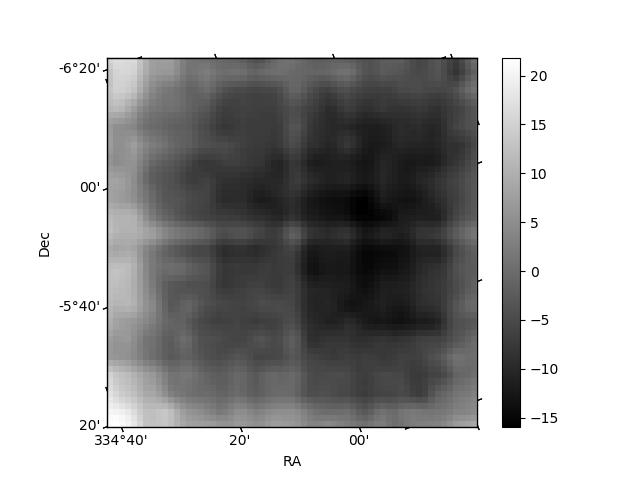
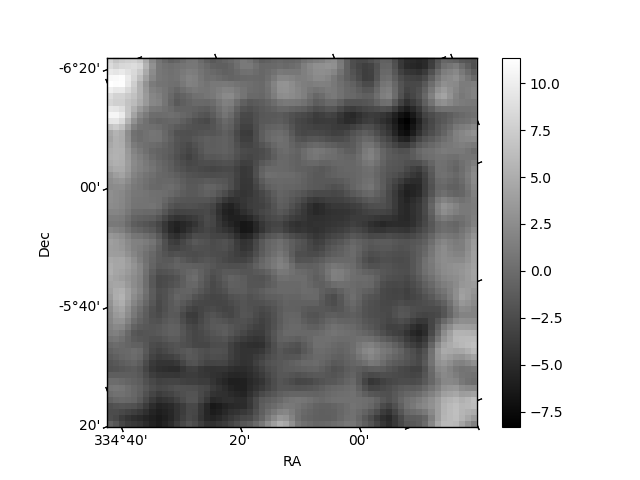
Histogram calculated using DETX and DETY for each event in the final _common_clean file
| Quadrant A | 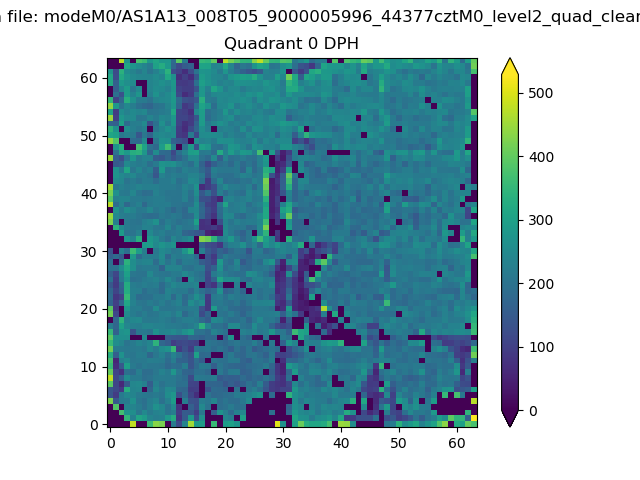 |
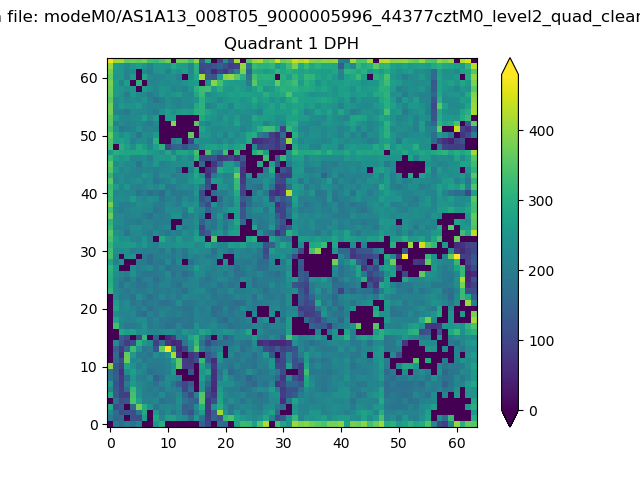 |
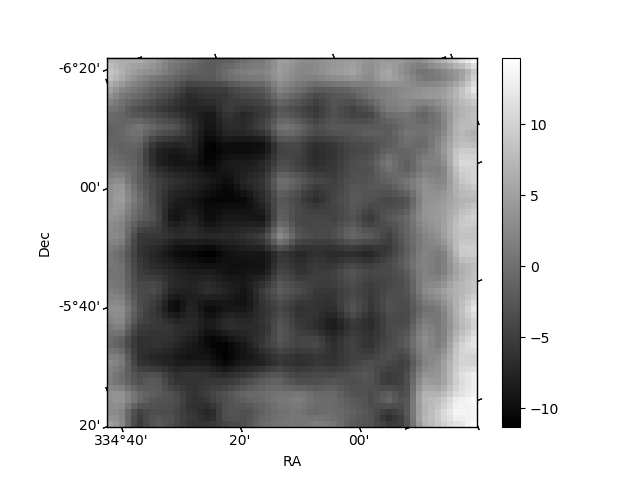
Quadrant B |
|---|---|---|---|
| Quadrant D | 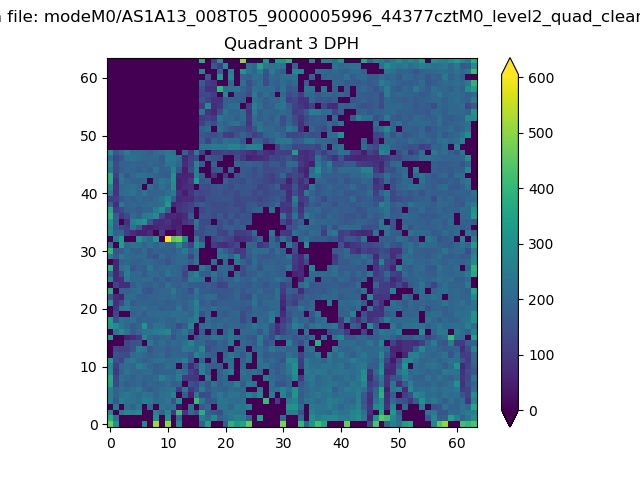 |
 |
Quadrant C |
| Plot type | Count rate plots | Images |
|---|---|---|
| Comparison with Poisson distribution Blue bars denote a histogram of data divided into 1 sec bins. Red curve is a Poisson curve with rate = median count rate of data. |
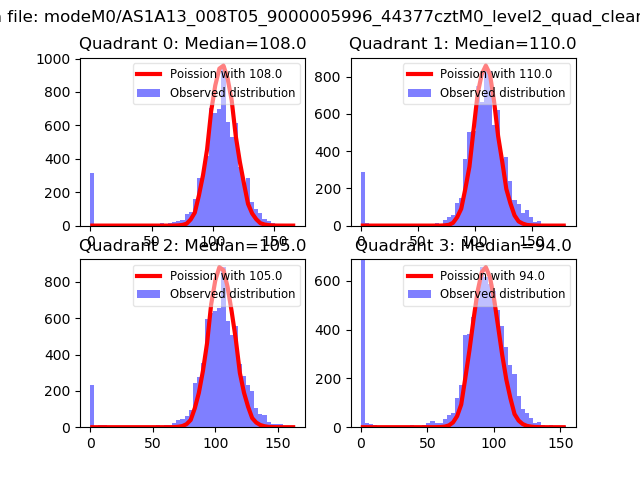 |
 |
| Quadrant-wise count rates Data is divided into 100 sec bins |
 |
|
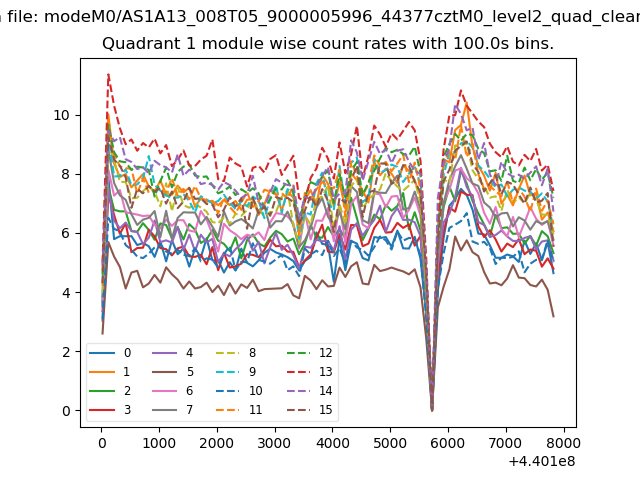
| Module-wise count rates for Quadrant A Data is divided into 100 sec bins |
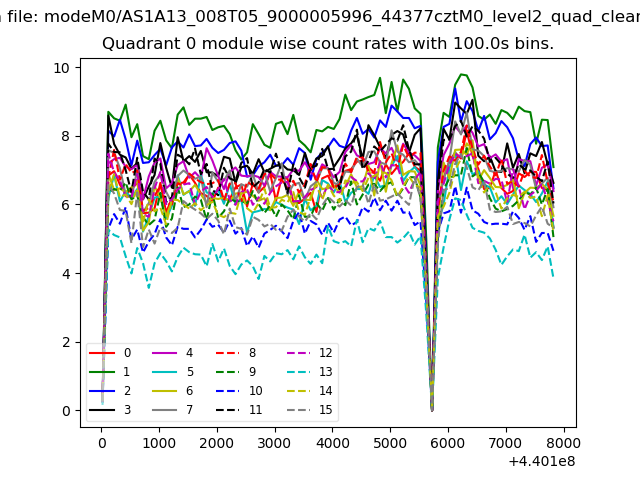 |
 |
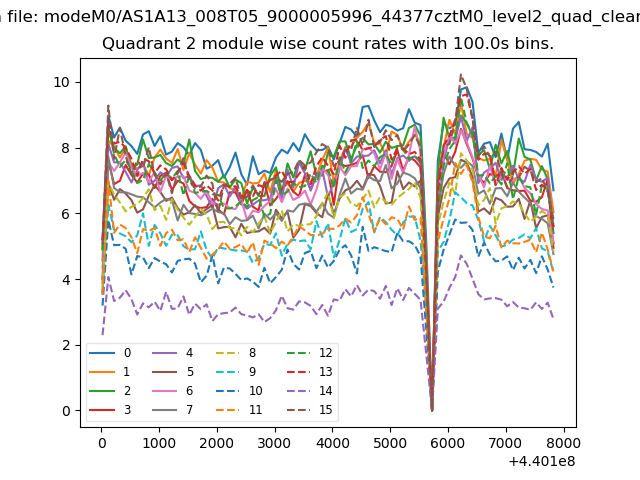
| Module-wise count rates for Quadrant B Data is divided into 100 sec bins |
 |
 |
| Module-wise count rates for Quadrant C Data is divided into 100 sec bins |
 |
 |
| Module-wise count rates for Quadrant D Data is divided into 100 sec bins |
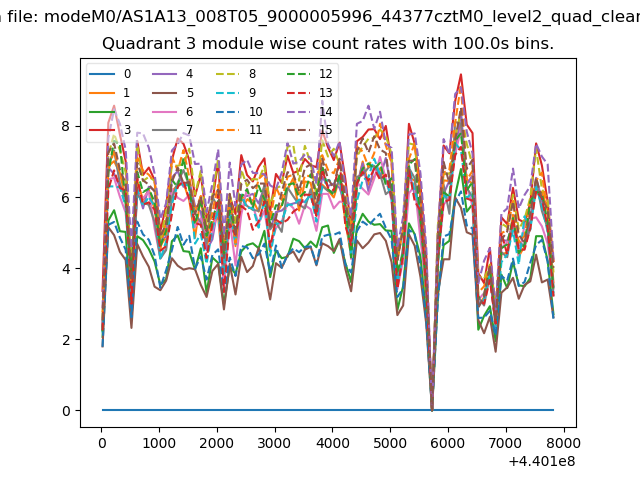 |
 |
| Parameter | Plot |
|---|---|
| CZT HV Monitor | 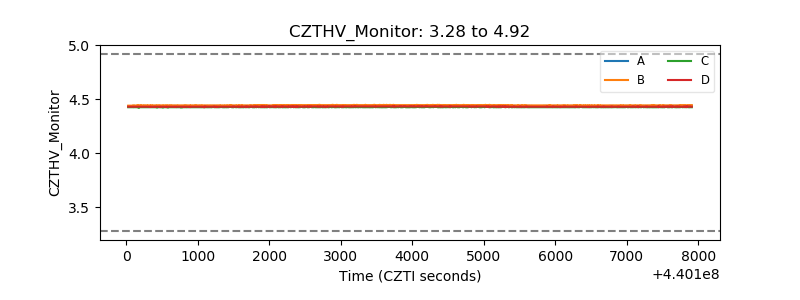 |
| D_VDD | 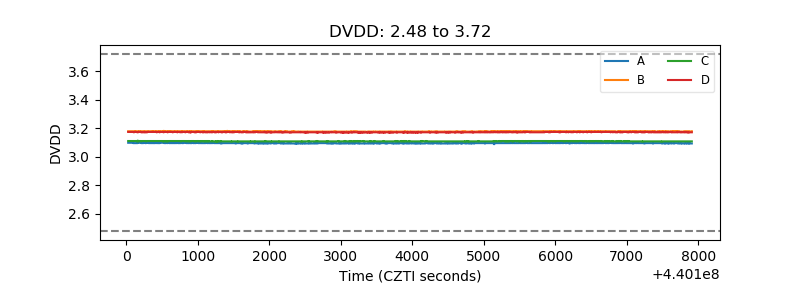 |
| Temperature 1 | 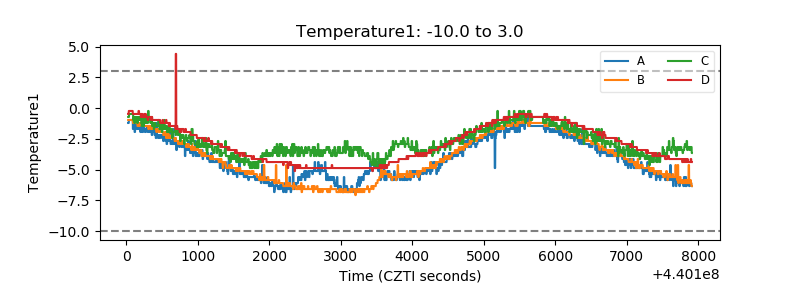 |
| Veto HV Monitor | 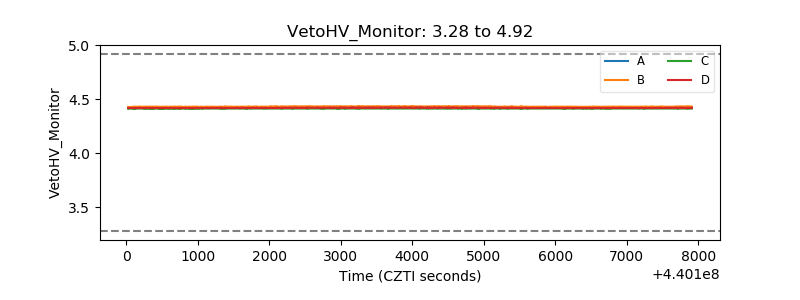 |
| Veto LLD | 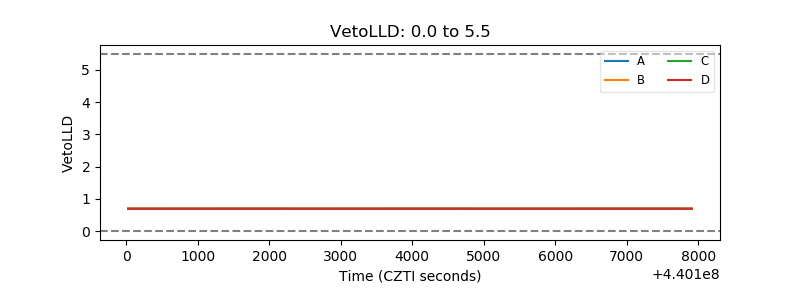 |
| Alpha Counter | 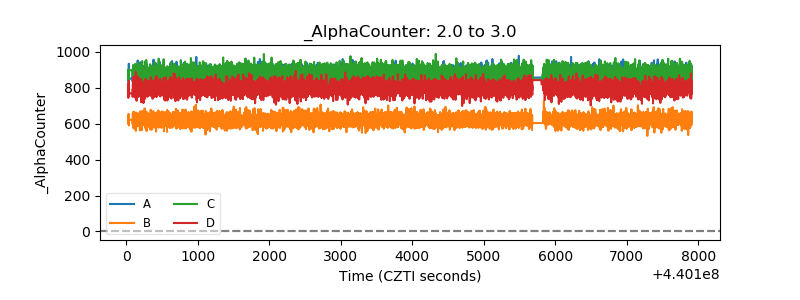 |
| _CPM_Rate | 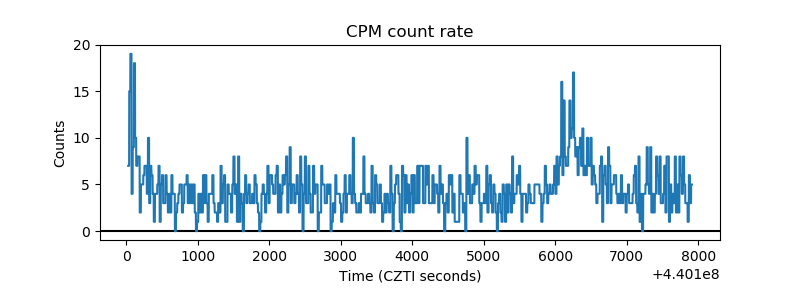 |
| CZT Counter | 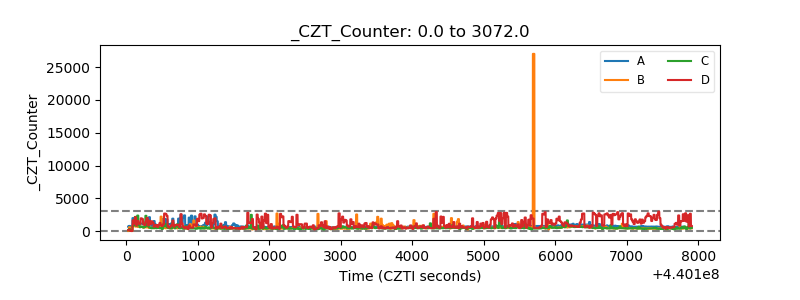 |
| +2.5 Volts monitor | 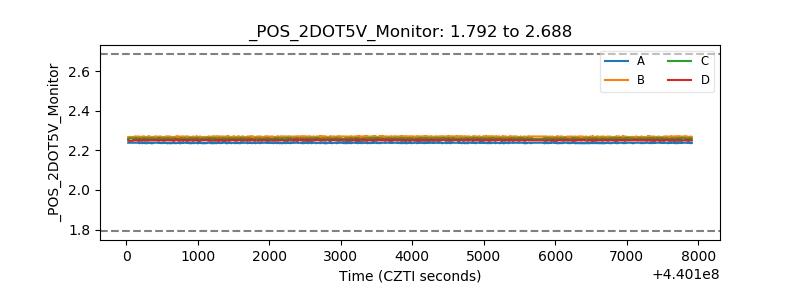 |
| +5 Volts monitor |  |
| _ROLL_ROT | 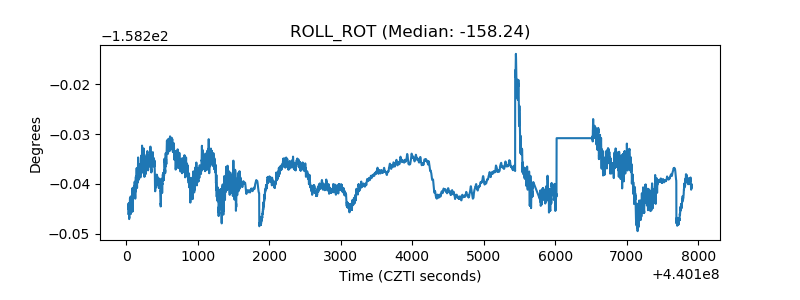 |
| _Roll_DEC | 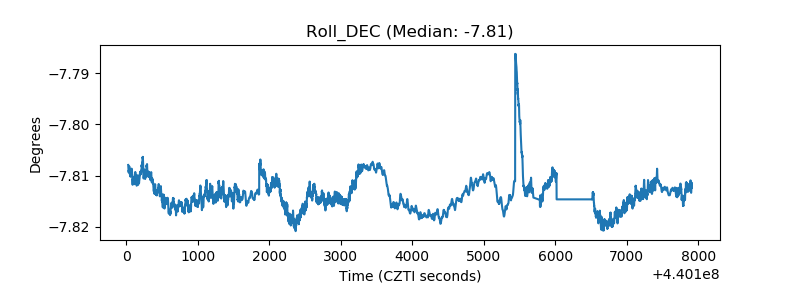 |
| _Roll_RA | 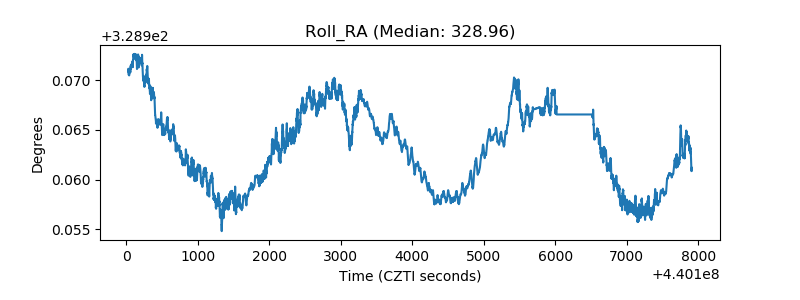 |
| Veto Counter | 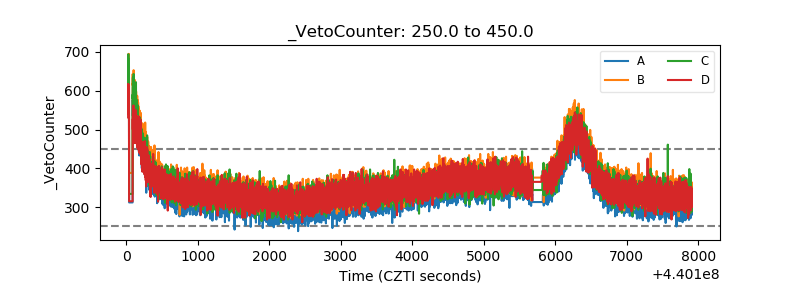 |