| Param | Original file | Final file |
|---|---|---|
| Filename | modeM0/AS1A13_008T05_9000005996_44378cztM0_level2.fits | modeM0/AS1A13_008T05_9000005996_44378cztM0_level2_quad_clean.evt |
| Size (bytes) | 676,546,560 | 119,050,560 |
| Size | 645.2 MB | 113.5 MB |
| Events in quadrant A | 5,901,328 | 831,444 |
| Events in quadrant B | 3,904,871 | 853,359 |
| Events in quadrant C | 4,921,397 | 752,588 |
| Events in quadrant D | 9,706,360 | 619,780 |
| Mode SS | |||
|---|---|---|---|
| Quadrant | BADHDUFLAG | Total packets | Discarded packets |
| A | 0 | 158 | 0 |
| B | 0 | 158 | 0 |
| C | 0 | 158 | 0 |
| D | 0 | 158 | 0 |
| Mode M0 | |||
|---|---|---|---|
| Quadrant | BADHDUFLAG | Total packets | Discarded packets |
| A | 0 | 24109 | 1 |
| B | 0 | 17047 | 2 |
| C | 0 | 20312 | 1 |
| D | 0 | 34316 | 6 |
| Quadrant | Total seconds | Saturated seconds | Saturation percentage |
|---|---|---|---|
| A | 7867 | 173 | 2.199059% |
| B | 7867 | 114 | 1.449091% |
| C | 7867 | 613 | 7.792043% |
| D | 7865 | 1668 | 21.207883% |
Noise dominated data is calculated using 1-second bins in cleaned event files. If a bin has >2000 counts, and if more than 50% of those come from <1% of pixels, then it is considered to be noise-dominated and hence unusable.
| Quadrant | # 1 sec bins | Bins with >0 counts | Bins with >2000 counts | High rate bins dominated by noise | Noise dominated (total time) | Noise dominated (detector-on time) | Marked lightcurve |
|---|---|---|---|---|---|---|---|
| A | 7892 | 7868 | 69 | 69 | 0.87% | 0.88% | 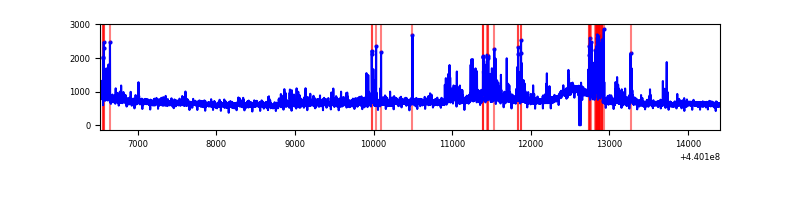 |
| B | 7892 | 7868 | 30 | 30 | 0.38% | 0.38% | 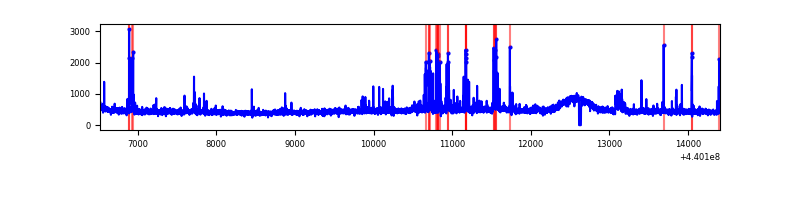 |
| C | 7892 | 7867 | 524 | 524 | 6.64% | 6.66% | 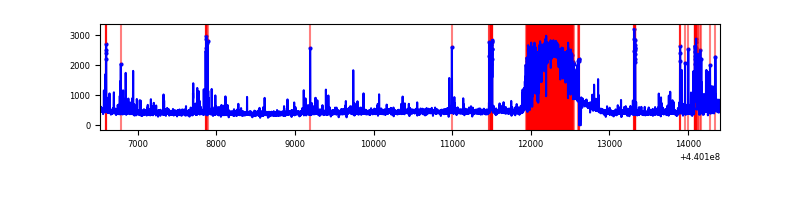 |
| D | 7892 | 7866 | 1678 | 1678 | 21.26% | 21.33% | 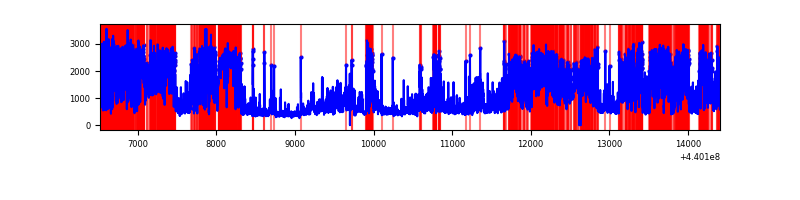 |
Top three noisy pixels from each quadrant. If the there are fewer than three noisy pixels in the level2.evt file, extra rows are filled as -1
| Pixel properties | Quadrant properties | ||||||
|---|---|---|---|---|---|---|---|
| Quadrant | DetID | PixID | Counts | Sigma | Mean | Median | Sigma |
| A | 10 | 83 | 1774074 | 9507.53 | 886 | 867 | 186.5 |
| A | 15 | 223 | 592706 | 3173.3 | 886 | 867 | 186.5 |
| A | 13 | 248 | 44470 | 233.79 | 886 | 867 | 186.5 |
| B | 5 | 172 | 106661 | 598.82 | 889 | 864 | 176.7 |
| B | 0 | 190 | 68338 | 381.91 | 889 | 864 | 176.7 |
| B | 0 | 183 | 41708 | 231.18 | 889 | 864 | 176.7 |
| C | 15 | 158 | 1182844 | 5960.47 | 831 | 835 | 198.3 |
| C | 14 | 254 | 315426 | 1586.38 | 831 | 835 | 198.3 |
| C | 2 | 14 | 127191 | 637.17 | 831 | 835 | 198.3 |
| D | 1 | 52 | 2826228 | 13670.42 | 808 | 782 | 206.7 |
| D | 13 | 249 | 1014832 | 4906.3 | 808 | 782 | 206.7 |
| D | 12 | 2 | 882490 | 4265.99 | 808 | 782 | 206.7 |
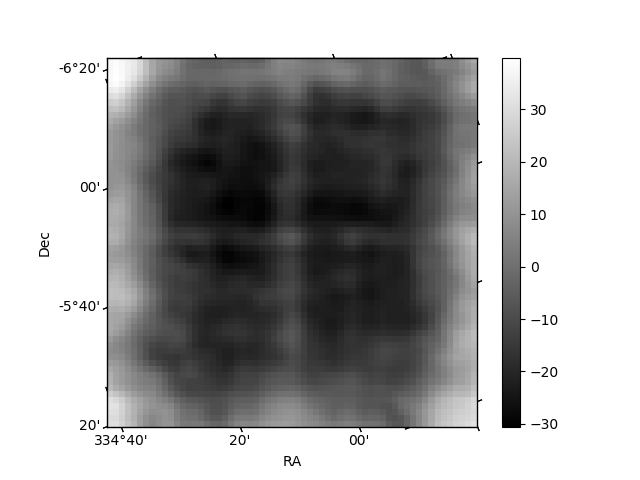
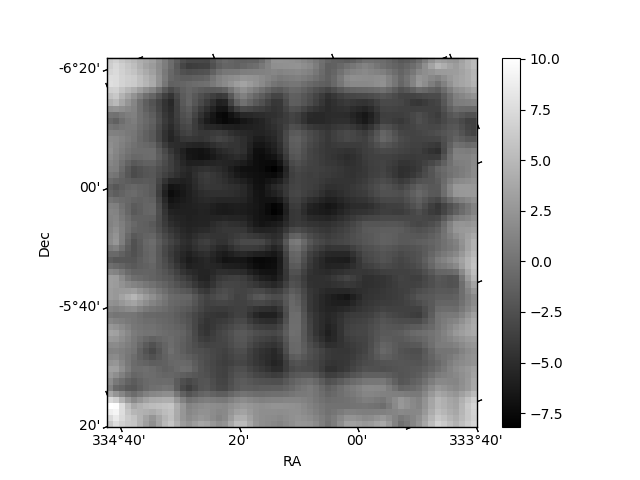
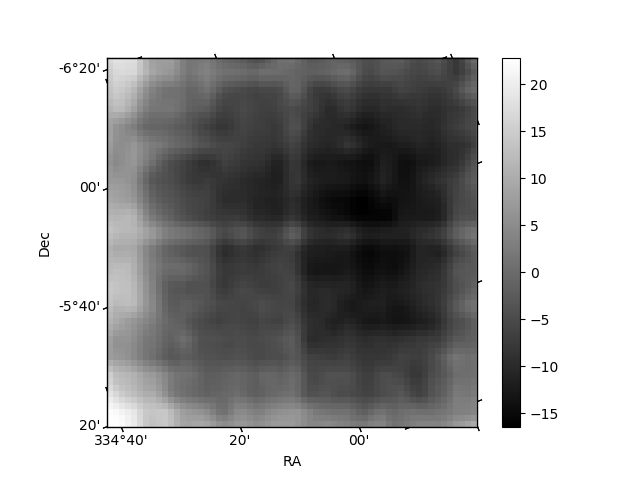
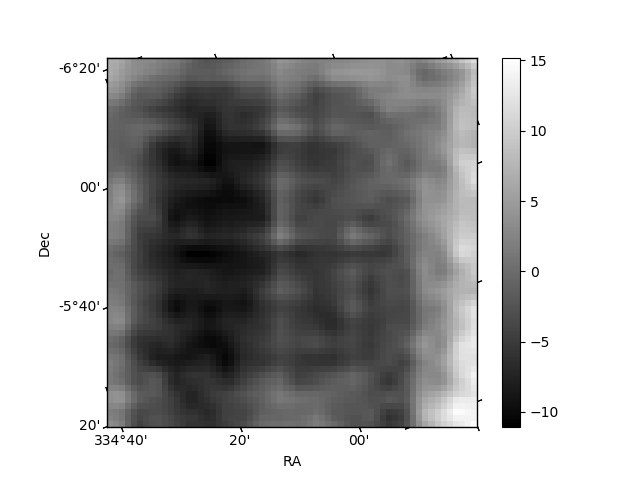
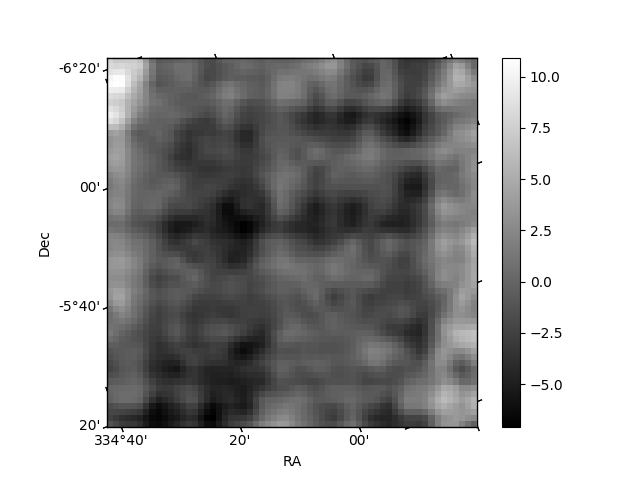
Histogram calculated using DETX and DETY for each event in the final _common_clean file
| Quadrant A | 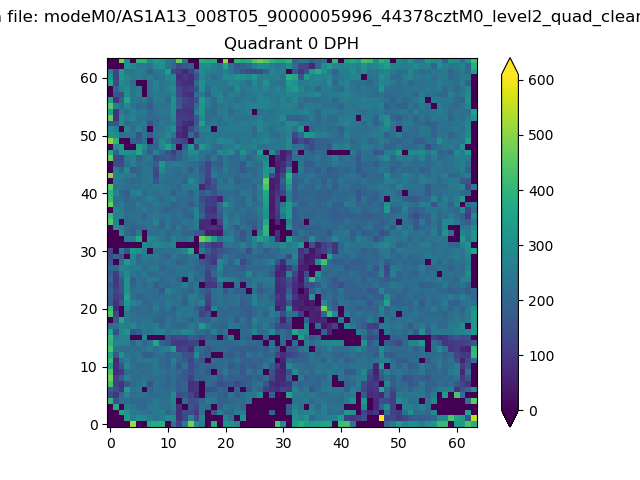 |
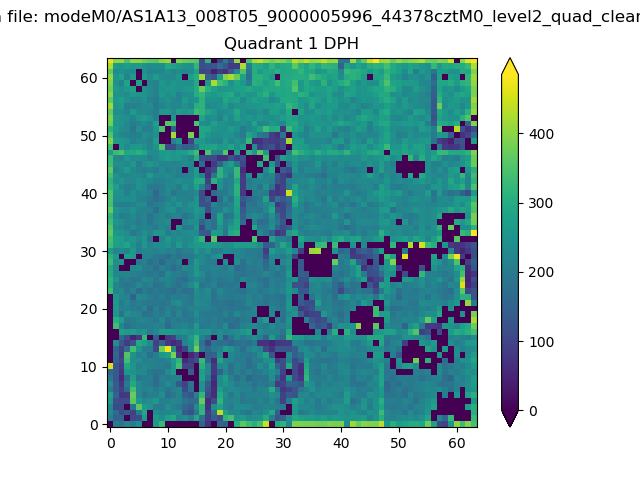 |
Quadrant B |
|---|---|---|---|
| Quadrant D | 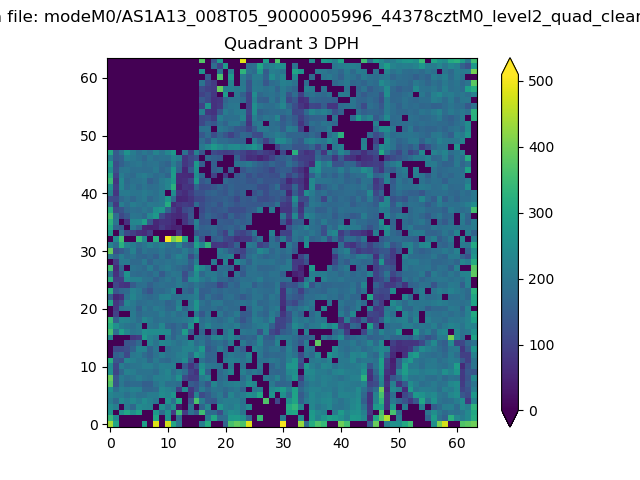 |
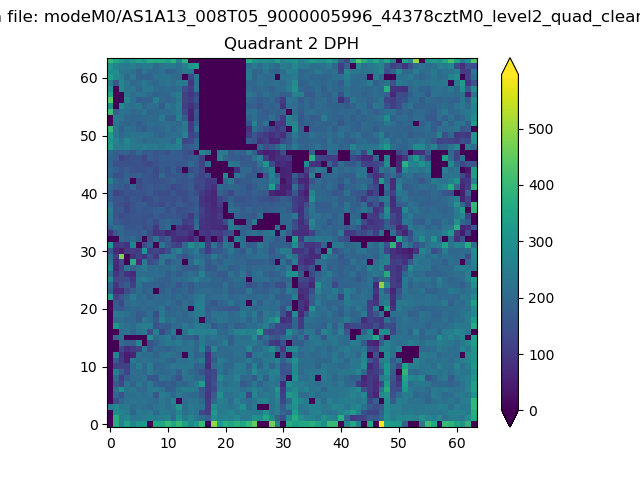 |
Quadrant C |
| Plot type | Count rate plots | Images |
|---|---|---|
| Comparison with Poisson distribution Blue bars denote a histogram of data divided into 1 sec bins. Red curve is a Poisson curve with rate = median count rate of data. |
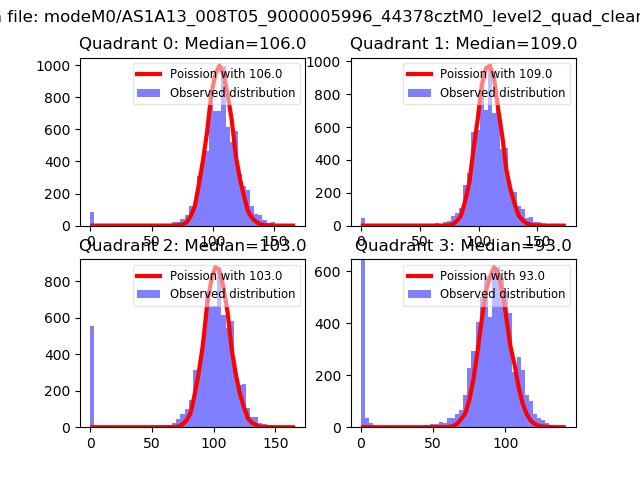 |
 |
| Quadrant-wise count rates Data is divided into 100 sec bins |
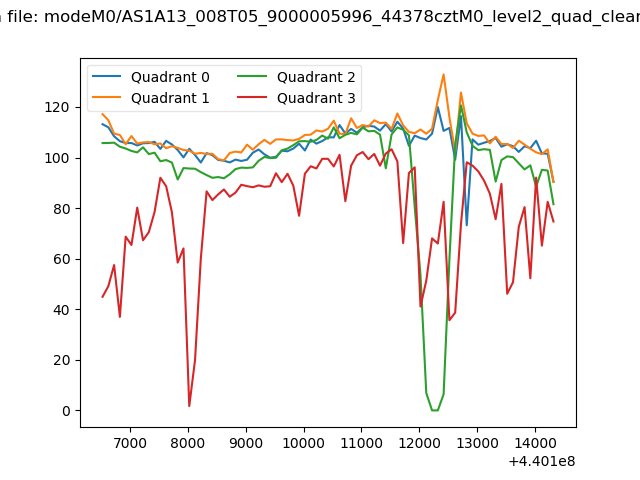 |
|
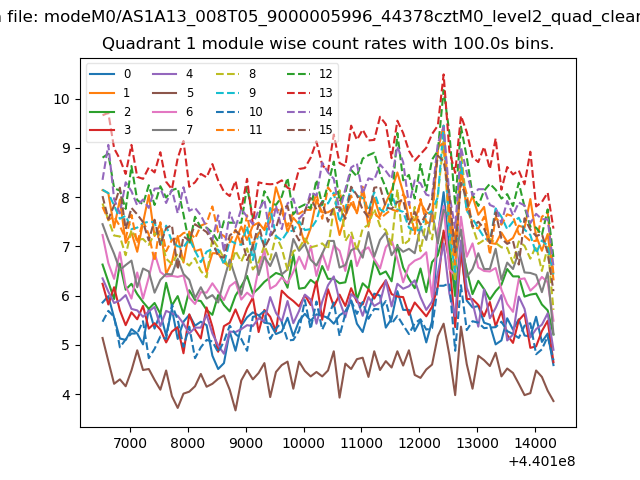
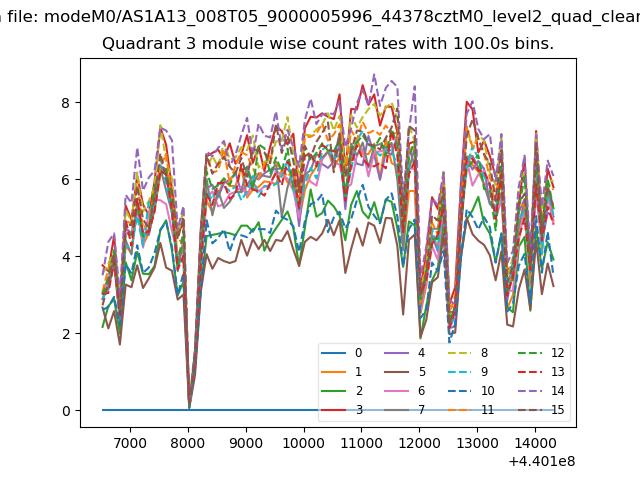
| Module-wise count rates for Quadrant A Data is divided into 100 sec bins |
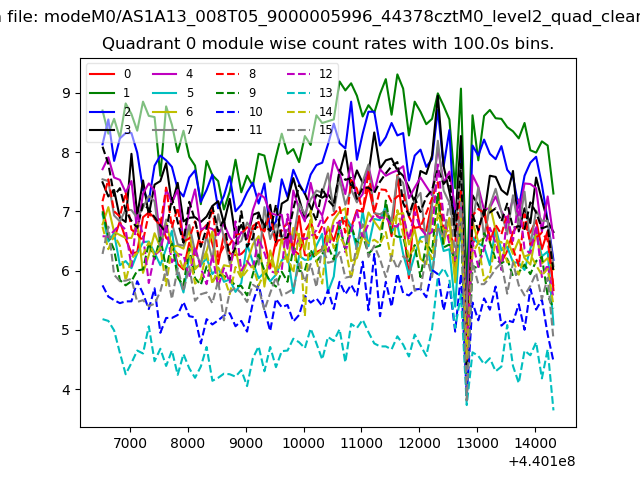 |
 |
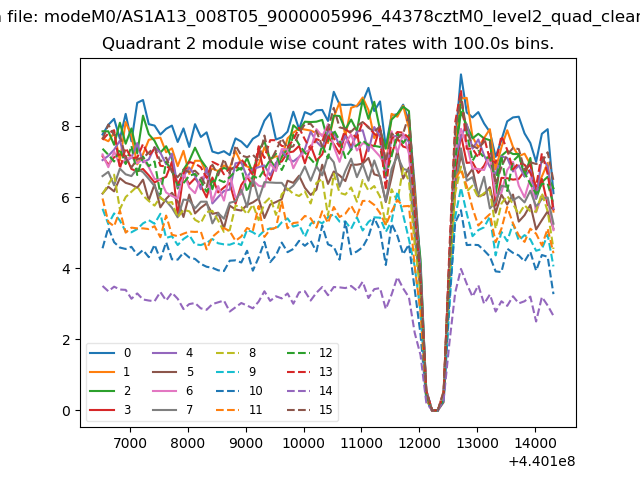
| Module-wise count rates for Quadrant B Data is divided into 100 sec bins |
 |
 |
| Module-wise count rates for Quadrant C Data is divided into 100 sec bins |
 |
 |
| Module-wise count rates for Quadrant D Data is divided into 100 sec bins |
 |
 |
| Parameter | Plot |
|---|---|
| CZT HV Monitor | 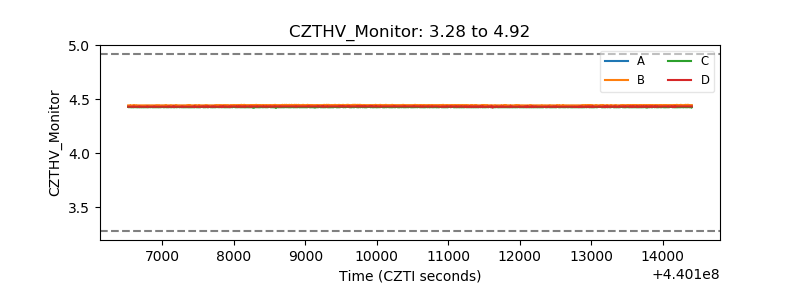 |
| D_VDD | 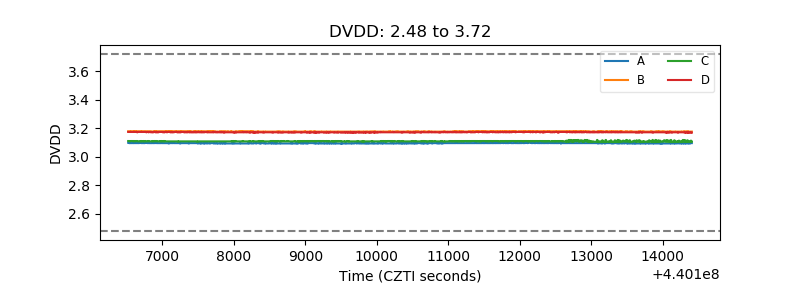 |
| Temperature 1 | 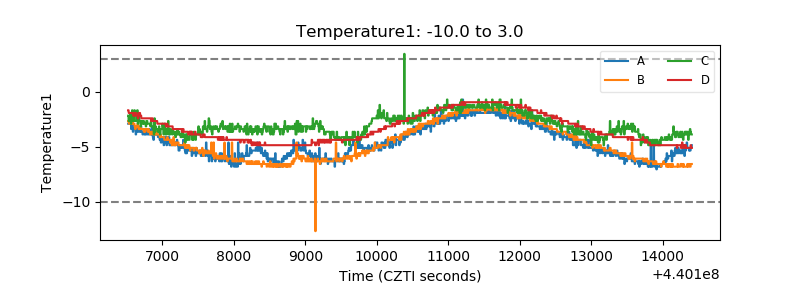 |
| Veto HV Monitor | 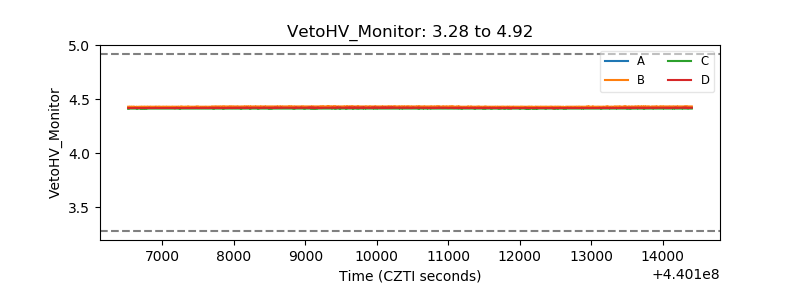 |
| Veto LLD | 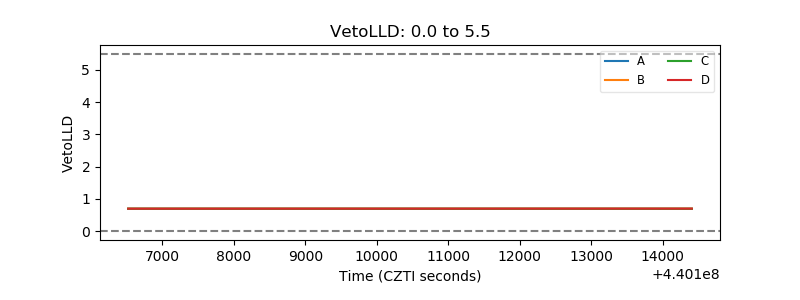 |
| Alpha Counter |  |
| _CPM_Rate | 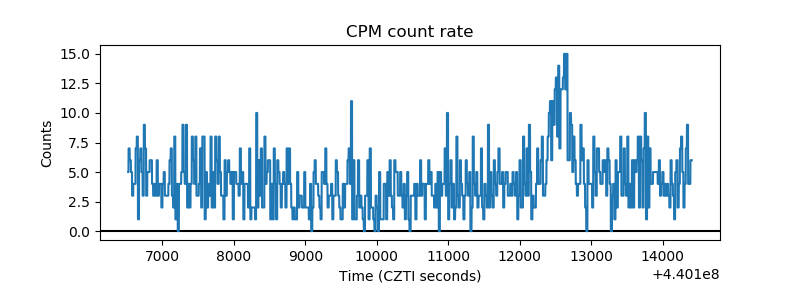 |
| CZT Counter | 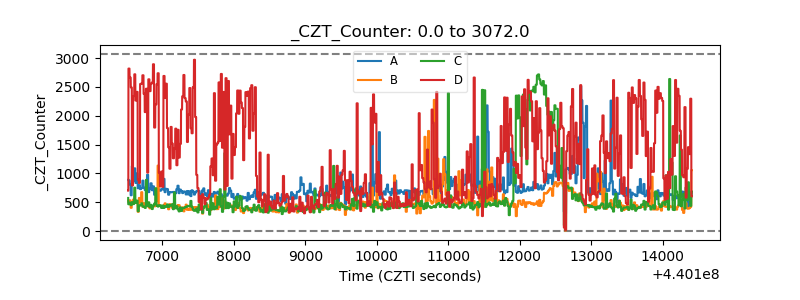 |
| +2.5 Volts monitor | 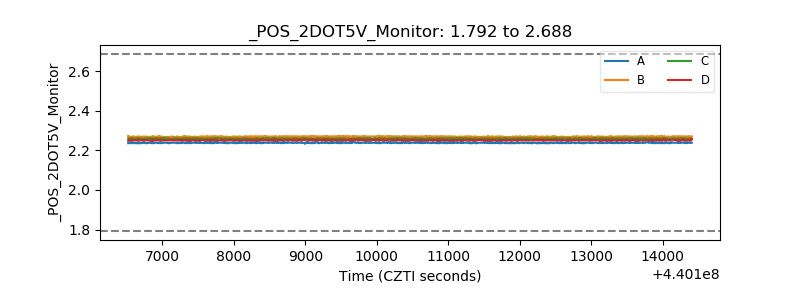 |
| +5 Volts monitor | 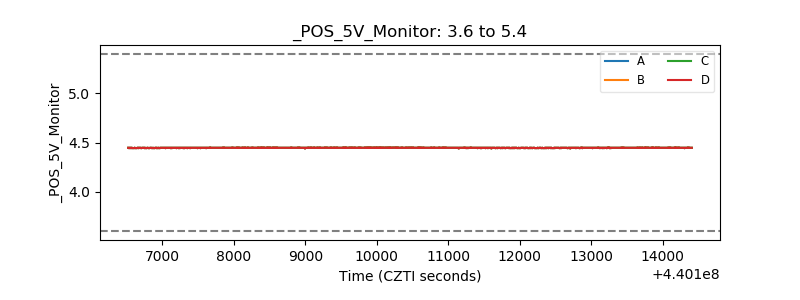 |
| _ROLL_ROT | 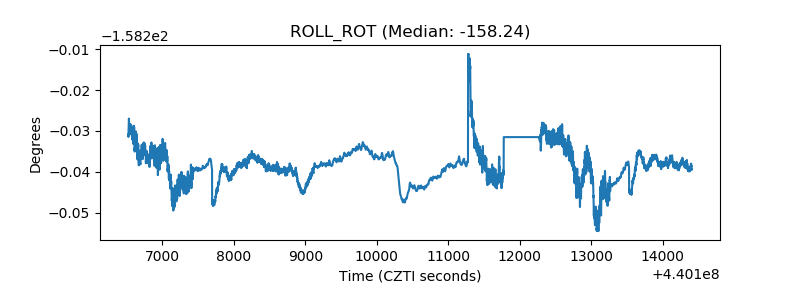 |
| _Roll_DEC | 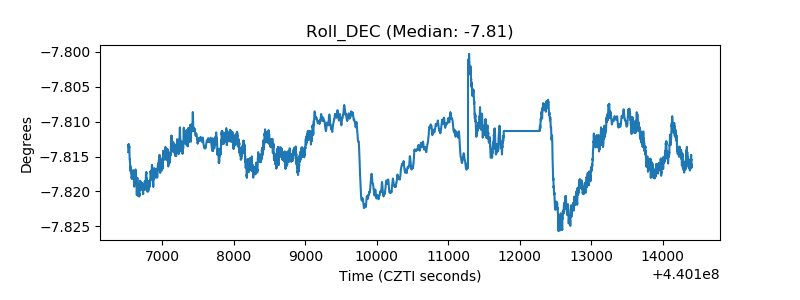 |
| _Roll_RA | 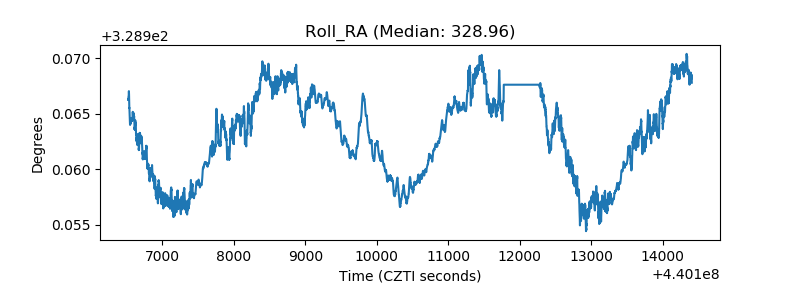 |
| Veto Counter | 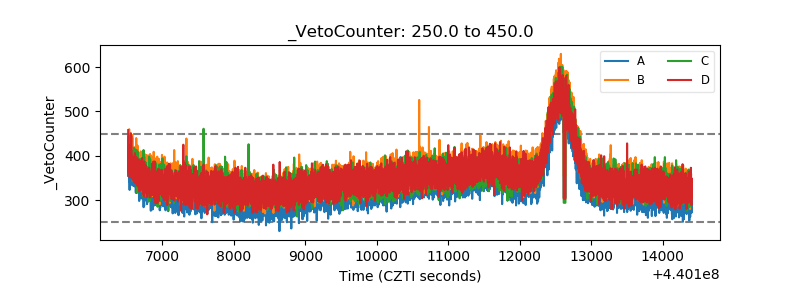 |