| Param | Original file | Final file |
|---|---|---|
| Filename | modeM0/AS1A13_008T05_9000005996_44381cztM0_level2.fits | modeM0/AS1A13_008T05_9000005996_44381cztM0_level2_quad_clean.evt |
| Size (bytes) | 1,523,335,680 | 293,114,880 |
| Size | 1.4 GB | 279.5 MB |
| Events in quadrant A | 13,966,065 | 1,986,248 |
| Events in quadrant B | 10,000,943 | 2,038,420 |
| Events in quadrant C | 10,913,507 | 1,918,049 |
| Events in quadrant D | 20,024,025 | 1,606,815 |
| Mode SS | |||
|---|---|---|---|
| Quadrant | BADHDUFLAG | Total packets | Discarded packets |
| A | 0 | 390 | 0 |
| B | 0 | 390 | 0 |
| C | 0 | 390 | 0 |
| D | 0 | 390 | 0 |
| Mode M0 | |||
|---|---|---|---|
| Quadrant | BADHDUFLAG | Total packets | Discarded packets |
| A | 0 | 57891 | 4 |
| B | 0 | 42802 | 4 |
| C | 0 | 46264 | 4 |
| D | 0 | 72875 | 4 |
| Mode M9 | |||
|---|---|---|---|
| Quadrant | BADHDUFLAG | Total packets | Discarded packets |
| A | 0 | 16 | 0 |
| B | 0 | 16 | 0 |
| C | 0 | 16 | 0 |
| D | 0 | 16 | 0 |
| Quadrant | Total seconds | Saturated seconds | Saturation percentage |
|---|---|---|---|
| A | 19225 | 500 | 2.600780% |
| B | 19225 | 527 | 2.741222% |
| C | 19225 | 771 | 4.010403% |
| D | 19225 | 2357 | 12.260078% |
Noise dominated data is calculated using 1-second bins in cleaned event files. If a bin has >2000 counts, and if more than 50% of those come from <1% of pixels, then it is considered to be noise-dominated and hence unusable.
| Quadrant | # 1 sec bins | Bins with >0 counts | Bins with >2000 counts | High rate bins dominated by noise | Noise dominated (total time) | Noise dominated (detector-on time) | Marked lightcurve |
|---|---|---|---|---|---|---|---|
| A | 20825 | 19227 | 119 | 119 | 0.57% | 0.62% | 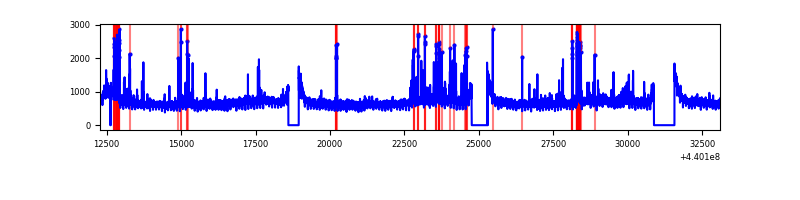 |
| B | 20825 | 19227 | 174 | 174 | 0.84% | 0.90% | 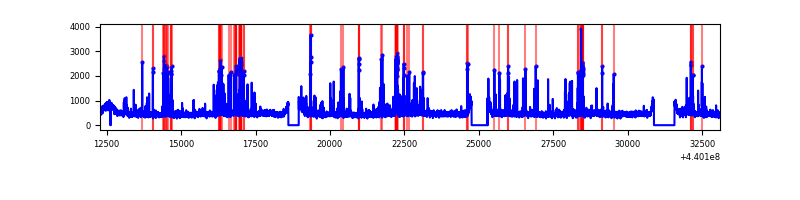 |
| C | 20825 | 19226 | 527 | 527 | 2.53% | 2.74% | 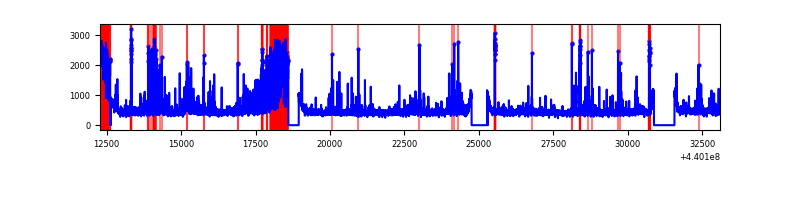 |
| D | 20825 | 19226 | 2054 | 2054 | 9.86% | 10.68% | 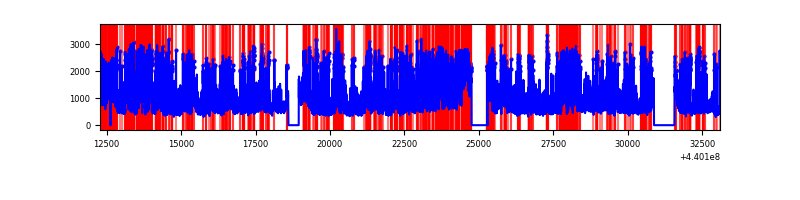 |
Top three noisy pixels from each quadrant. If the there are fewer than three noisy pixels in the level2.evt file, extra rows are filled as -1
| Pixel properties | Quadrant properties | ||||||
|---|---|---|---|---|---|---|---|
| Quadrant | DetID | PixID | Counts | Sigma | Mean | Median | Sigma |
| A | 10 | 83 | 4566904 | 10013.68 | 2190 | 2144 | 455.9 |
| A | 15 | 223 | 407387 | 888.98 | 2190 | 2144 | 455.9 |
| A | 13 | 248 | 406403 | 886.82 | 2190 | 2144 | 455.9 |
| B | 5 | 172 | 504534 | 1148.32 | 2188 | 2114 | 437.5 |
| B | 5 | 255 | 314594 | 714.2 | 2188 | 2114 | 437.5 |
| B | 0 | 190 | 139456 | 313.91 | 2188 | 2114 | 437.5 |
| C | 15 | 158 | 1612560 | 3191.1 | 2118 | 2125 | 504.7 |
| C | 14 | 254 | 389254 | 767.1 | 2118 | 2125 | 504.7 |
| C | 2 | 14 | 254285 | 499.66 | 2118 | 2125 | 504.7 |
| D | 1 | 52 | 4774235 | 9090.83 | 2060 | 1996 | 525.0 |
| D | 12 | 2 | 2381345 | 4532.52 | 2060 | 1996 | 525.0 |
| D | 5 | 222 | 1047374 | 1991.38 | 2060 | 1996 | 525.0 |
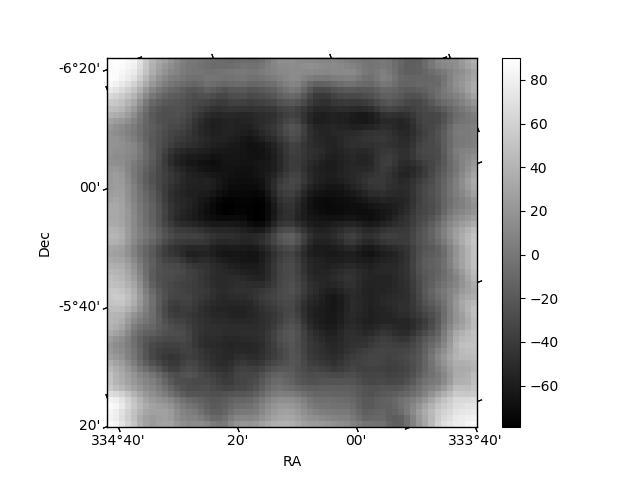
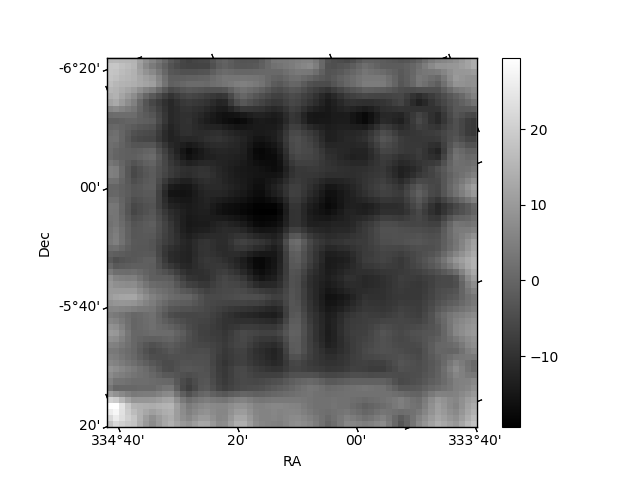
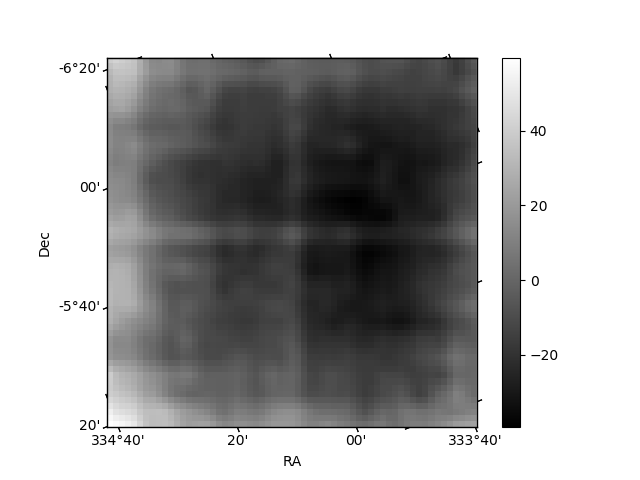
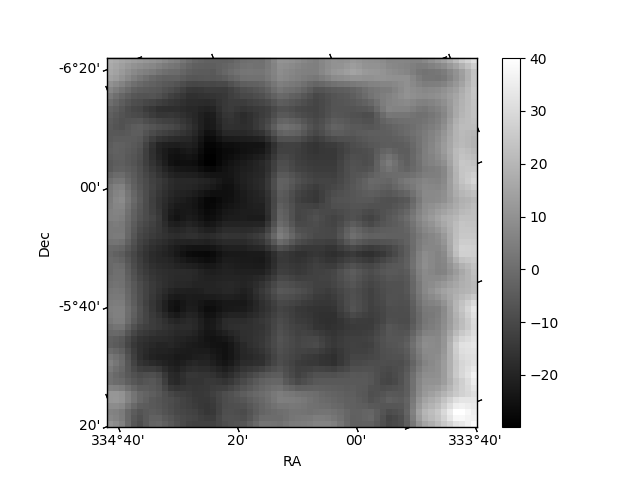
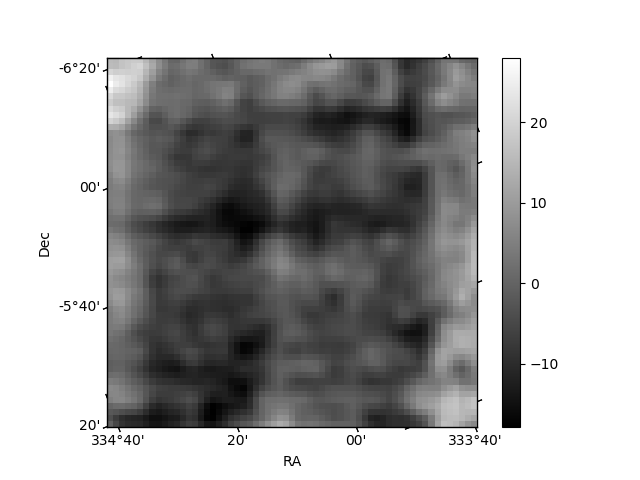
Histogram calculated using DETX and DETY for each event in the final _common_clean file
| Quadrant A | 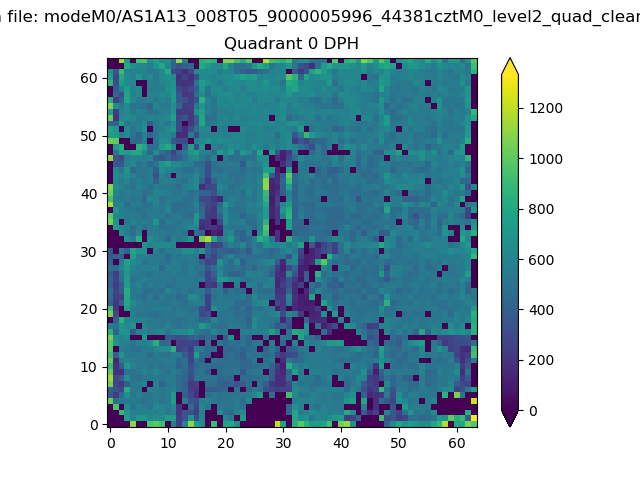 |
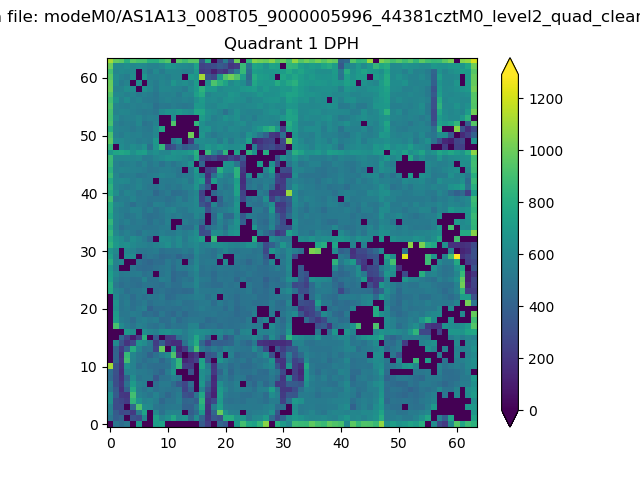 |
Quadrant B |
|---|---|---|---|
| Quadrant D | 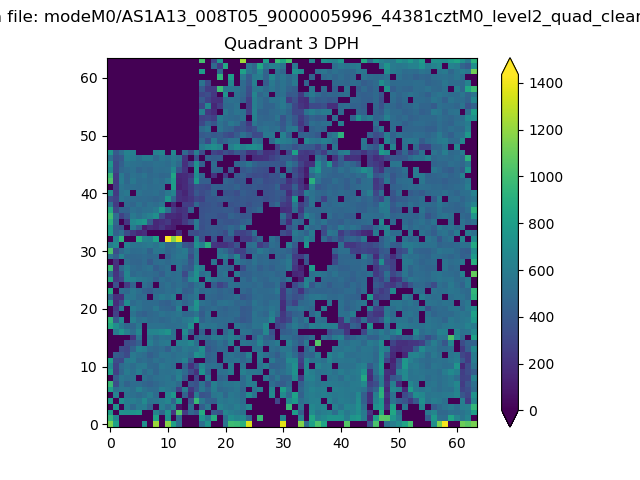 |
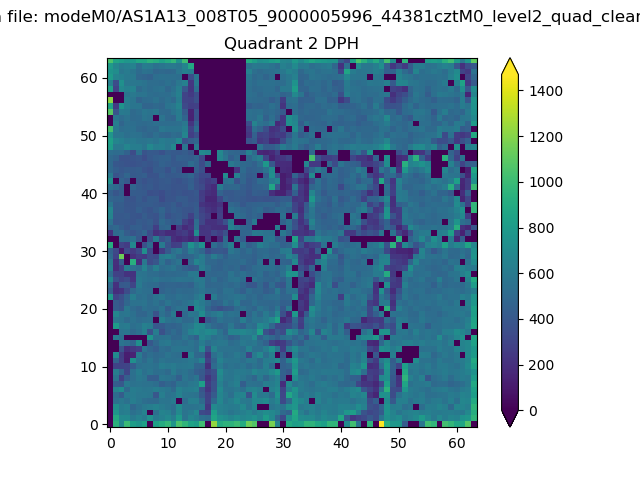 |
Quadrant C |
| Plot type | Count rate plots | Images |
|---|---|---|
| Comparison with Poisson distribution Blue bars denote a histogram of data divided into 1 sec bins. Red curve is a Poisson curve with rate = median count rate of data. |
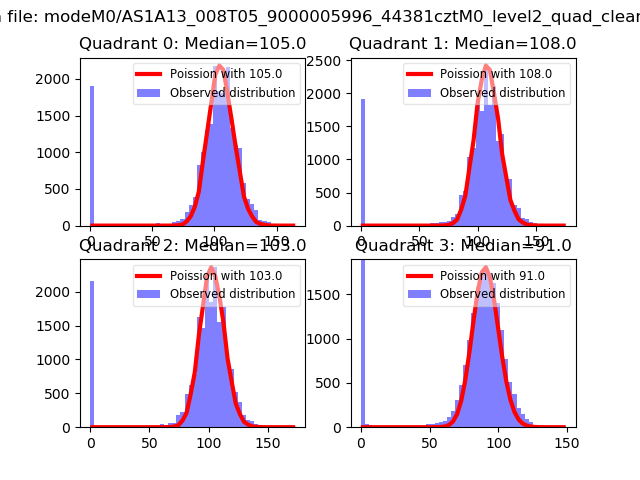 |
 |
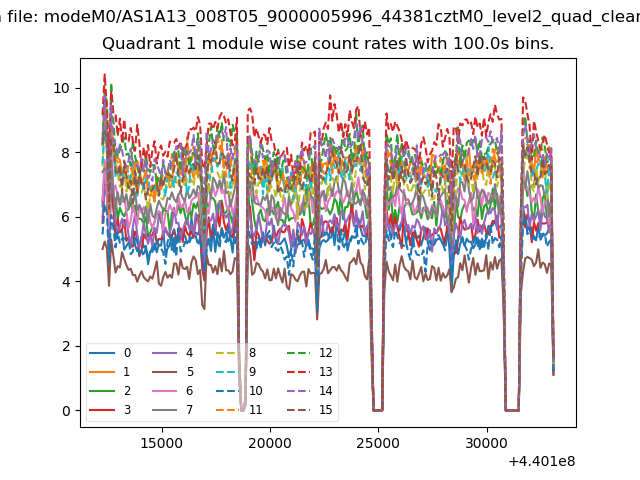
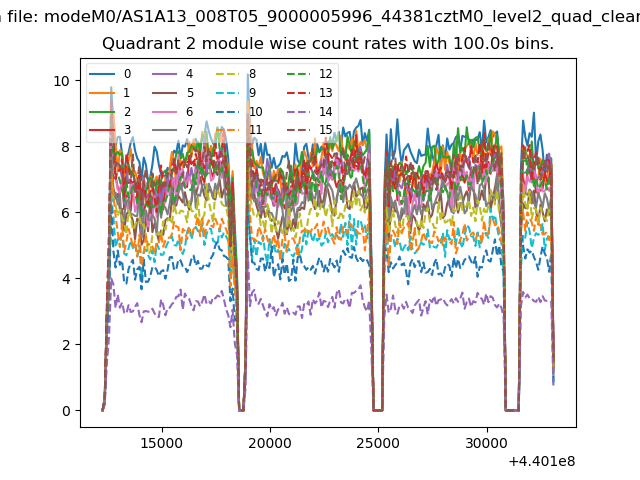
| Quadrant-wise count rates Data is divided into 100 sec bins |
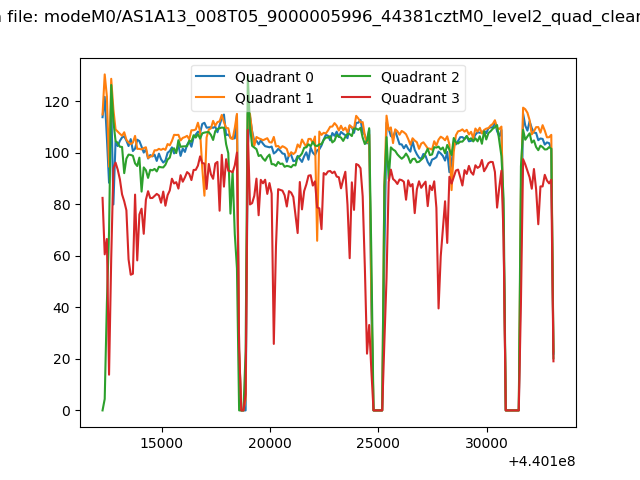 |
|
| Module-wise count rates for Quadrant A Data is divided into 100 sec bins |
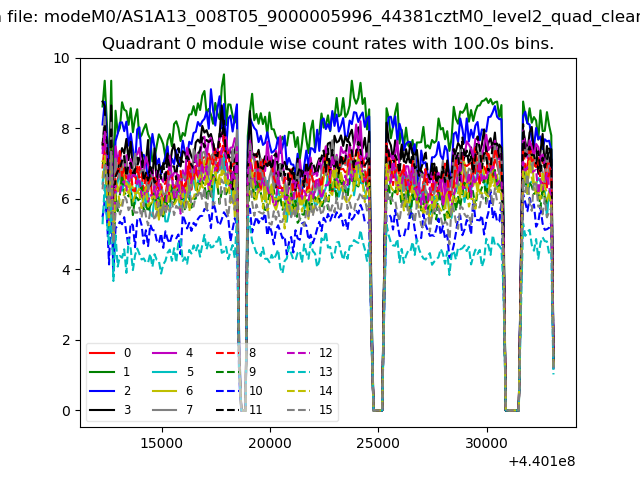 |
 |
| Module-wise count rates for Quadrant B Data is divided into 100 sec bins |
 |
 |
| Module-wise count rates for Quadrant C Data is divided into 100 sec bins |
 |
 |
| Module-wise count rates for Quadrant D Data is divided into 100 sec bins |
 |
 |
| Parameter | Plot |
|---|---|
| CZT HV Monitor | 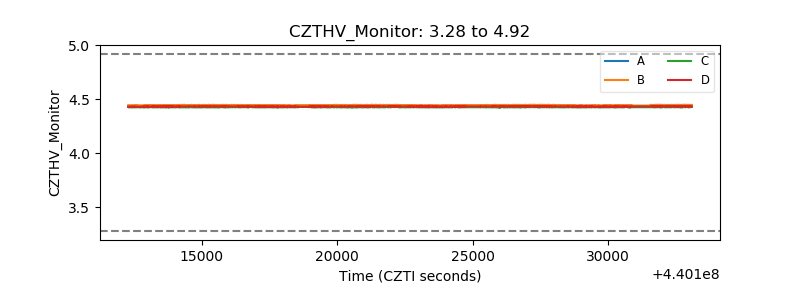 |
| D_VDD | 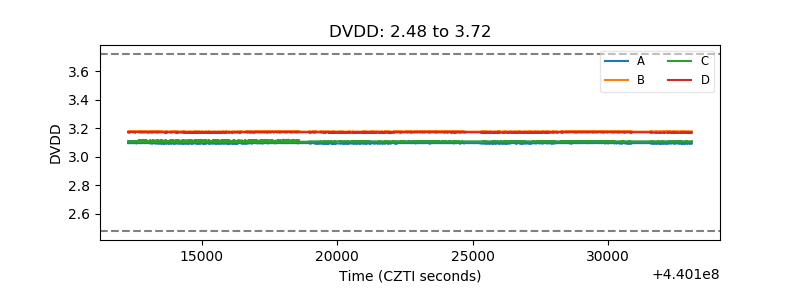 |
| Temperature 1 | 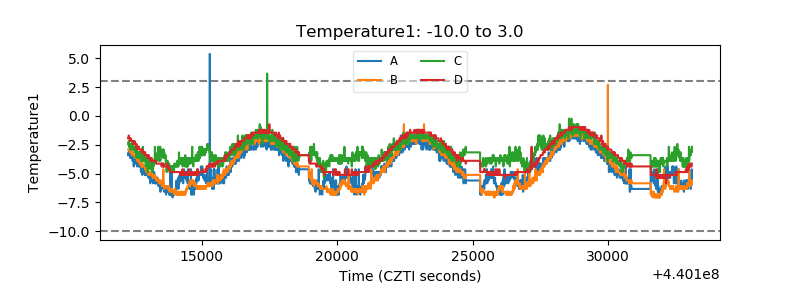 |
| Veto HV Monitor | 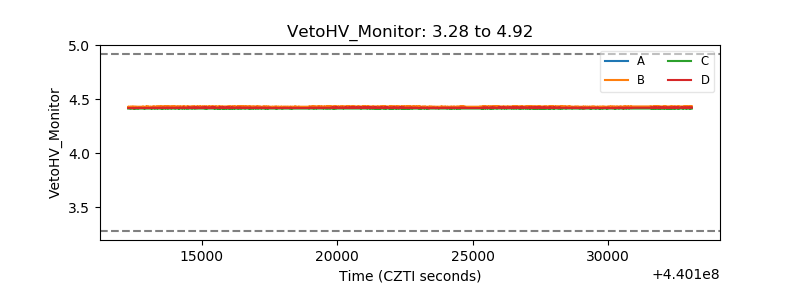 |
| Veto LLD | 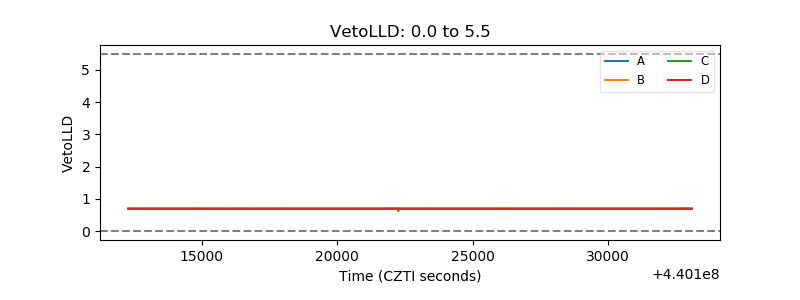 |
| Alpha Counter | 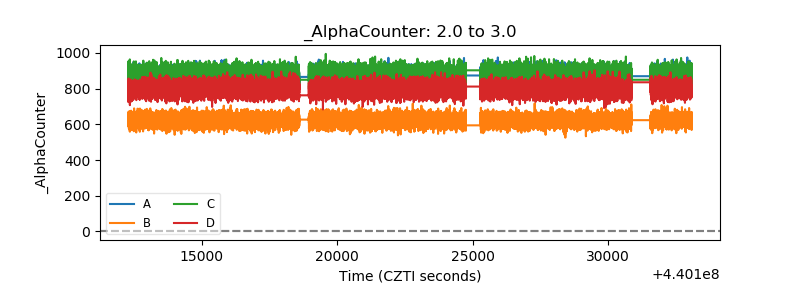 |
| _CPM_Rate | 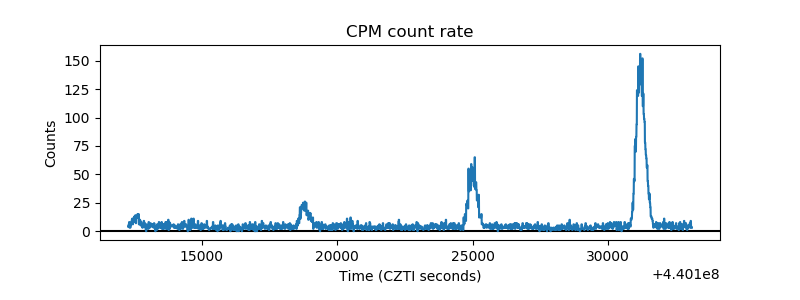 |
| CZT Counter | 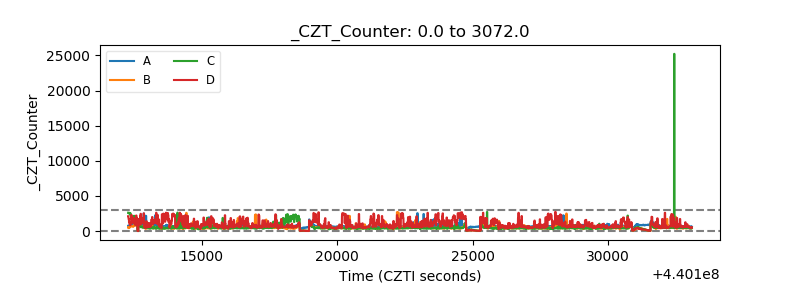 |
| +2.5 Volts monitor | 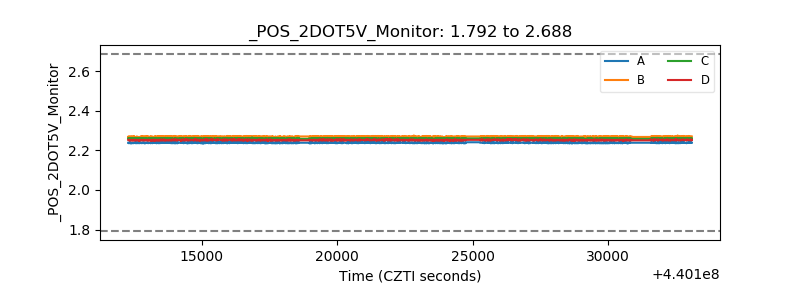 |
| +5 Volts monitor | 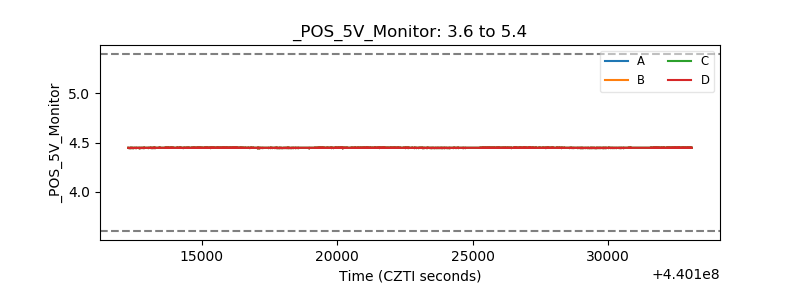 |
| _ROLL_ROT | 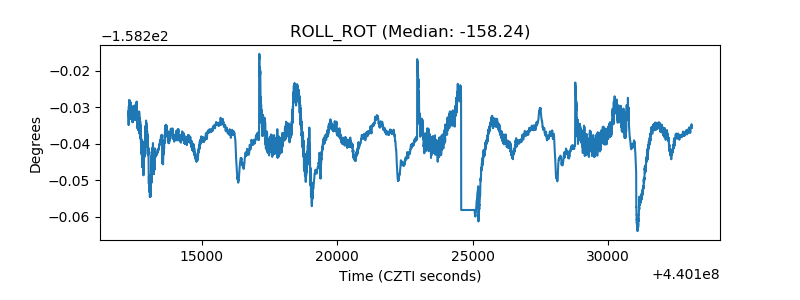 |
| _Roll_DEC | 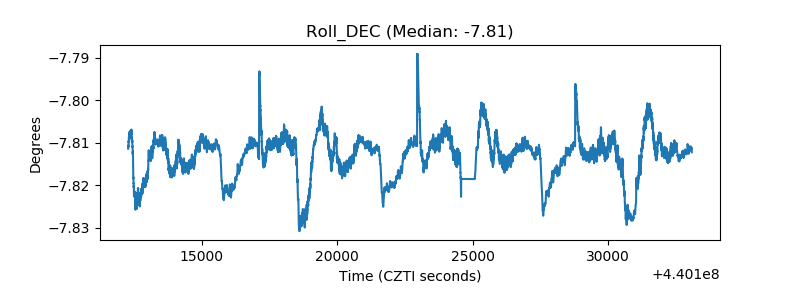 |
| _Roll_RA | 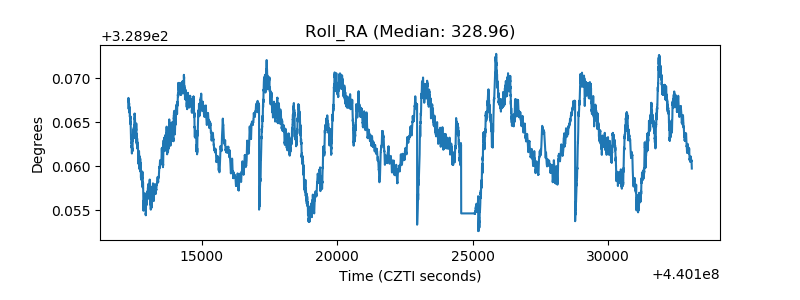 |
| Veto Counter | 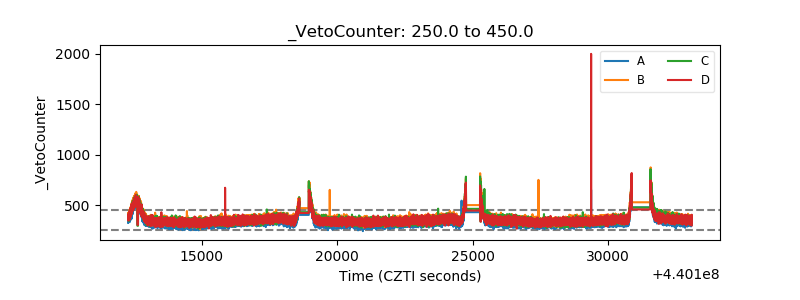 |