| Param | Original file | Final file |
|---|---|---|
| Filename | modeM0/AS1A13_008T05_9000005996_44382cztM0_level2.fits | modeM0/AS1A13_008T05_9000005996_44382cztM0_level2_quad_clean.evt |
| Size (bytes) | 362,920,320 | 76,590,720 |
| Size | 346.1 MB | 73.0 MB |
| Events in quadrant A | 3,468,626 | 510,690 |
| Events in quadrant B | 2,511,550 | 538,800 |
| Events in quadrant C | 2,339,499 | 515,855 |
| Events in quadrant D | 4,736,362 | 412,852 |
| Mode SS | |||
|---|---|---|---|
| Quadrant | BADHDUFLAG | Total packets | Discarded packets |
| A | 0 | 117 | 19 |
| B | 0 | 118 | 18 |
| C | 0 | 114 | 19 |
| D | 0 | 118 | 18 |
| Mode M0 | |||
|---|---|---|---|
| Quadrant | BADHDUFLAG | Total packets | Discarded packets |
| A | 0 | 17332 | 2843 |
| B | 0 | 12599 | 1880 |
| C | 0 | 12235 | 1893 |
| D | 0 | 21032 | 3736 |
| Mode M9 | |||
|---|---|---|---|
| Quadrant | BADHDUFLAG | Total packets | Discarded packets |
| A | 0 | 12 | 4 |
| B | 0 | 13 | 4 |
| C | 0 | 11 | 2 |
| D | 0 | 10 | 1 |
| Quadrant | Total seconds | Saturated seconds | Saturation percentage |
|---|---|---|---|
| A | 4819 | 94 | 1.950612% |
| B | 4891 | 87 | 1.778777% |
| C | 4894 | 35 | 0.715161% |
| D | 4806 | 653 | 13.587183% |
Noise dominated data is calculated using 1-second bins in cleaned event files. If a bin has >2000 counts, and if more than 50% of those come from <1% of pixels, then it is considered to be noise-dominated and hence unusable.
| Quadrant | # 1 sec bins | Bins with >0 counts | Bins with >2000 counts | High rate bins dominated by noise | Noise dominated (total time) | Noise dominated (detector-on time) | Marked lightcurve |
|---|---|---|---|---|---|---|---|
| A | 7735 | 4941 | 1 | 1 | 0.01% | 0.02% | 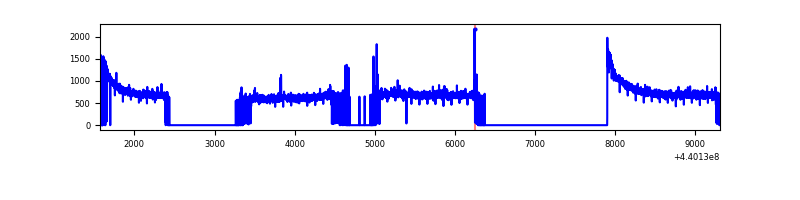 |
| B | 7737 | 5021 | 29 | 29 | 0.37% | 0.58% | 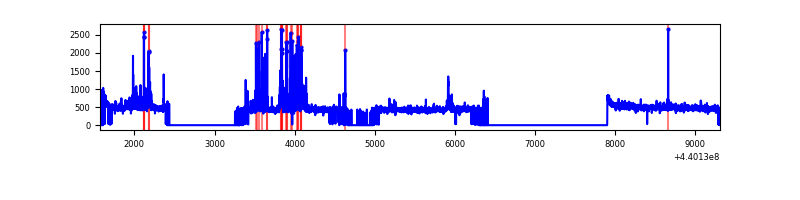 |
| C | 7731 | 5042 | 10 | 10 | 0.13% | 0.20% | 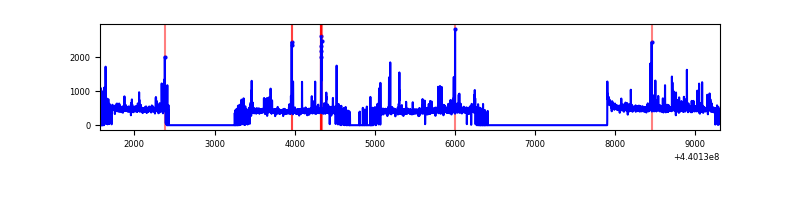 |
| D | 7737 | 4912 | 608 | 608 | 7.86% | 12.38% | 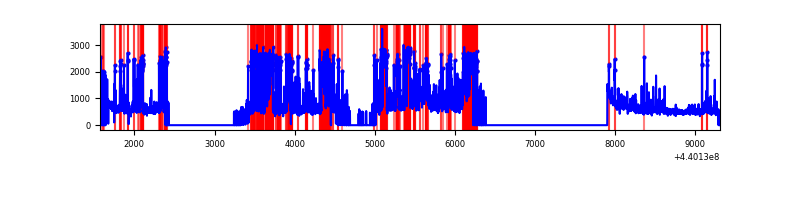 |
Top three noisy pixels from each quadrant. If the there are fewer than three noisy pixels in the level2.evt file, extra rows are filled as -1
| Pixel properties | Quadrant properties | ||||||
|---|---|---|---|---|---|---|---|
| Quadrant | DetID | PixID | Counts | Sigma | Mean | Median | Sigma |
| A | 10 | 83 | 1291898 | 11258.11 | 548 | 536 | 114.7 |
| A | 15 | 223 | 31991 | 274.23 | 548 | 536 | 114.7 |
| A | 13 | 248 | 11888 | 98.97 | 548 | 536 | 114.7 |
| B | 5 | 172 | 208872 | 1862.2 | 558 | 542 | 111.9 |
| B | 5 | 255 | 24290 | 212.28 | 558 | 542 | 111.9 |
| B | 0 | 190 | 21080 | 183.58 | 558 | 542 | 111.9 |
| C | 14 | 254 | 134898 | 1030.71 | 547 | 549 | 130.3 |
| C | 0 | 207 | 21269 | 158.96 | 547 | 549 | 130.3 |
| C | 3 | 233 | 18672 | 139.04 | 547 | 549 | 130.3 |
| D | 1 | 52 | 611562 | 4761.33 | 506 | 491 | 128.3 |
| D | 13 | 249 | 567386 | 4417.12 | 506 | 491 | 128.3 |
| D | 12 | 2 | 406434 | 3163.02 | 506 | 491 | 128.3 |
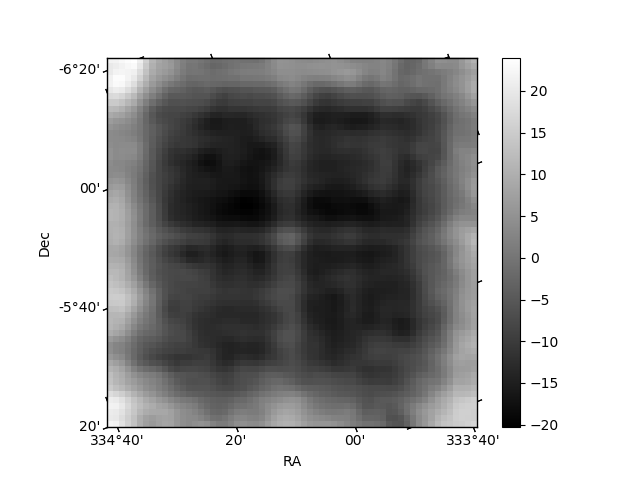
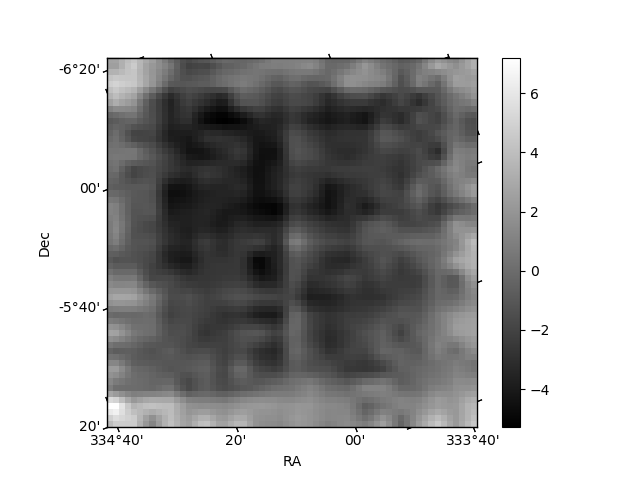
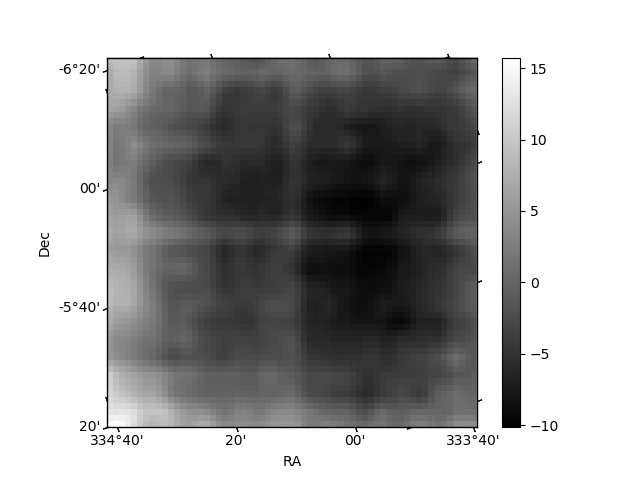
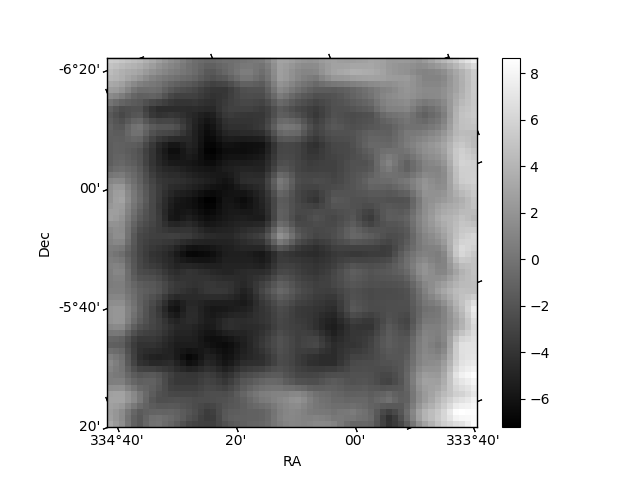
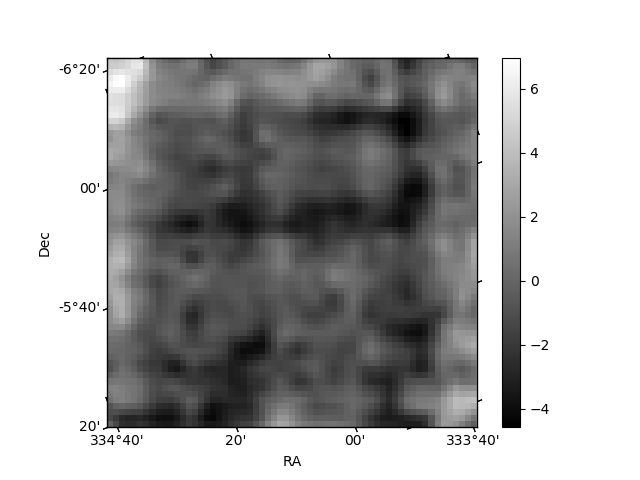
Histogram calculated using DETX and DETY for each event in the final _common_clean file
| Quadrant A | 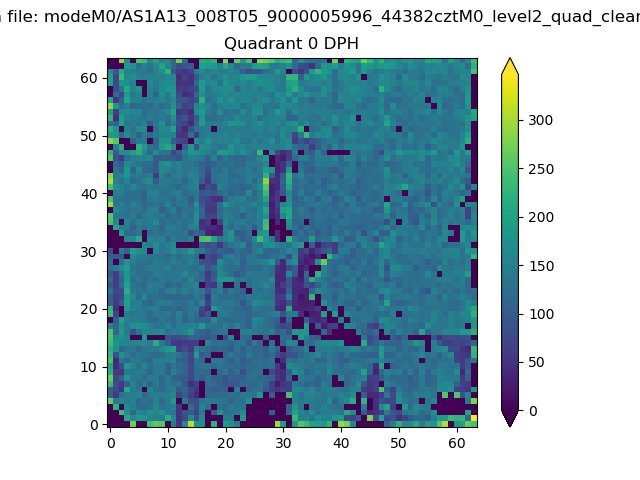 |
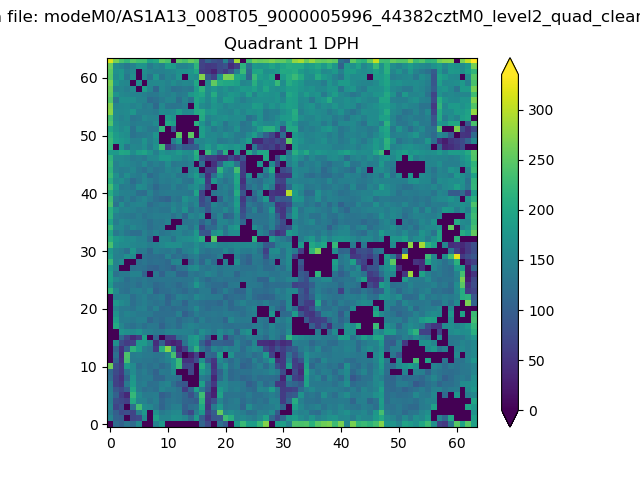 |
Quadrant B |
|---|---|---|---|
| Quadrant D | 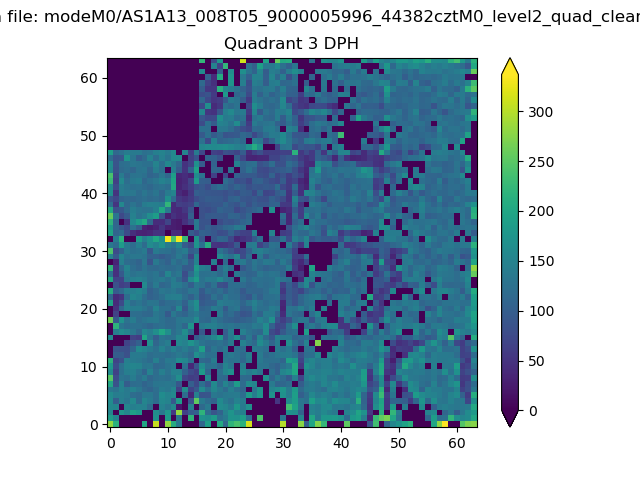 |
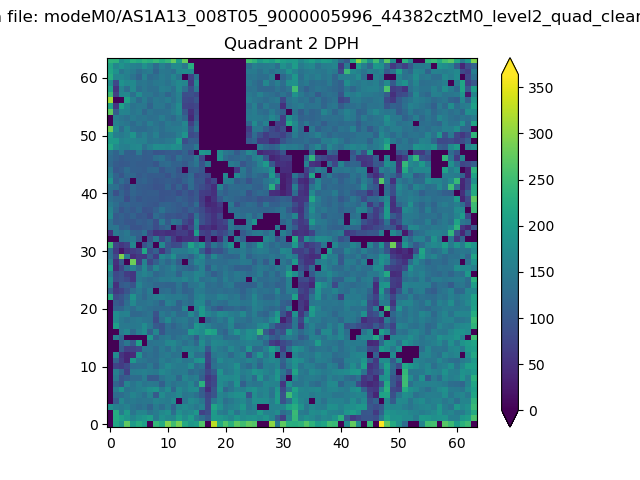 |
Quadrant C |
| Plot type | Count rate plots | Images |
|---|---|---|
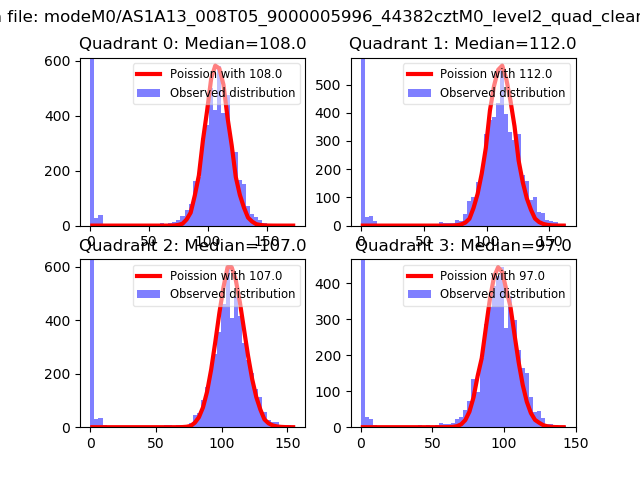
| Comparison with Poisson distribution Blue bars denote a histogram of data divided into 1 sec bins. Red curve is a Poisson curve with rate = median count rate of data. |
 |
 |
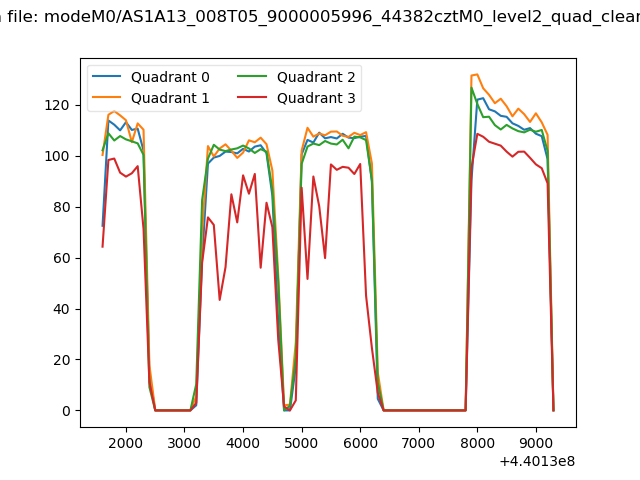
| Quadrant-wise count rates Data is divided into 100 sec bins |
 |
|
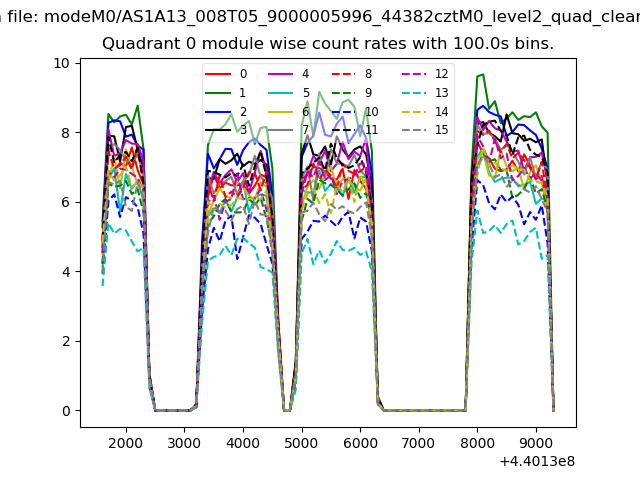
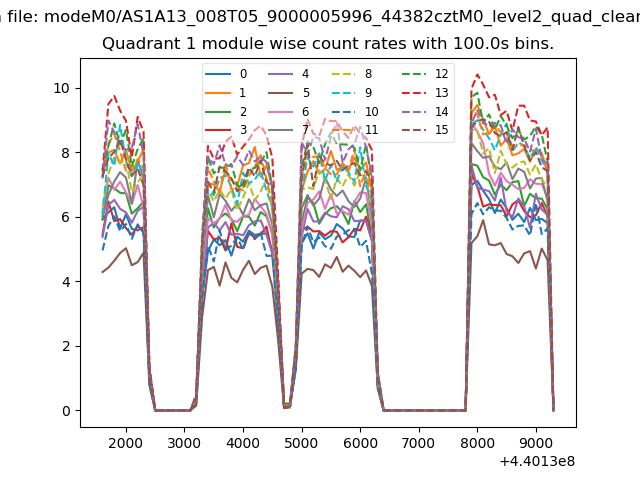
| Module-wise count rates for Quadrant A Data is divided into 100 sec bins |
 |
 |
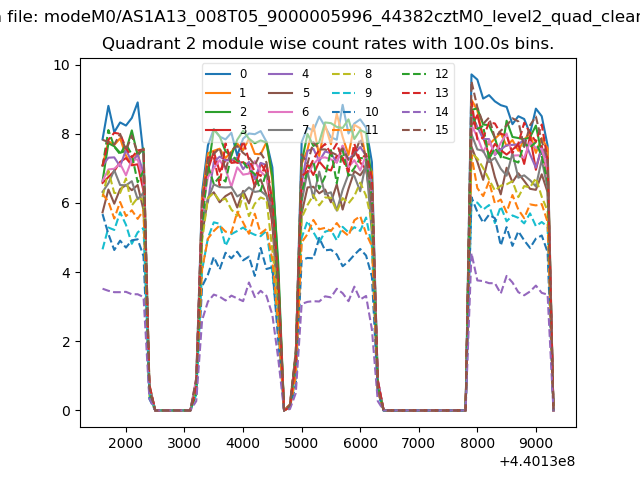
| Module-wise count rates for Quadrant B Data is divided into 100 sec bins |
 |
 |
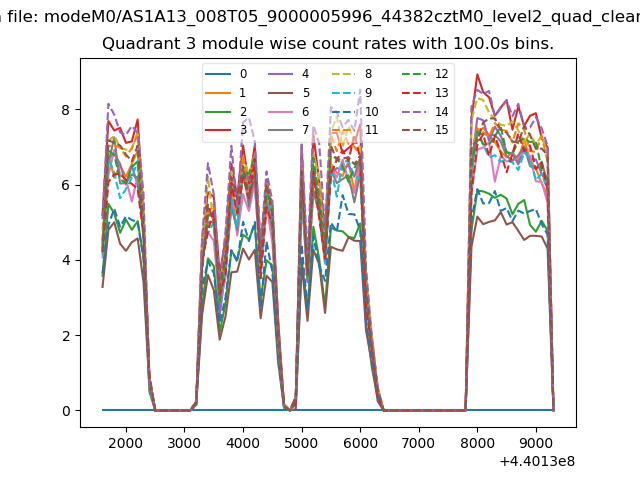
| Module-wise count rates for Quadrant C Data is divided into 100 sec bins |
 |
 |
| Module-wise count rates for Quadrant D Data is divided into 100 sec bins |
 |
 |
| Parameter | Plot |
|---|---|
| CZT HV Monitor |  |
| D_VDD | 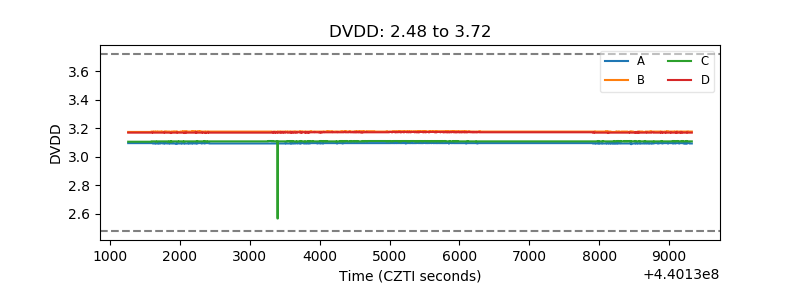 |
| Temperature 1 |  |
| Veto HV Monitor | 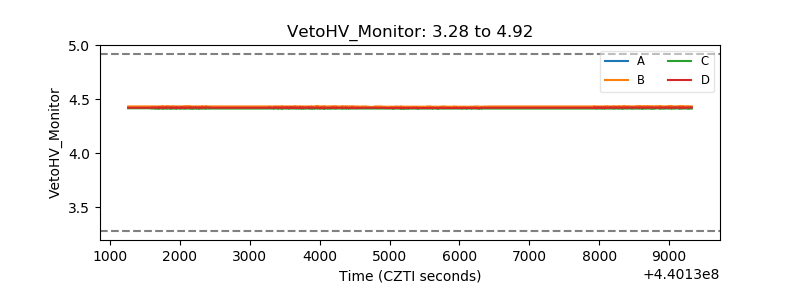 |
| Veto LLD | 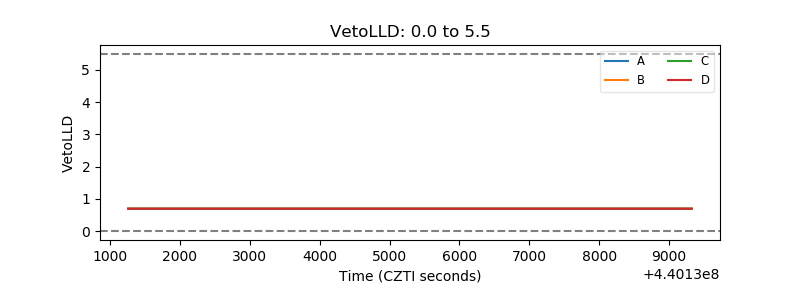 |
| Alpha Counter | 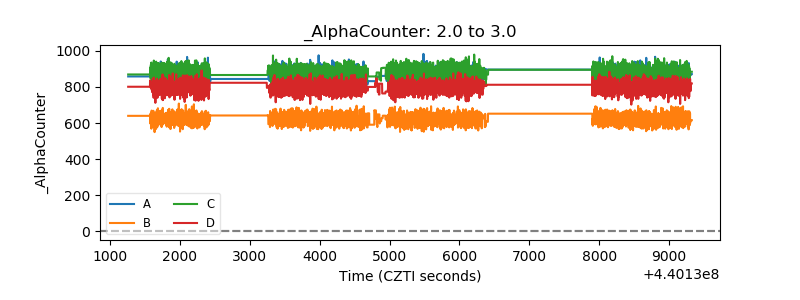 |
| _CPM_Rate | 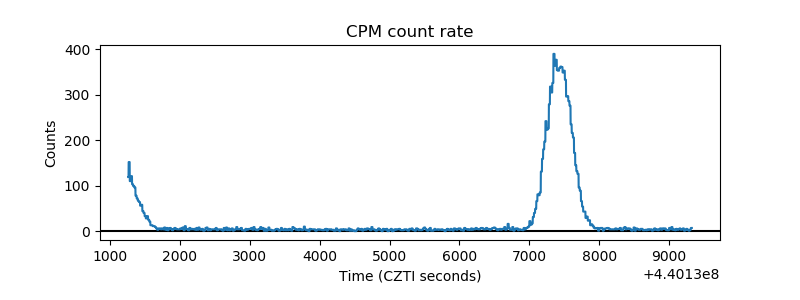 |
| CZT Counter | 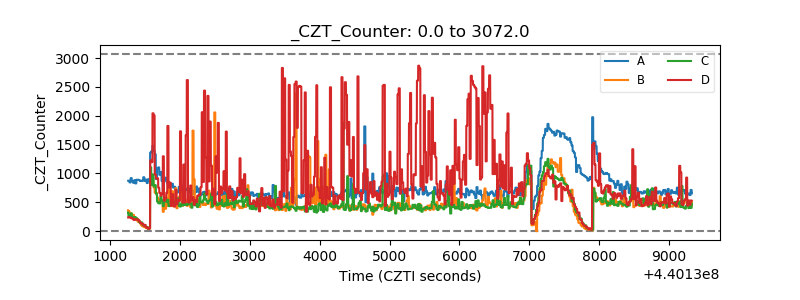 |
| +2.5 Volts monitor | 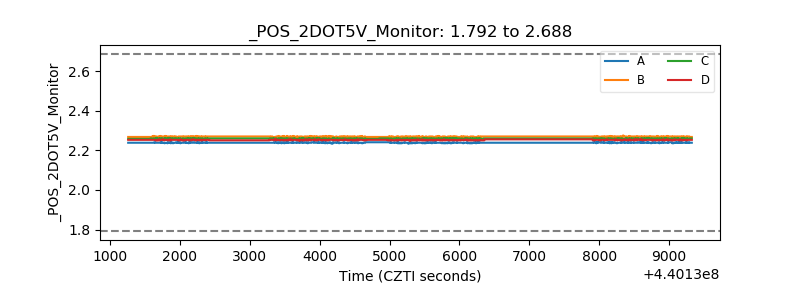 |
| +5 Volts monitor | 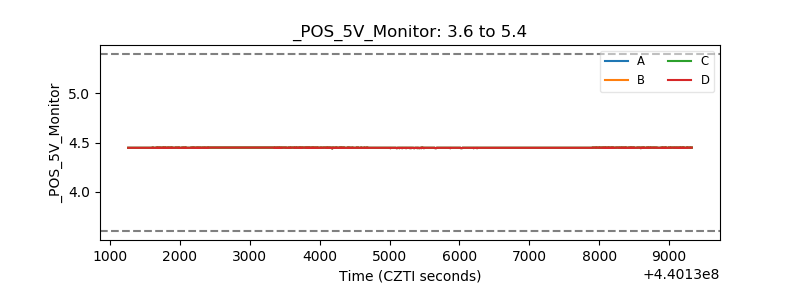 |
| _ROLL_ROT | 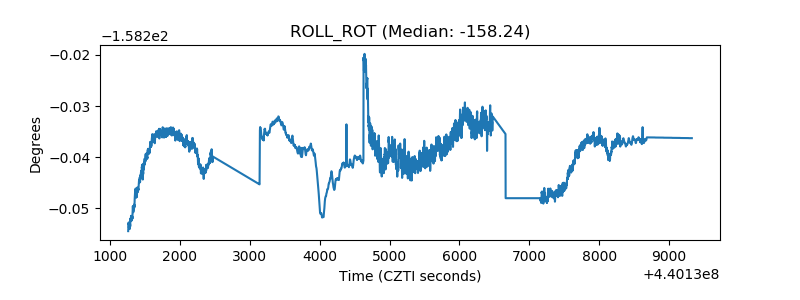 |
| _Roll_DEC | 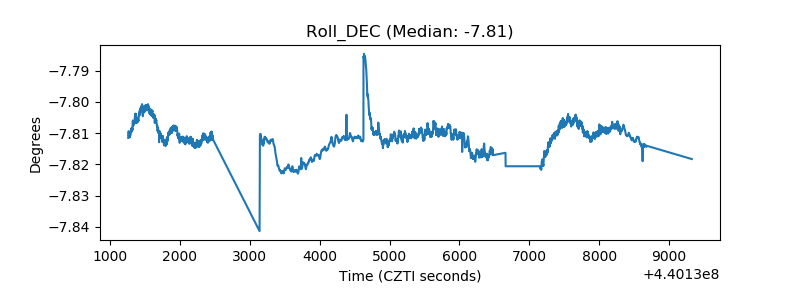 |
| _Roll_RA | 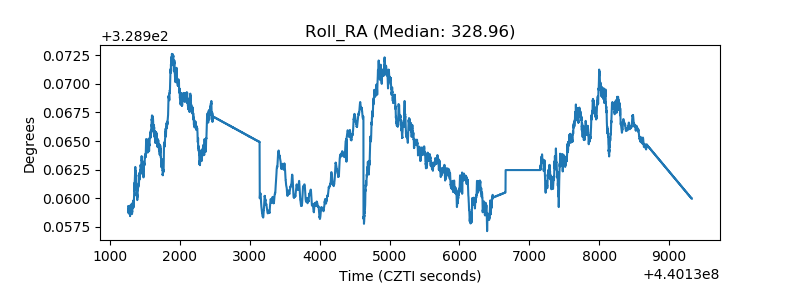 |
| Veto Counter | 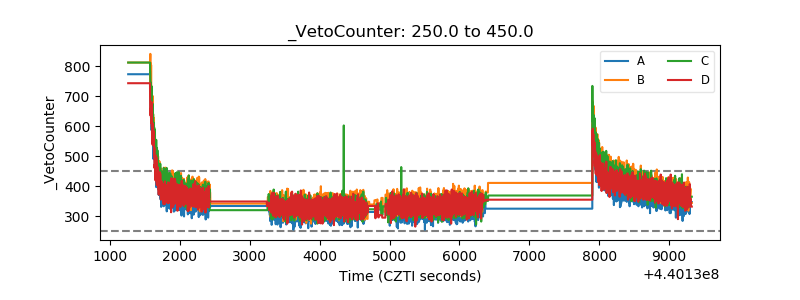 |