| Param | Original file | Final file |
|---|---|---|
| Filename | modeM0/AS1A13_008T05_9000005996_44384cztM0_level2.fits | modeM0/AS1A13_008T05_9000005996_44384cztM0_level2_quad_clean.evt |
| Size (bytes) | 339,955,200 | 75,602,880 |
| Size | 324.2 MB | 72.1 MB |
| Events in quadrant A | 3,463,531 | 495,042 |
| Events in quadrant B | 2,313,641 | 536,880 |
| Events in quadrant C | 2,328,418 | 508,841 |
| Events in quadrant D | 4,121,088 | 425,288 |
| Mode SS | |||
|---|---|---|---|
| Quadrant | BADHDUFLAG | Total packets | Discarded packets |
| A | 0 | 121 | 23 |
| B | 0 | 118 | 20 |
| C | 0 | 124 | 30 |
| D | 0 | 120 | 26 |
| Mode M0 | |||
|---|---|---|---|
| Quadrant | BADHDUFLAG | Total packets | Discarded packets |
| A | 0 | 18203 | 3978 |
| B | 0 | 12631 | 2699 |
| C | 0 | 12695 | 2614 |
| D | 0 | 20589 | 5133 |
| Mode M9 | |||
|---|---|---|---|
| Quadrant | BADHDUFLAG | Total packets | Discarded packets |
| A | 0 | 17 | 1 |
| B | 0 | 17 | 0 |
| C | 0 | 18 | 1 |
| D | 0 | 17 | 0 |
| Quadrant | Total seconds | Saturated seconds | Saturation percentage |
|---|---|---|---|
| A | 4532 | 133 | 2.934687% |
| B | 4663 | 62 | 1.329616% |
| C | 4667 | 56 | 1.199914% |
| D | 4467 | 353 | 7.902395% |
Noise dominated data is calculated using 1-second bins in cleaned event files. If a bin has >2000 counts, and if more than 50% of those come from <1% of pixels, then it is considered to be noise-dominated and hence unusable.
| Quadrant | # 1 sec bins | Bins with >0 counts | Bins with >2000 counts | High rate bins dominated by noise | Noise dominated (total time) | Noise dominated (detector-on time) | Marked lightcurve |
|---|---|---|---|---|---|---|---|
| A | 7717 | 4813 | 11 | 11 | 0.14% | 0.23% | 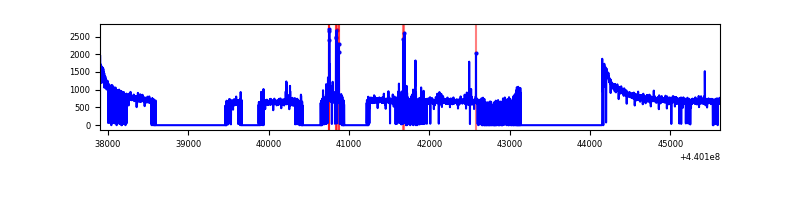 |
| B | 7717 | 4916 | 2 | 2 | 0.03% | 0.04% | 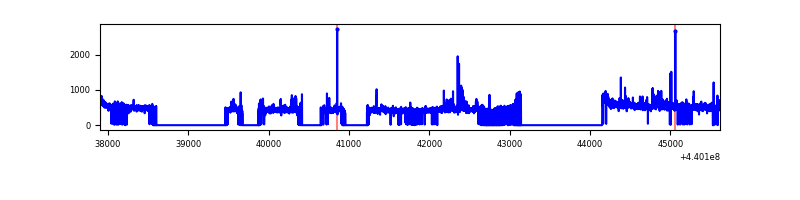 |
| C | 7717 | 4919 | 32 | 32 | 0.41% | 0.65% | 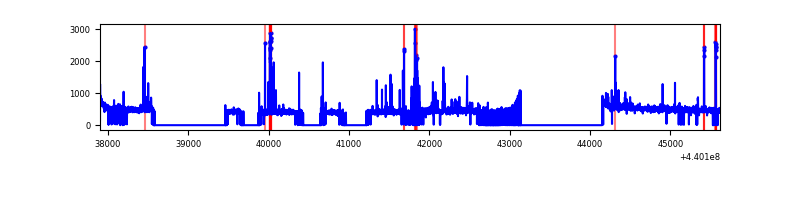 |
| D | 7716 | 4729 | 228 | 228 | 2.95% | 4.82% | 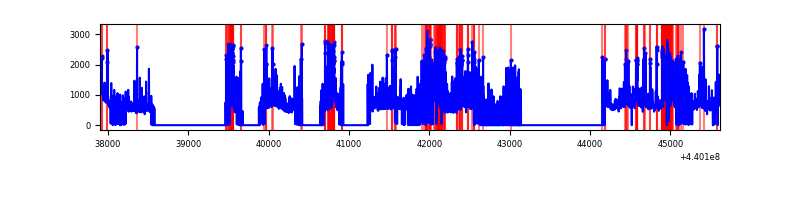 |
Top three noisy pixels from each quadrant. If the there are fewer than three noisy pixels in the level2.evt file, extra rows are filled as -1
| Pixel properties | Quadrant properties | ||||||
|---|---|---|---|---|---|---|---|
| Quadrant | DetID | PixID | Counts | Sigma | Mean | Median | Sigma |
| A | 10 | 83 | 1289527 | 11482.71 | 534 | 522 | 112.3 |
| A | 13 | 248 | 70003 | 618.95 | 534 | 522 | 112.3 |
| A | 15 | 223 | 25158 | 219.46 | 534 | 522 | 112.3 |
| B | 0 | 190 | 67789 | 620.34 | 551 | 534 | 108.4 |
| B | 5 | 255 | 23834 | 214.91 | 551 | 534 | 108.4 |
| B | 0 | 219 | 16748 | 149.55 | 551 | 534 | 108.4 |
| C | 14 | 254 | 129682 | 1009.88 | 539 | 543 | 127.9 |
| C | 0 | 207 | 50196 | 388.29 | 539 | 543 | 127.9 |
| C | 15 | 208 | 28937 | 222.04 | 539 | 543 | 127.9 |
| D | 1 | 52 | 876218 | 6862.85 | 503 | 486 | 127.6 |
| D | 5 | 222 | 329296 | 2576.79 | 503 | 486 | 127.6 |
| D | 8 | 192 | 177884 | 1390.22 | 503 | 486 | 127.6 |
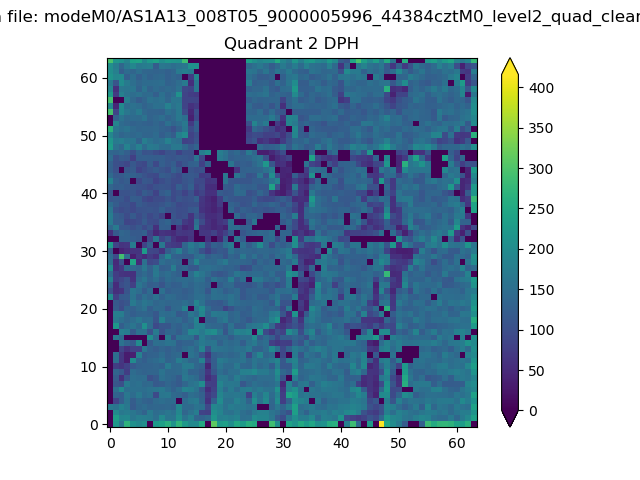
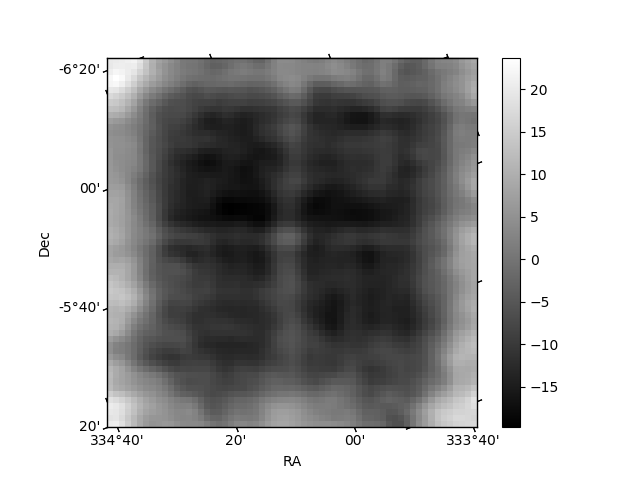
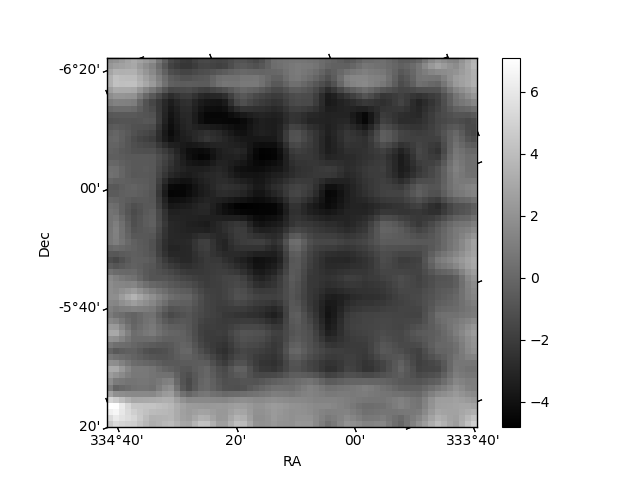
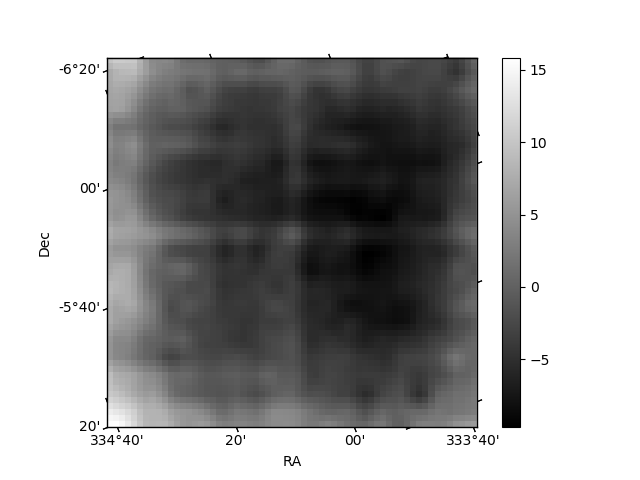
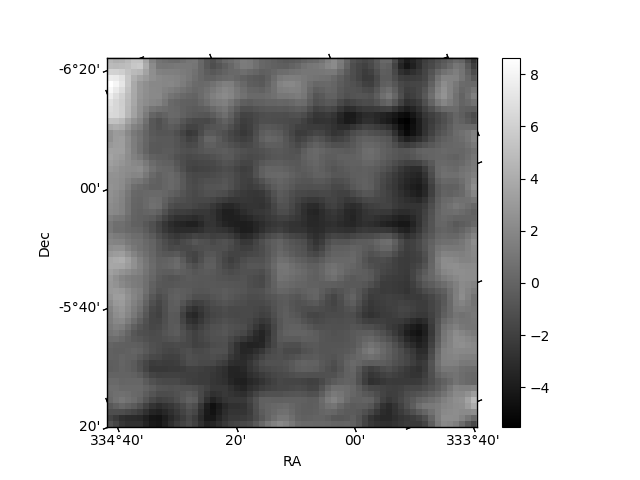
Histogram calculated using DETX and DETY for each event in the final _common_clean file
| Quadrant A | 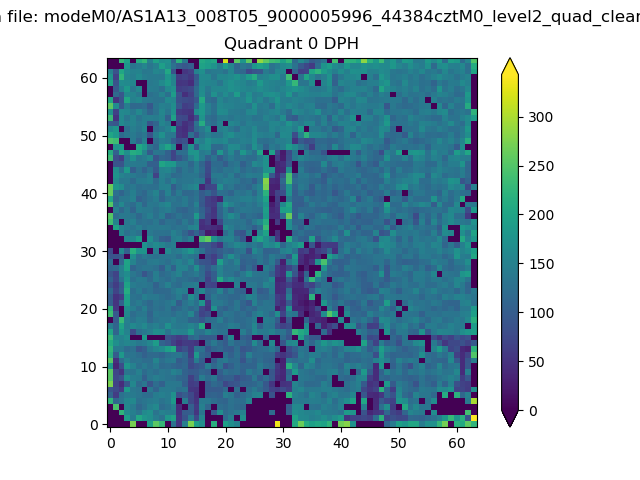 |
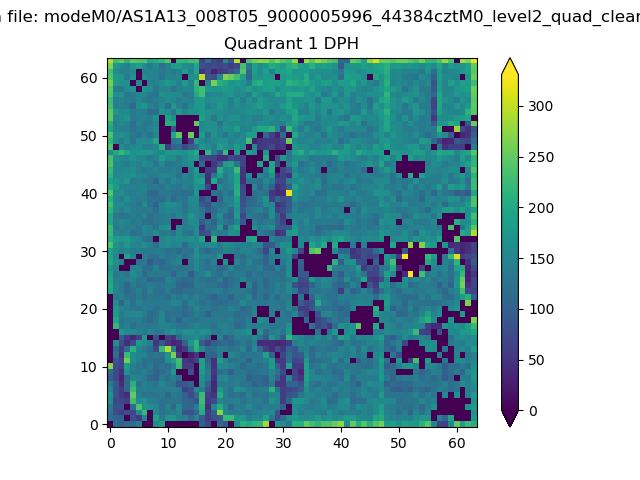 |
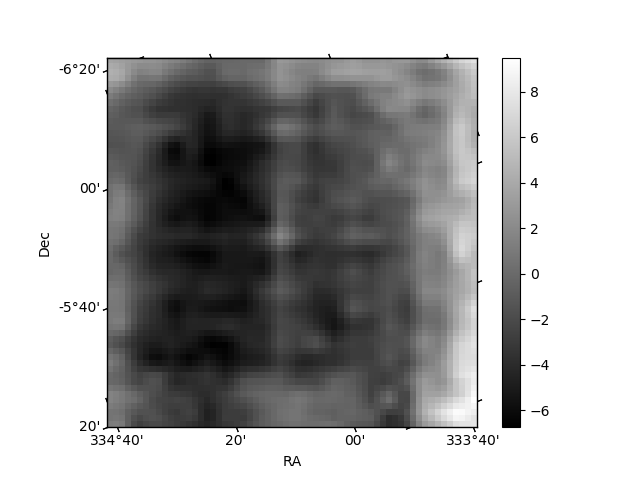
Quadrant B |
|---|---|---|---|
| Quadrant D | 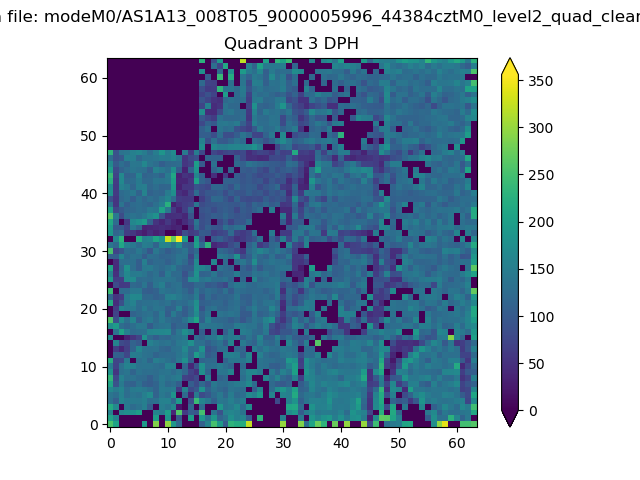 |
 |
Quadrant C |
| Plot type | Count rate plots | Images |
|---|---|---|
| Comparison with Poisson distribution Blue bars denote a histogram of data divided into 1 sec bins. Red curve is a Poisson curve with rate = median count rate of data. |
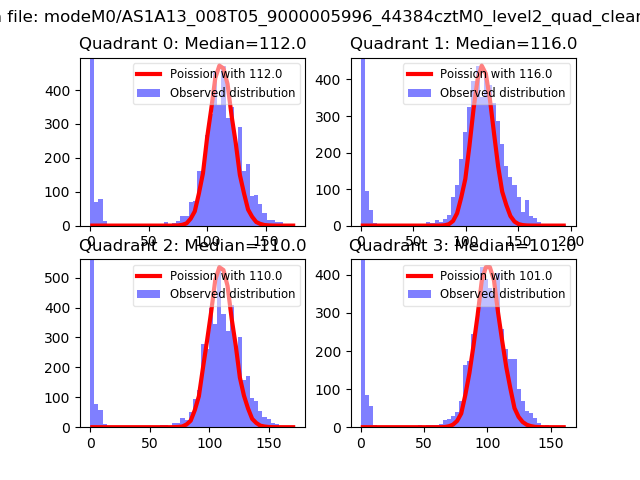 |
 |
| Quadrant-wise count rates Data is divided into 100 sec bins |
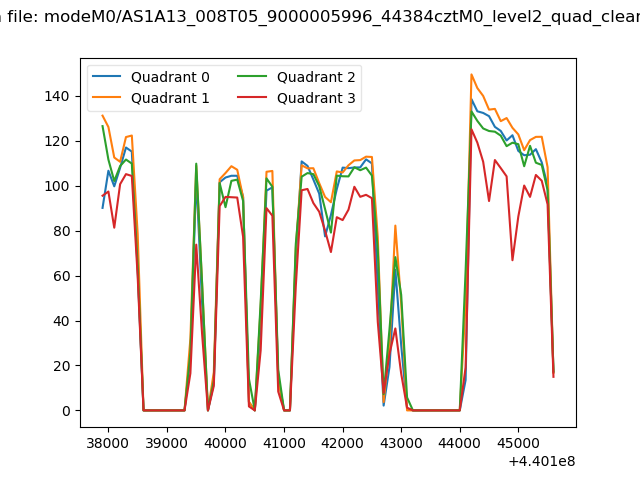 |
|
| Module-wise count rates for Quadrant A Data is divided into 100 sec bins |
 |
 |
| Module-wise count rates for Quadrant B Data is divided into 100 sec bins |
 |
 |
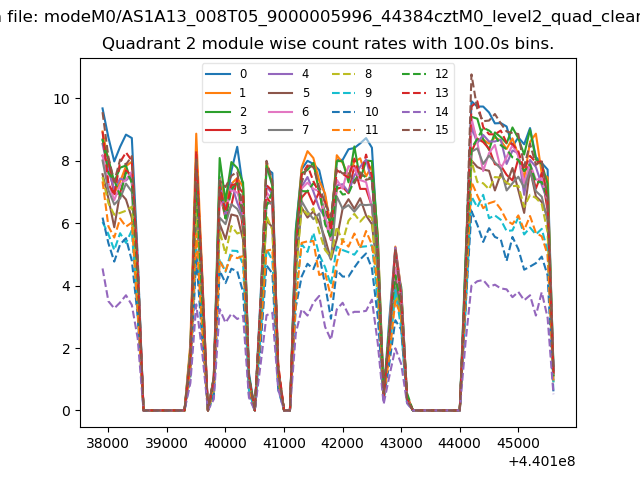
| Module-wise count rates for Quadrant C Data is divided into 100 sec bins |
 |
 |
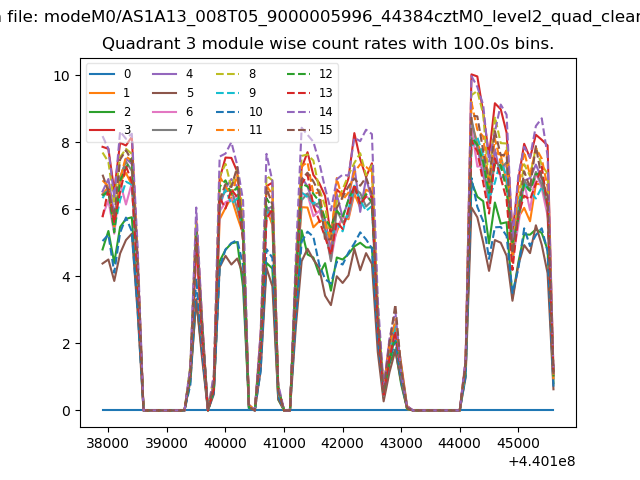
| Module-wise count rates for Quadrant D Data is divided into 100 sec bins |
 |
 |
| Parameter | Plot |
|---|---|
| CZT HV Monitor | 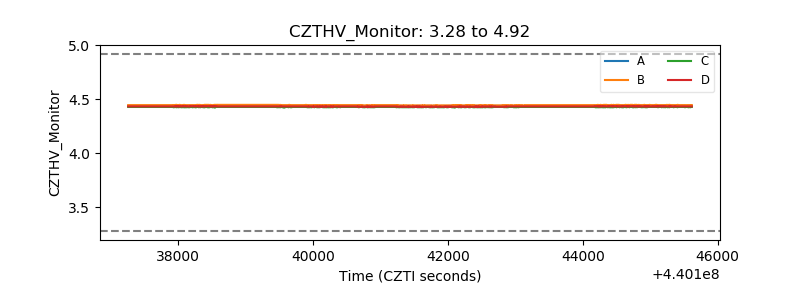 |
| D_VDD | 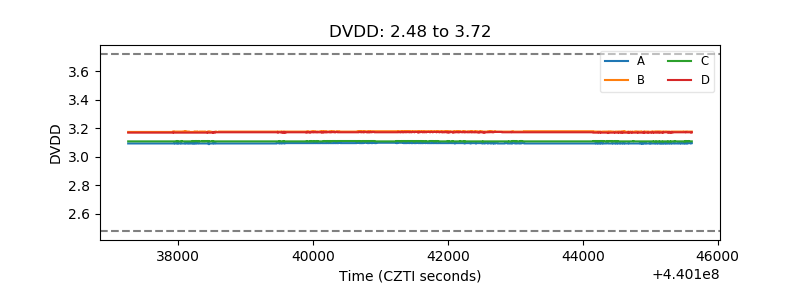 |
| Temperature 1 | 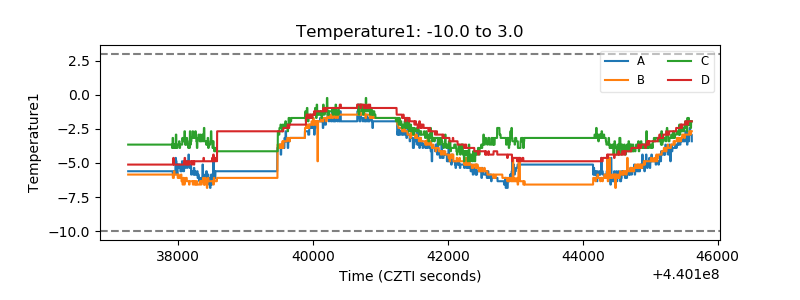 |
| Veto HV Monitor | 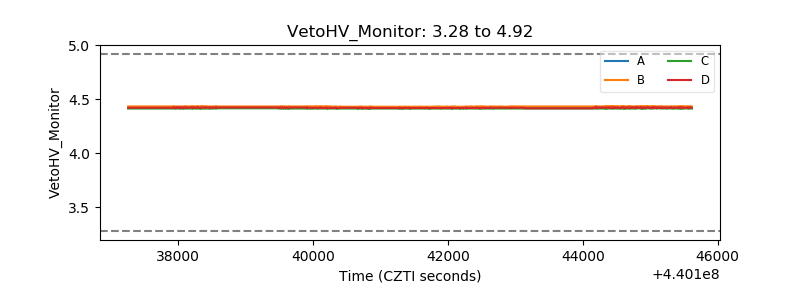 |
| Veto LLD | 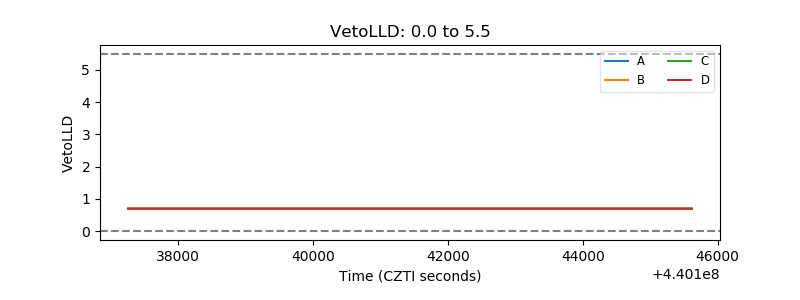 |
| Alpha Counter | 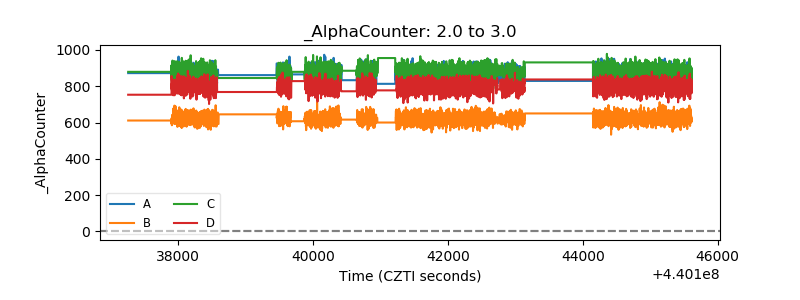 |
| _CPM_Rate | 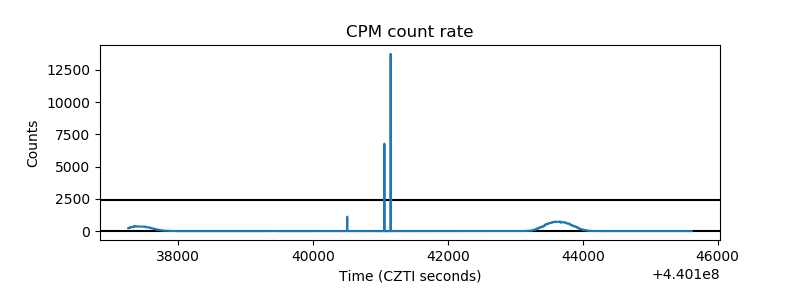 |
| CZT Counter | 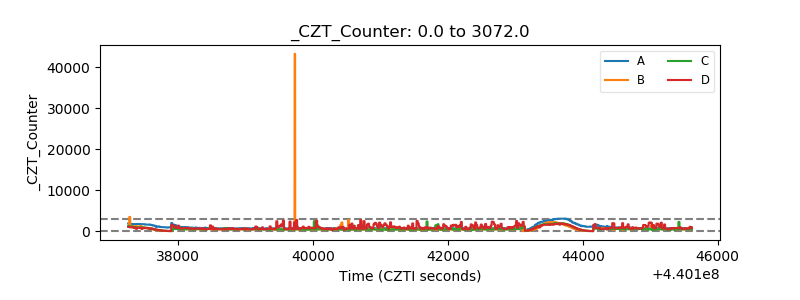 |
| +2.5 Volts monitor | 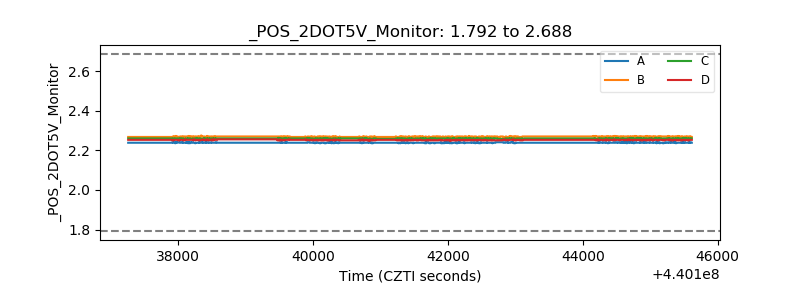 |
| +5 Volts monitor | 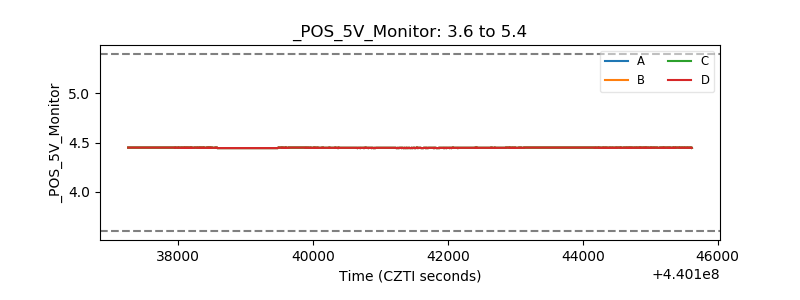 |
| _ROLL_ROT | 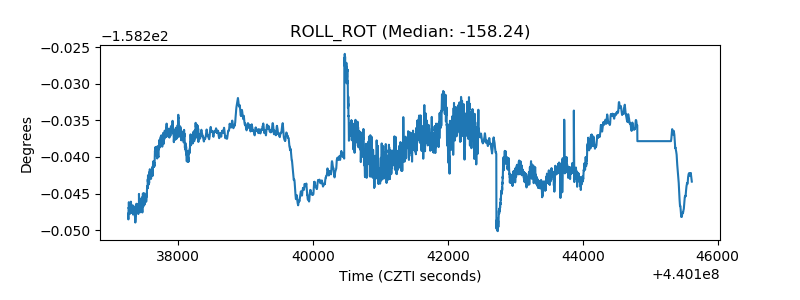 |
| _Roll_DEC | 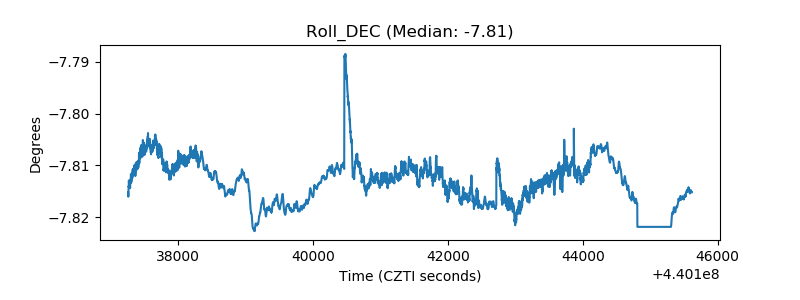 |
| _Roll_RA | 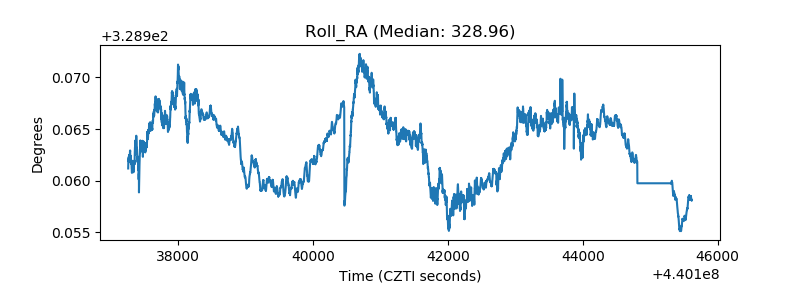 |
| Veto Counter | 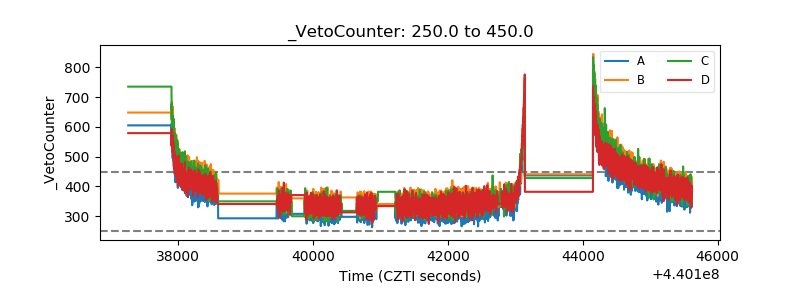 |