| Param | Original file | Final file |
|---|---|---|
| Filename | modeM0/AS1A13_008T05_9000005996_44388cztM0_level2.fits | modeM0/AS1A13_008T05_9000005996_44388cztM0_level2_quad_clean.evt |
| Size (bytes) | 2,082,784,320 | 463,936,320 |
| Size | 1.9 GB | 442.4 MB |
| Events in quadrant A | 20,883,386 | 3,142,264 |
| Events in quadrant B | 14,354,104 | 3,249,913 |
| Events in quadrant C | 13,345,136 | 3,110,136 |
| Events in quadrant D | 26,355,333 | 2,620,502 |
| Mode SS | |||
|---|---|---|---|
| Quadrant | BADHDUFLAG | Total packets | Discarded packets |
| A | 0 | 572 | 0 |
| B | 0 | 572 | 0 |
| C | 0 | 572 | 0 |
| D | 0 | 572 | 0 |
| Mode M0 | |||
|---|---|---|---|
| Quadrant | BADHDUFLAG | Total packets | Discarded packets |
| A | 0 | 86234 | 7 |
| B | 0 | 61069 | 5 |
| C | 0 | 59402 | 5 |
| D | 0 | 97428 | 5 |
| Mode M9 | |||
|---|---|---|---|
| Quadrant | BADHDUFLAG | Total packets | Discarded packets |
| A | 0 | 52 | 0 |
| B | 0 | 52 | 0 |
| C | 0 | 52 | 0 |
| D | 0 | 52 | 0 |
| Quadrant | Total seconds | Saturated seconds | Saturation percentage |
|---|---|---|---|
| A | 27975 | 801 | 2.863271% |
| B | 27976 | 572 | 2.044610% |
| C | 27976 | 317 | 1.133114% |
| D | 27976 | 3263 | 11.663569% |
Noise dominated data is calculated using 1-second bins in cleaned event files. If a bin has >2000 counts, and if more than 50% of those come from <1% of pixels, then it is considered to be noise-dominated and hence unusable.
| Quadrant | # 1 sec bins | Bins with >0 counts | Bins with >2000 counts | High rate bins dominated by noise | Noise dominated (total time) | Noise dominated (detector-on time) | Marked lightcurve |
|---|---|---|---|---|---|---|---|
| A | 38300 | 27976 | 159 | 159 | 0.42% | 0.57% | 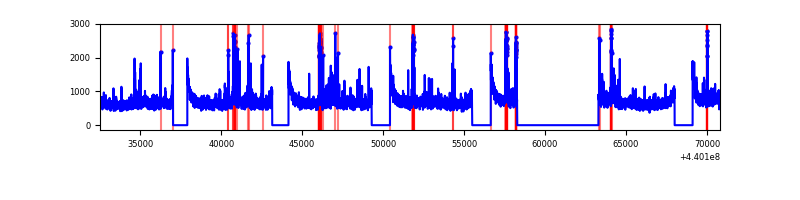 |
| B | 38301 | 27977 | 159 | 159 | 0.42% | 0.57% | 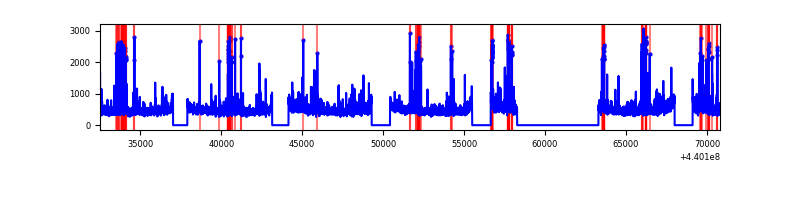 |
| C | 38301 | 27977 | 96 | 96 | 0.25% | 0.34% | 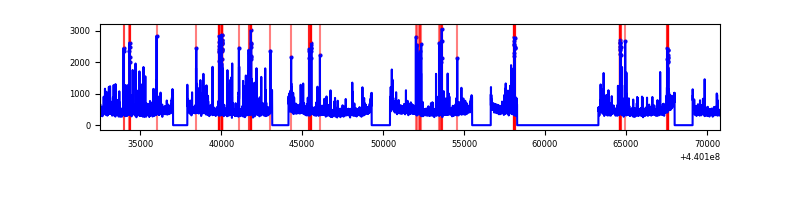 |
| D | 38301 | 27976 | 2651 | 2651 | 6.92% | 9.48% | 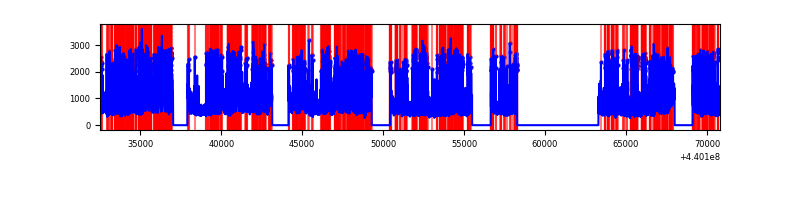 |
Top three noisy pixels from each quadrant. If the there are fewer than three noisy pixels in the level2.evt file, extra rows are filled as -1
| Pixel properties | Quadrant properties | ||||||
|---|---|---|---|---|---|---|---|
| Quadrant | DetID | PixID | Counts | Sigma | Mean | Median | Sigma |
| A | 10 | 83 | 7286344 | 10857.86 | 3260 | 3197 | 670.8 |
| A | 13 | 248 | 677588 | 1005.39 | 3260 | 3197 | 670.8 |
| A | 15 | 223 | 161150 | 235.48 | 3260 | 3197 | 670.8 |
| B | 5 | 172 | 436265 | 688.03 | 3243 | 3142 | 629.5 |
| B | 5 | 255 | 298329 | 468.91 | 3243 | 3142 | 629.5 |
| B | 0 | 190 | 234778 | 367.96 | 3243 | 3142 | 629.5 |
| C | 14 | 254 | 660115 | 884.68 | 3165 | 3185 | 742.6 |
| C | 0 | 207 | 154213 | 203.39 | 3165 | 3185 | 742.6 |
| C | 15 | 208 | 64092 | 82.02 | 3165 | 3185 | 742.6 |
| D | 1 | 52 | 3382150 | 4382.41 | 3063 | 2972 | 771.1 |
| D | 4 | 221 | 2696729 | 3493.49 | 3063 | 2972 | 771.1 |
| D | 13 | 249 | 1821303 | 2358.17 | 3063 | 2972 | 771.1 |
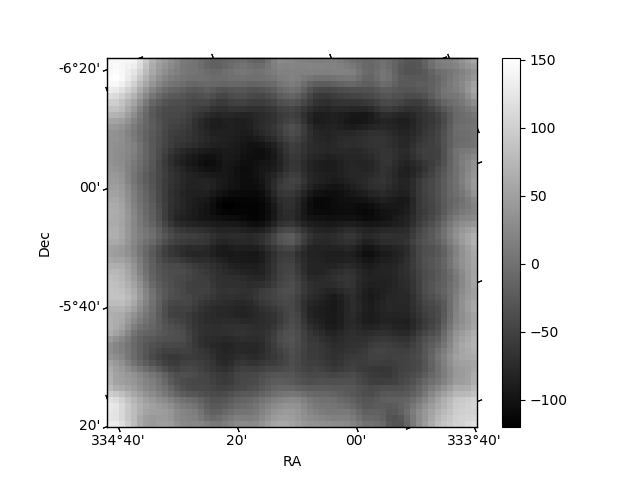
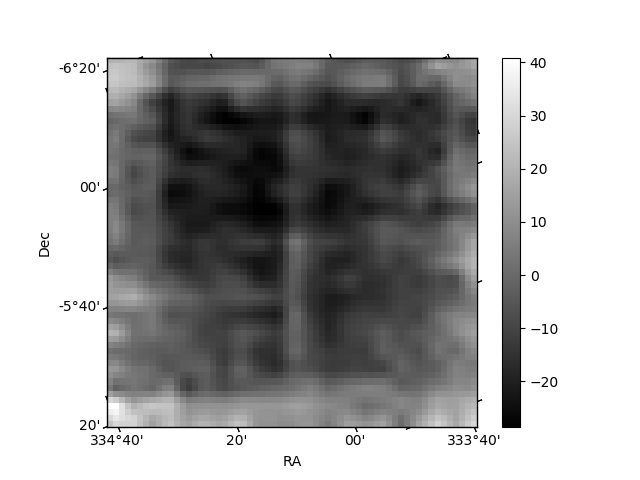
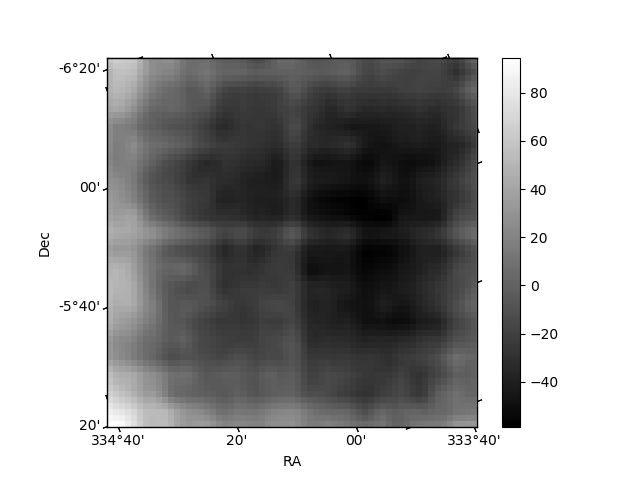
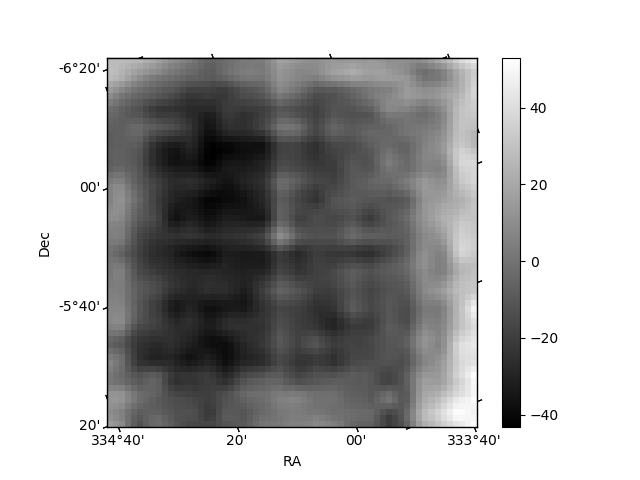
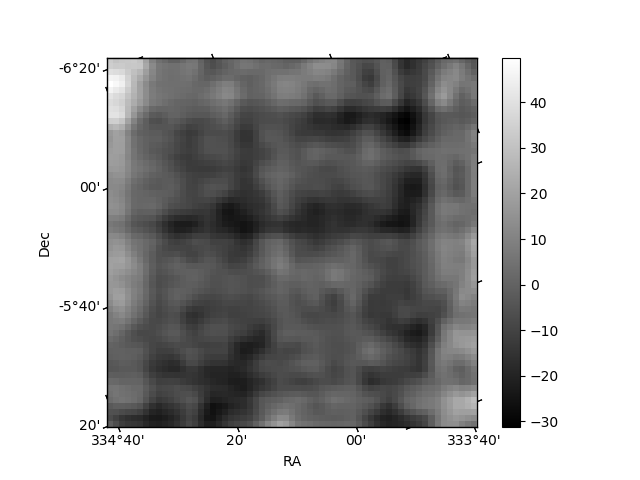
Histogram calculated using DETX and DETY for each event in the final _common_clean file
| Quadrant A | 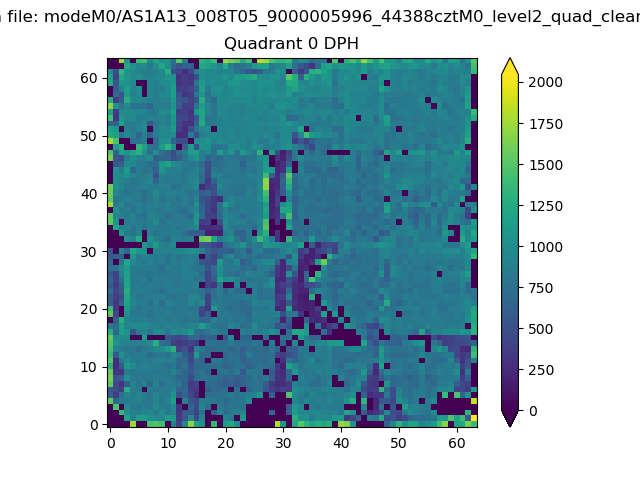 |
 |
Quadrant B |
|---|---|---|---|
| Quadrant D | 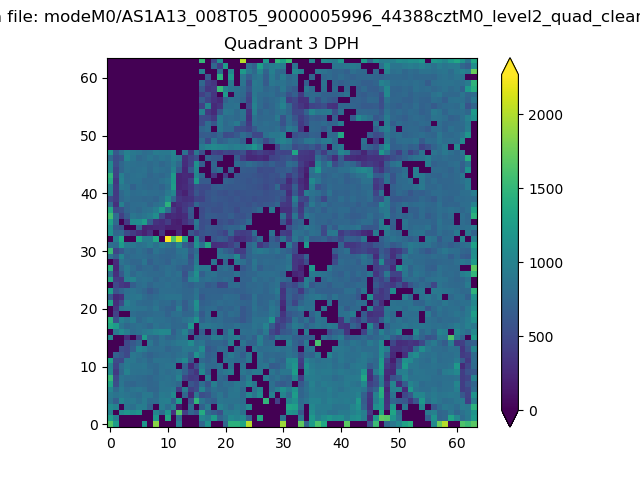 |
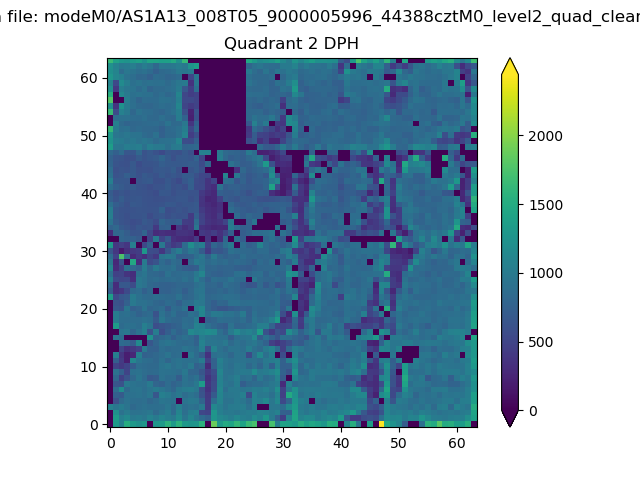 |
Quadrant C |
| Plot type | Count rate plots | Images |
|---|---|---|
| Comparison with Poisson distribution Blue bars denote a histogram of data divided into 1 sec bins. Red curve is a Poisson curve with rate = median count rate of data. |
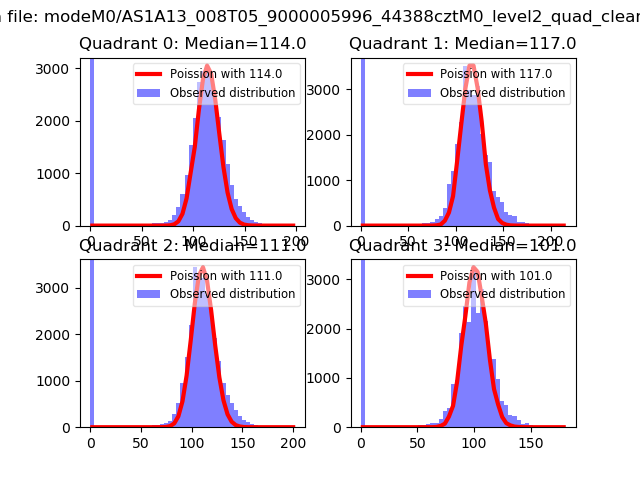 |
 |
| Quadrant-wise count rates Data is divided into 100 sec bins |
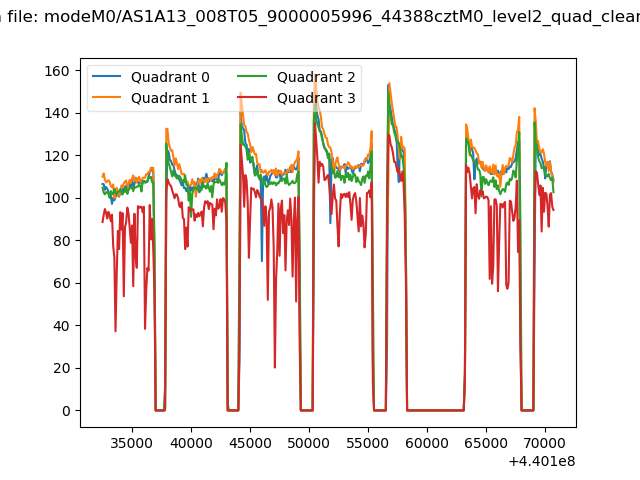 |
|
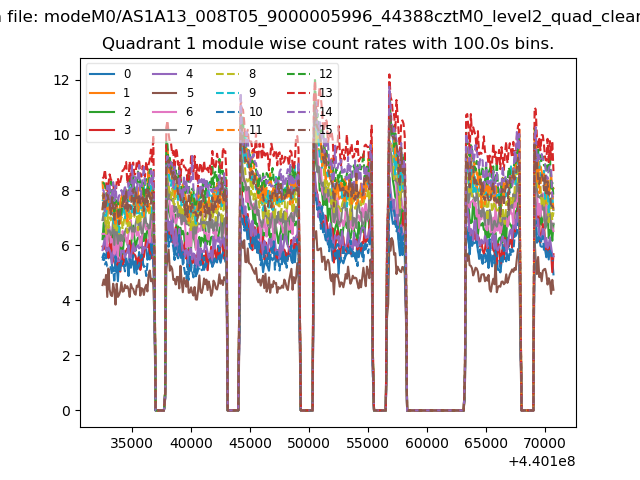
| Module-wise count rates for Quadrant A Data is divided into 100 sec bins |
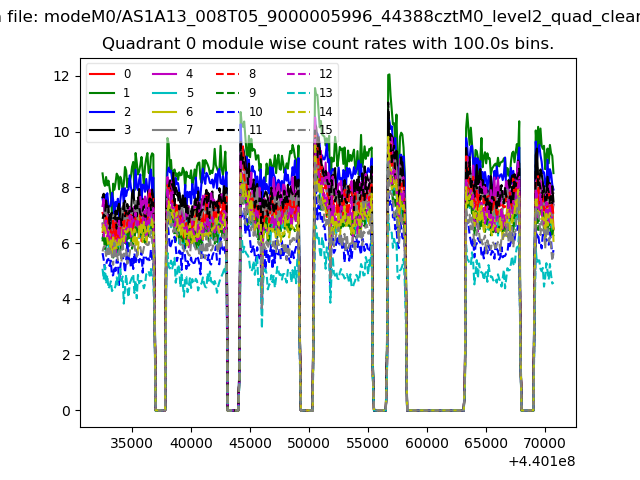 |
 |
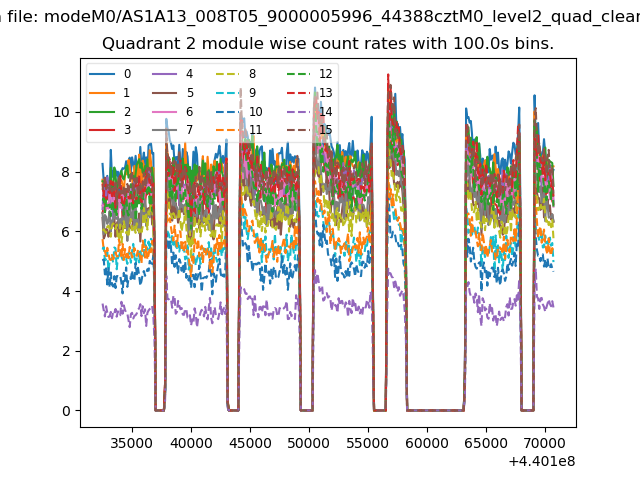
| Module-wise count rates for Quadrant B Data is divided into 100 sec bins |
 |
 |
| Module-wise count rates for Quadrant C Data is divided into 100 sec bins |
 |
 |
| Module-wise count rates for Quadrant D Data is divided into 100 sec bins |
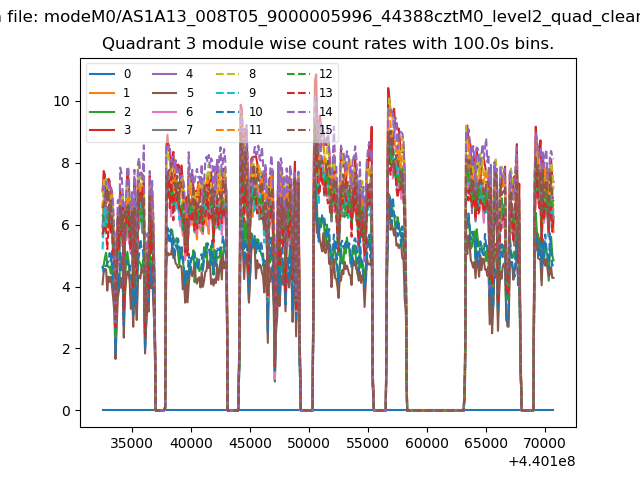 |
 |
| Parameter | Plot |
|---|---|
| CZT HV Monitor | 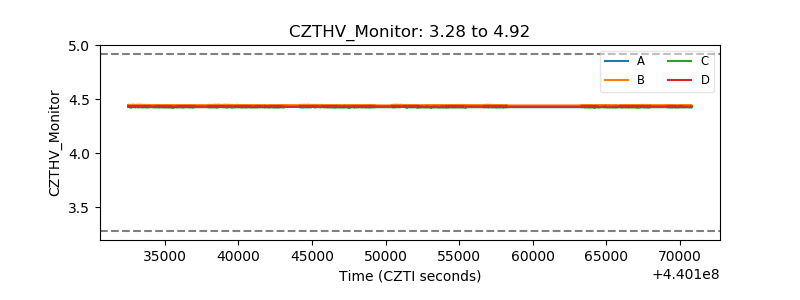 |
| D_VDD | 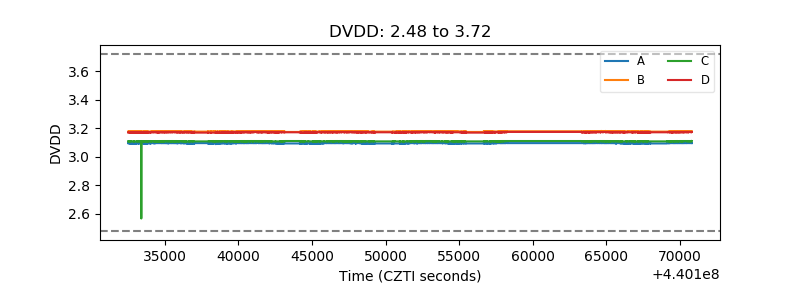 |
| Temperature 1 | 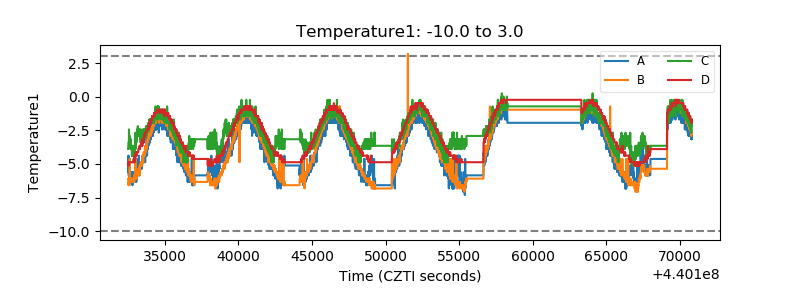 |
| Veto HV Monitor | 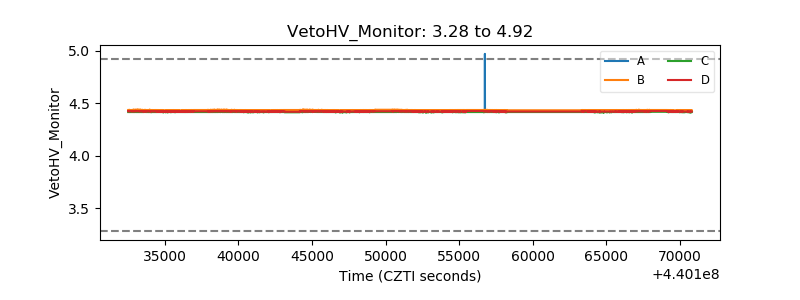 |
| Veto LLD | 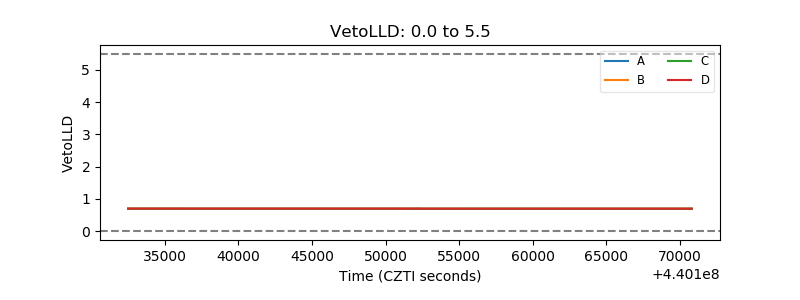 |
| Alpha Counter | 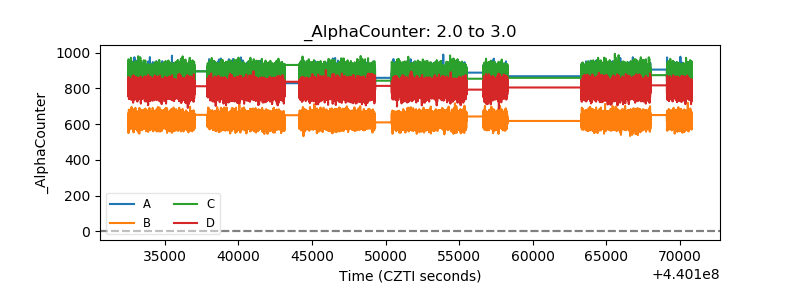 |
| _CPM_Rate | 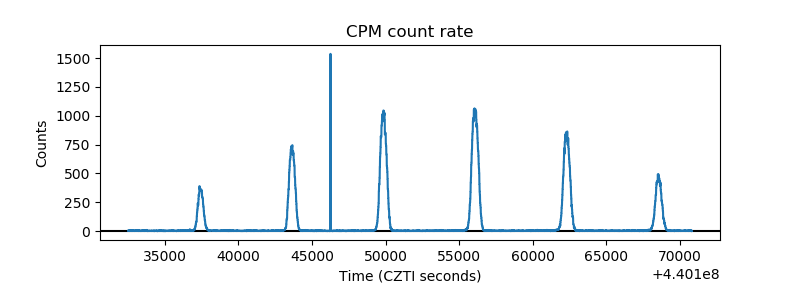 |
| CZT Counter | 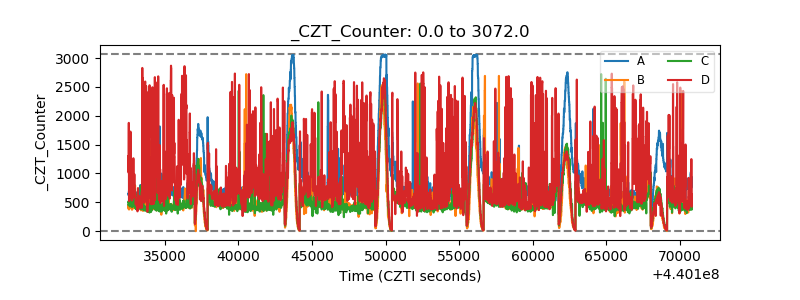 |
| +2.5 Volts monitor | 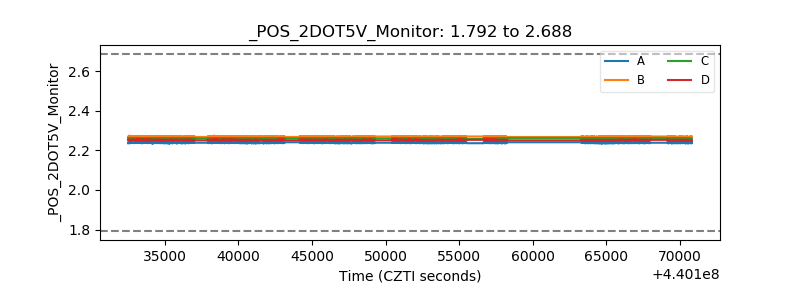 |
| +5 Volts monitor | 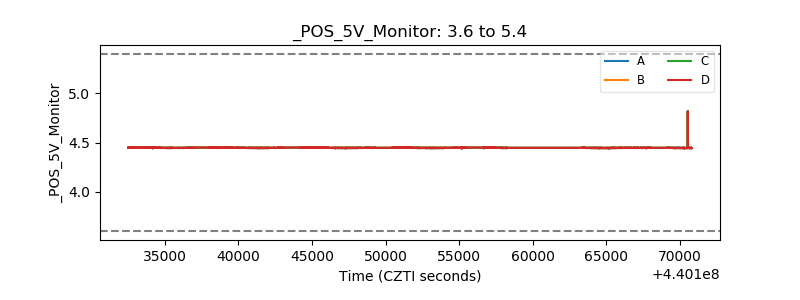 |
| _ROLL_ROT | 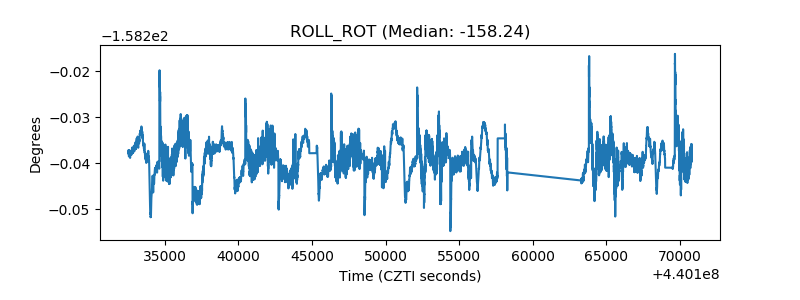 |
| _Roll_DEC | 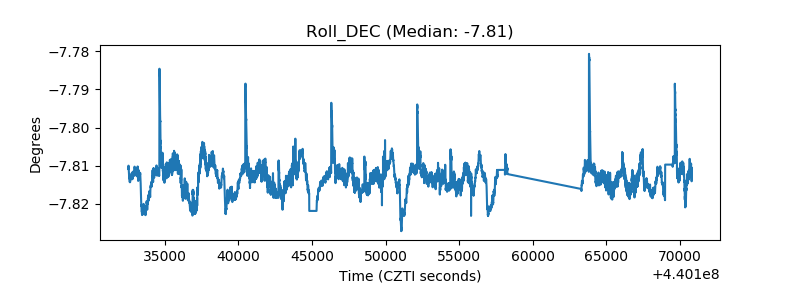 |
| _Roll_RA | 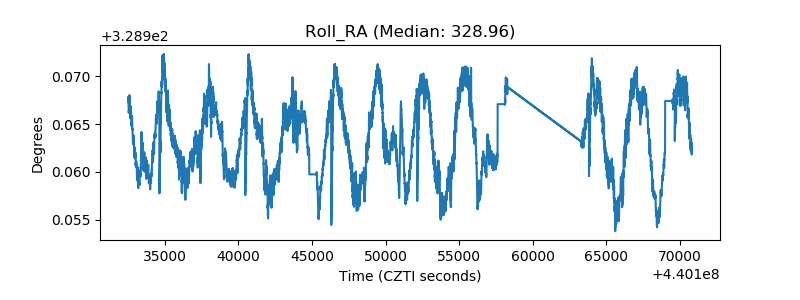 |
| Veto Counter | 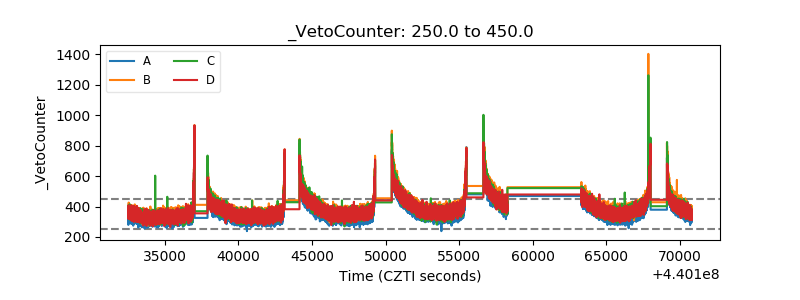 |