| Param | Original file | Final file |
|---|---|---|
| Filename | modeM0/AS1A13_008T05_9000005996_44390cztM0_level2.fits | modeM0/AS1A13_008T05_9000005996_44390cztM0_level2_quad_clean.evt |
| Size (bytes) | 515,908,800 | 106,678,080 |
| Size | 492.0 MB | 101.7 MB |
| Events in quadrant A | 4,918,534 | 729,135 |
| Events in quadrant B | 4,185,423 | 728,545 |
| Events in quadrant C | 3,186,332 | 716,611 |
| Events in quadrant D | 6,284,473 | 586,179 |
| Mode SS | |||
|---|---|---|---|
| Quadrant | BADHDUFLAG | Total packets | Discarded packets |
| A | 0 | 138 | 0 |
| B | 0 | 138 | 0 |
| C | 0 | 138 | 0 |
| D | 0 | 138 | 0 |
| Mode M0 | |||
|---|---|---|---|
| Quadrant | BADHDUFLAG | Total packets | Discarded packets |
| A | 0 | 20176 | 1 |
| B | 0 | 17144 | 1 |
| C | 0 | 14331 | 1 |
| D | 0 | 23213 | 1 |
| Mode M9 | |||
|---|---|---|---|
| Quadrant | BADHDUFLAG | Total packets | Discarded packets |
| A | 0 | 6 | 0 |
| B | 0 | 6 | 0 |
| C | 0 | 6 | 0 |
| D | 0 | 6 | 0 |
| Quadrant | Total seconds | Saturated seconds | Saturation percentage |
|---|---|---|---|
| A | 6730 | 141 | 2.095097% |
| B | 6730 | 310 | 4.606241% |
| C | 6730 | 44 | 0.653789% |
| D | 6730 | 891 | 13.239227% |
Noise dominated data is calculated using 1-second bins in cleaned event files. If a bin has >2000 counts, and if more than 50% of those come from <1% of pixels, then it is considered to be noise-dominated and hence unusable.
| Quadrant | # 1 sec bins | Bins with >0 counts | Bins with >2000 counts | High rate bins dominated by noise | Noise dominated (total time) | Noise dominated (detector-on time) | Marked lightcurve |
|---|---|---|---|---|---|---|---|
| A | 7345 | 6731 | 18 | 18 | 0.25% | 0.27% | 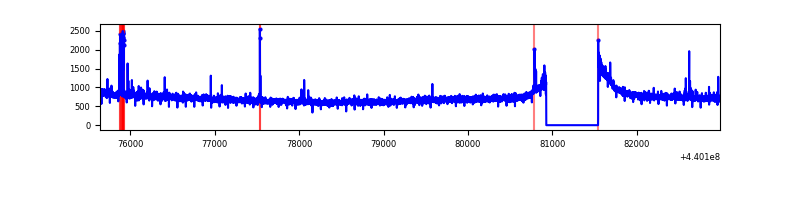 |
| B | 7345 | 6730 | 110 | 110 | 1.50% | 1.63% | 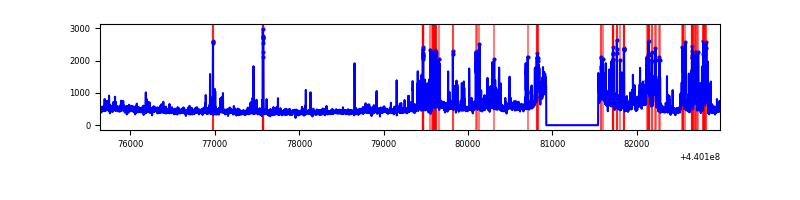 |
| C | 7345 | 6731 | 28 | 28 | 0.38% | 0.42% | 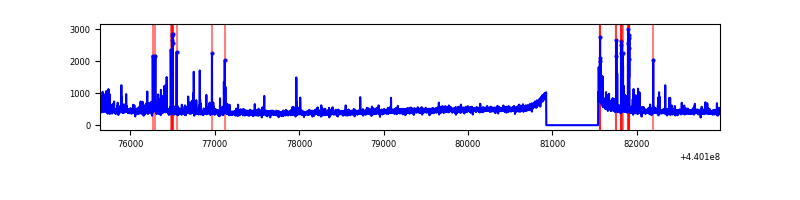 |
| D | 7345 | 6730 | 902 | 902 | 12.28% | 13.40% | 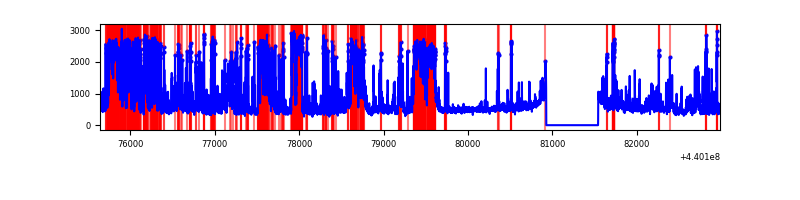 |
Top three noisy pixels from each quadrant. If the there are fewer than three noisy pixels in the level2.evt file, extra rows are filled as -1
| Pixel properties | Quadrant properties | ||||||
|---|---|---|---|---|---|---|---|
| Quadrant | DetID | PixID | Counts | Sigma | Mean | Median | Sigma |
| A | 10 | 83 | 1835626 | 11406.25 | 766 | 752 | 160.9 |
| A | 13 | 248 | 79303 | 488.3 | 766 | 752 | 160.9 |
| A | 0 | 243 | 15926 | 94.33 | 766 | 752 | 160.9 |
| B | 5 | 235 | 440492 | 2952.21 | 756 | 734 | 149.0 |
| B | 5 | 255 | 436217 | 2923.52 | 756 | 734 | 149.0 |
| B | 7 | 221 | 78848 | 524.4 | 756 | 734 | 149.0 |
| C | 12 | 250 | 125895 | 712.73 | 743 | 748 | 175.6 |
| C | 14 | 254 | 87685 | 495.11 | 743 | 748 | 175.6 |
| C | 3 | 233 | 22139 | 121.82 | 743 | 748 | 175.6 |
| D | 4 | 221 | 1035219 | 5760.65 | 708 | 685 | 179.6 |
| D | 12 | 233 | 683749 | 3803.54 | 708 | 685 | 179.6 |
| D | 1 | 52 | 493215 | 2742.58 | 708 | 685 | 179.6 |
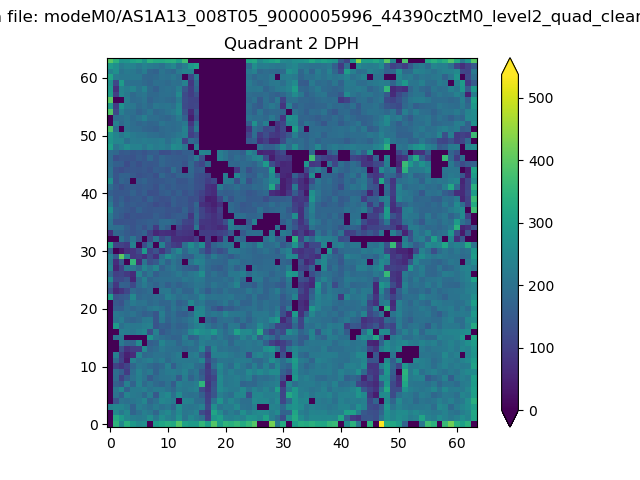
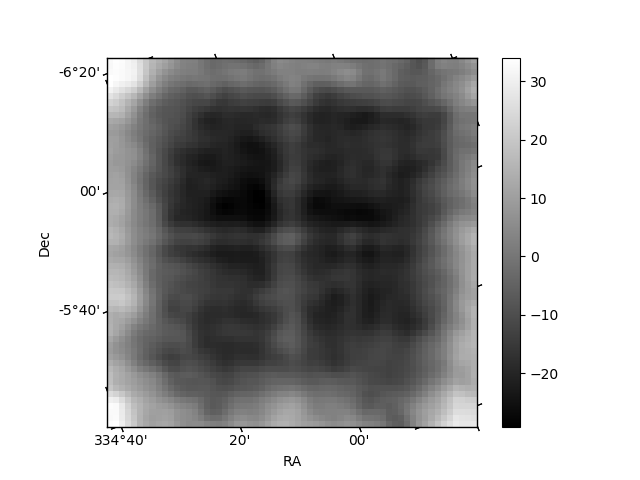
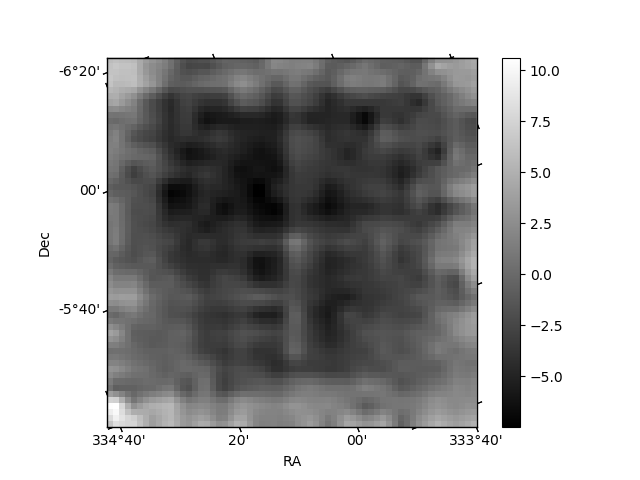
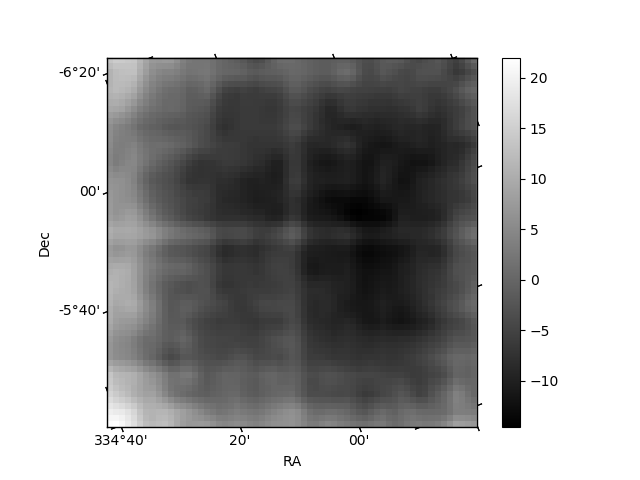
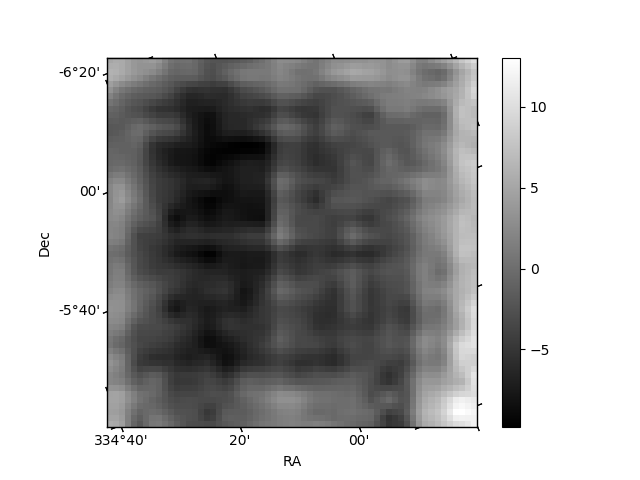
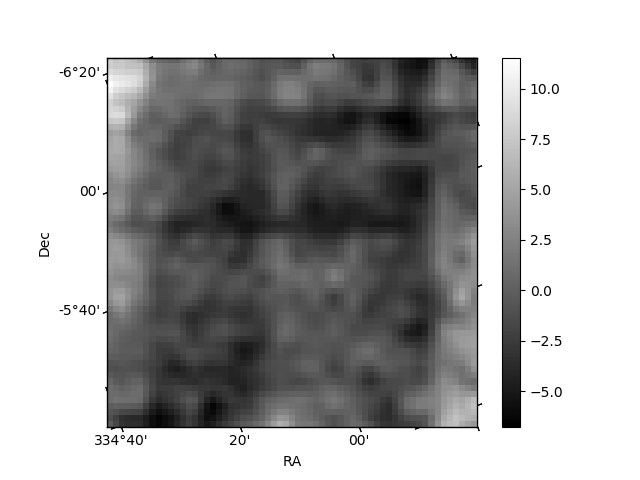
Histogram calculated using DETX and DETY for each event in the final _common_clean file
| Quadrant A | 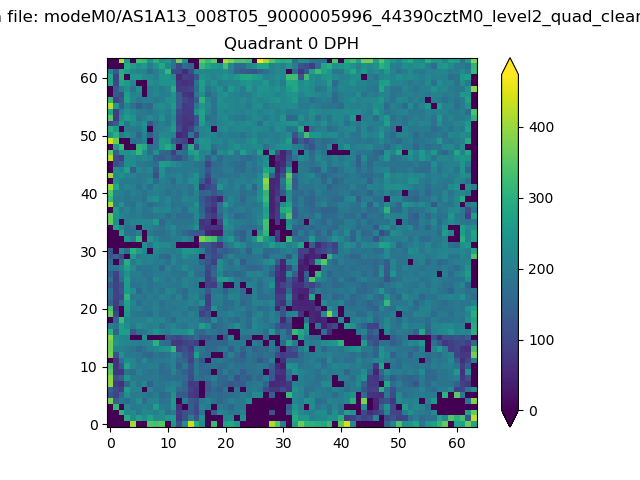 |
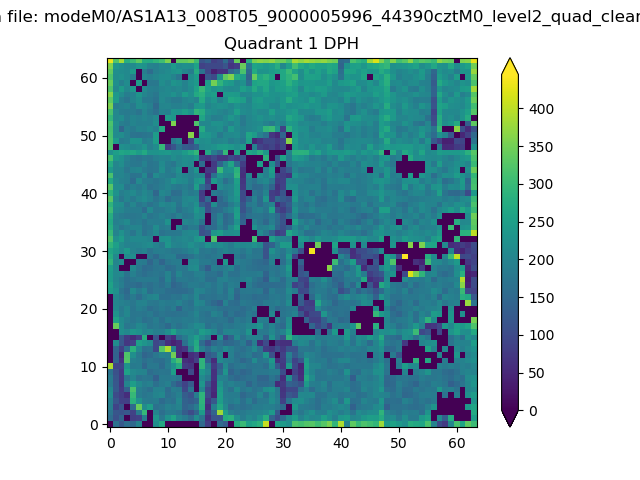 |
Quadrant B |
|---|---|---|---|
| Quadrant D | 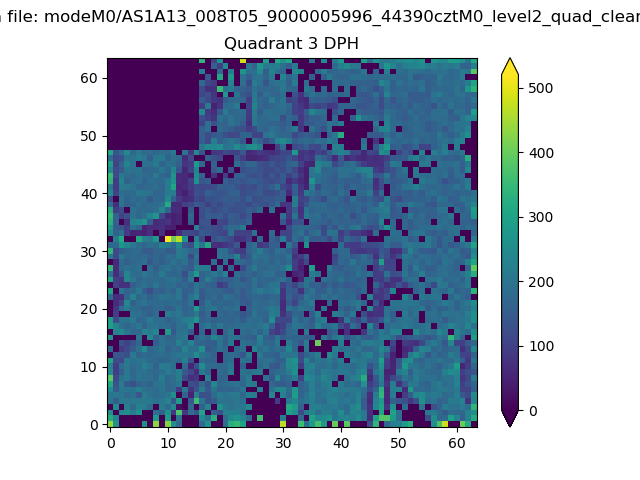 |
 |
Quadrant C |
| Plot type | Count rate plots | Images |
|---|---|---|
| Comparison with Poisson distribution Blue bars denote a histogram of data divided into 1 sec bins. Red curve is a Poisson curve with rate = median count rate of data. |
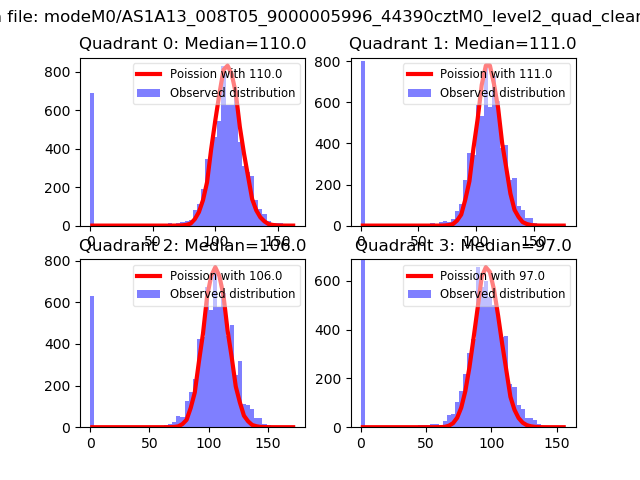 |
 |
| Quadrant-wise count rates Data is divided into 100 sec bins |
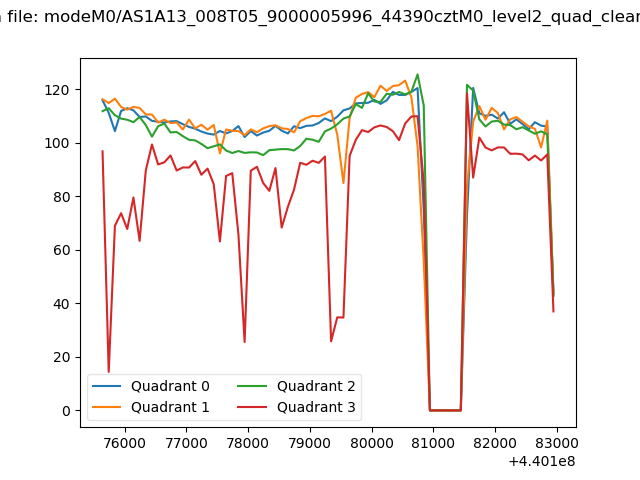 |
|
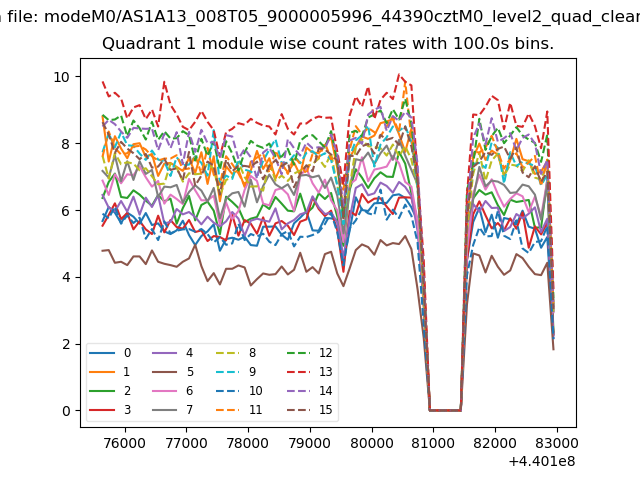
| Module-wise count rates for Quadrant A Data is divided into 100 sec bins |
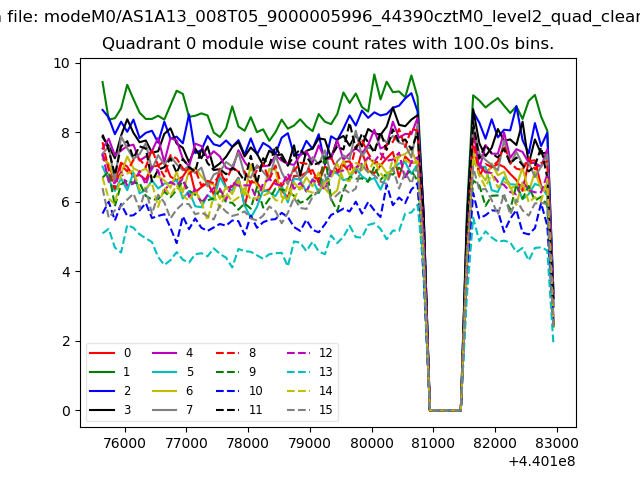 |
 |
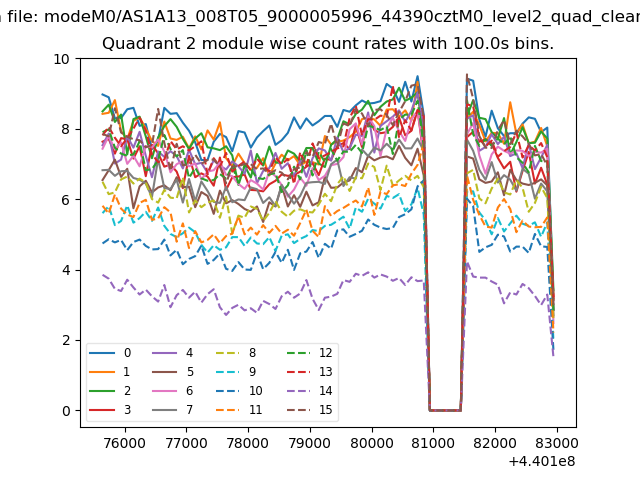
| Module-wise count rates for Quadrant B Data is divided into 100 sec bins |
 |
 |
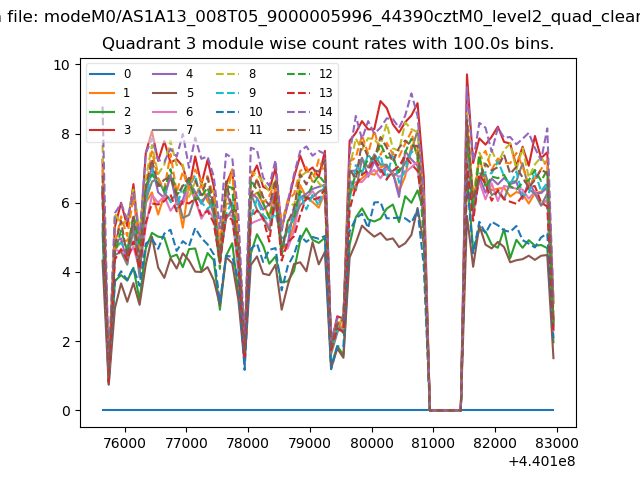
| Module-wise count rates for Quadrant C Data is divided into 100 sec bins |
 |
 |
| Module-wise count rates for Quadrant D Data is divided into 100 sec bins |
 |
 |
| Parameter | Plot |
|---|---|
| CZT HV Monitor | 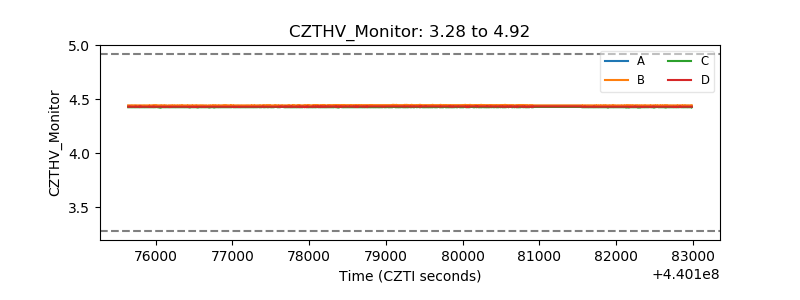 |
| D_VDD | 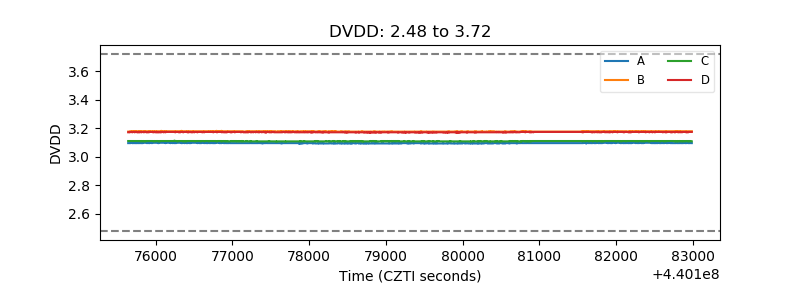 |
| Temperature 1 | 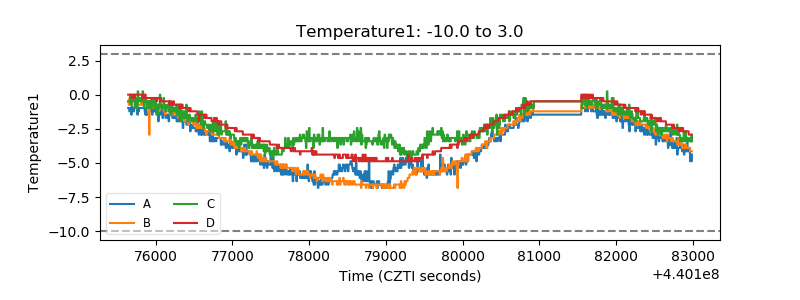 |
| Veto HV Monitor | 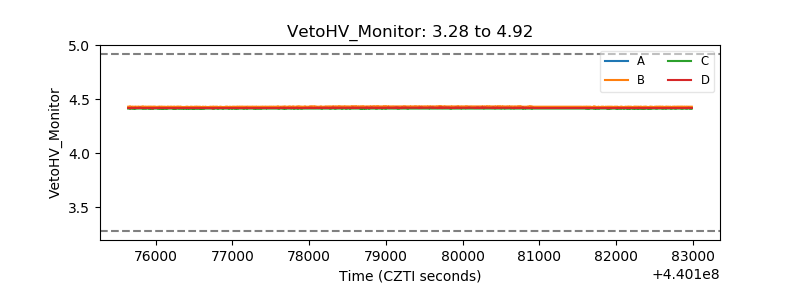 |
| Veto LLD | 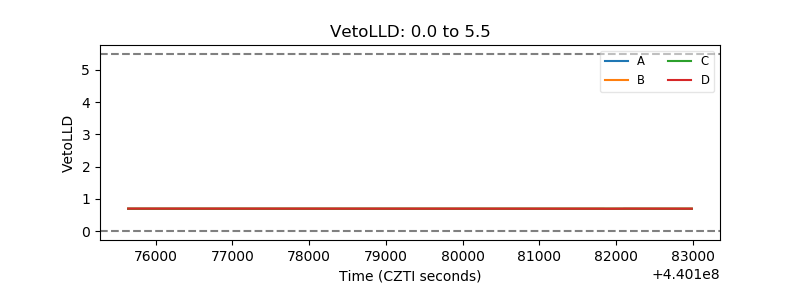 |
| Alpha Counter | 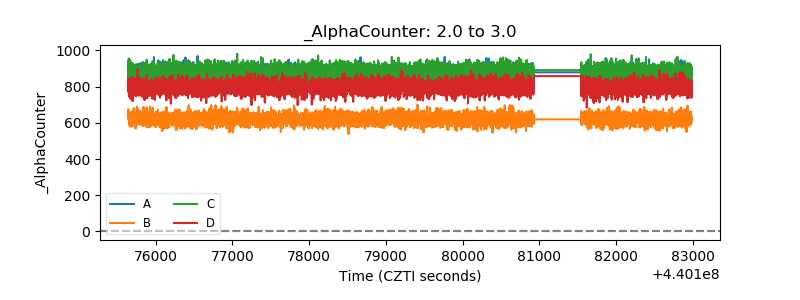 |
| _CPM_Rate | 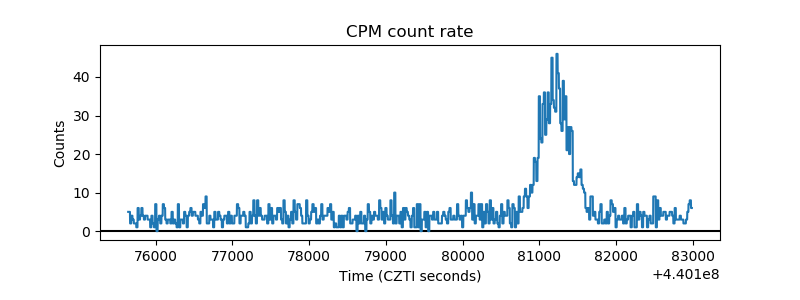 |
| CZT Counter | 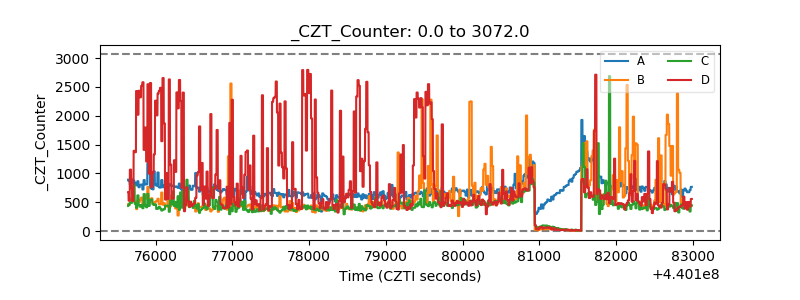 |
| +2.5 Volts monitor | 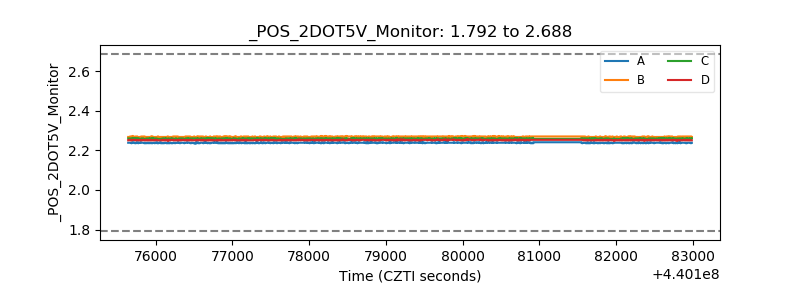 |
| +5 Volts monitor | 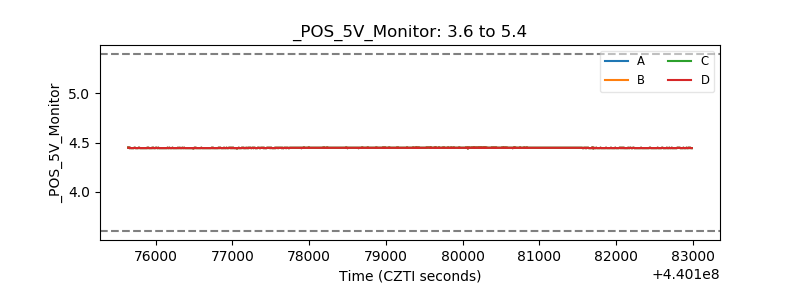 |
| _ROLL_ROT | 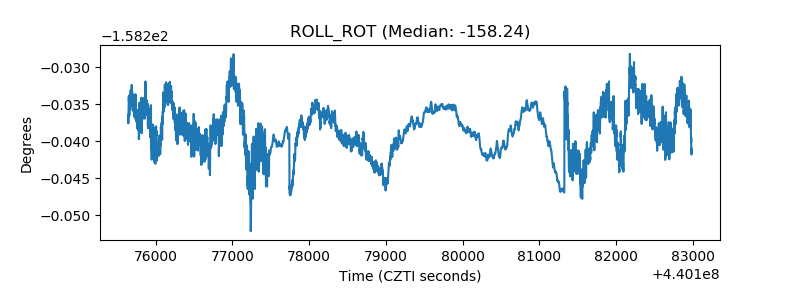 |
| _Roll_DEC | 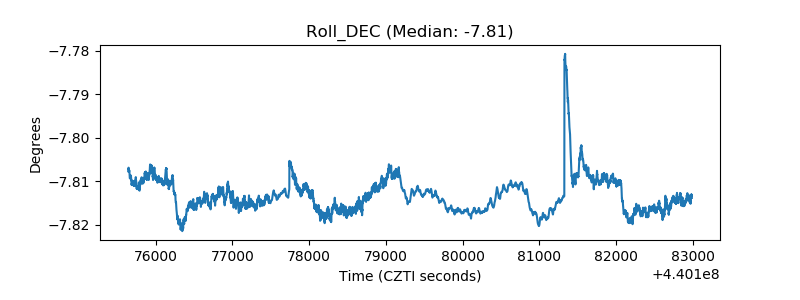 |
| _Roll_RA | 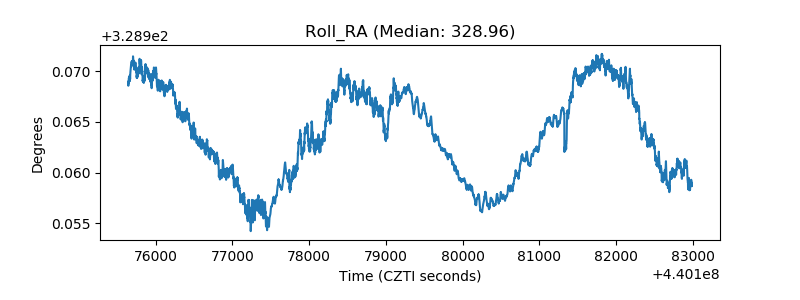 |
| Veto Counter | 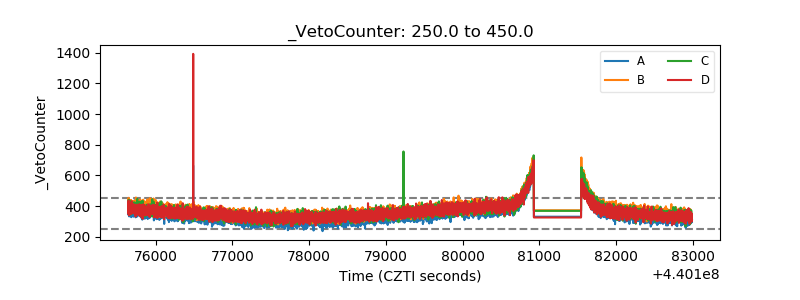 |